
|
|||||
|
 | |
| |
| |
| |
| |
| |
|
Gene: HMOX2 |
Gene summary for HMOX2 |
| Gene information | Species | Human | Gene symbol | HMOX2 | Gene ID | 3163 |
| Gene name | heme oxygenase 2 | |
| Gene Alias | HO-2 | |
| Cytomap | 16p13.3 | |
| Gene Type | protein-coding | GO ID | GO:0001666 | UniProtAcc | P30519 |
Top |
Malignant transformation analysis |
| Identification of the aberrant gene expression in precancerous and cancerous lesions by comparing the gene expression of stem-like cells in diseased tissues with normal stem cells |
| Entrez ID | Symbol | Replicates | Species | Organ | Tissue | Adj P-value | Log2FC | Malignancy |
| 3163 | HMOX2 | LZE4T | Human | Esophagus | ESCC | 9.05e-17 | 6.66e-01 | 0.0811 |
| 3163 | HMOX2 | LZE7T | Human | Esophagus | ESCC | 9.69e-19 | 8.18e-01 | 0.0667 |
| 3163 | HMOX2 | LZE8T | Human | Esophagus | ESCC | 7.83e-09 | 6.24e-01 | 0.067 |
| 3163 | HMOX2 | LZE20T | Human | Esophagus | ESCC | 3.66e-06 | 1.31e-01 | 0.0662 |
| 3163 | HMOX2 | LZE22T | Human | Esophagus | ESCC | 2.04e-05 | 5.86e-01 | 0.068 |
| 3163 | HMOX2 | LZE24T | Human | Esophagus | ESCC | 5.11e-18 | 6.51e-01 | 0.0596 |
| 3163 | HMOX2 | LZE21T | Human | Esophagus | ESCC | 2.14e-05 | 8.35e-01 | 0.0655 |
| 3163 | HMOX2 | LZE6T | Human | Esophagus | ESCC | 4.51e-04 | 4.52e-01 | 0.0845 |
| 3163 | HMOX2 | P1T-E | Human | Esophagus | ESCC | 3.78e-12 | 8.16e-01 | 0.0875 |
| 3163 | HMOX2 | P2T-E | Human | Esophagus | ESCC | 5.15e-39 | 8.04e-01 | 0.1177 |
| 3163 | HMOX2 | P4T-E | Human | Esophagus | ESCC | 2.52e-24 | 6.99e-01 | 0.1323 |
| 3163 | HMOX2 | P5T-E | Human | Esophagus | ESCC | 1.39e-60 | 1.33e+00 | 0.1327 |
| 3163 | HMOX2 | P8T-E | Human | Esophagus | ESCC | 2.30e-35 | 4.01e-01 | 0.0889 |
| 3163 | HMOX2 | P9T-E | Human | Esophagus | ESCC | 7.57e-23 | 5.88e-01 | 0.1131 |
| 3163 | HMOX2 | P10T-E | Human | Esophagus | ESCC | 4.43e-06 | 1.81e-01 | 0.116 |
| 3163 | HMOX2 | P11T-E | Human | Esophagus | ESCC | 2.10e-26 | 1.34e+00 | 0.1426 |
| 3163 | HMOX2 | P12T-E | Human | Esophagus | ESCC | 4.71e-52 | 9.96e-01 | 0.1122 |
| 3163 | HMOX2 | P15T-E | Human | Esophagus | ESCC | 2.37e-29 | 8.10e-01 | 0.1149 |
| 3163 | HMOX2 | P16T-E | Human | Esophagus | ESCC | 2.47e-18 | 2.47e-01 | 0.1153 |
| 3163 | HMOX2 | P17T-E | Human | Esophagus | ESCC | 1.35e-12 | 8.40e-01 | 0.1278 |
| Page: 1 2 3 4 5 6 |
| Tissue | Expression Dynamics | Abbreviation |
| Esophagus | 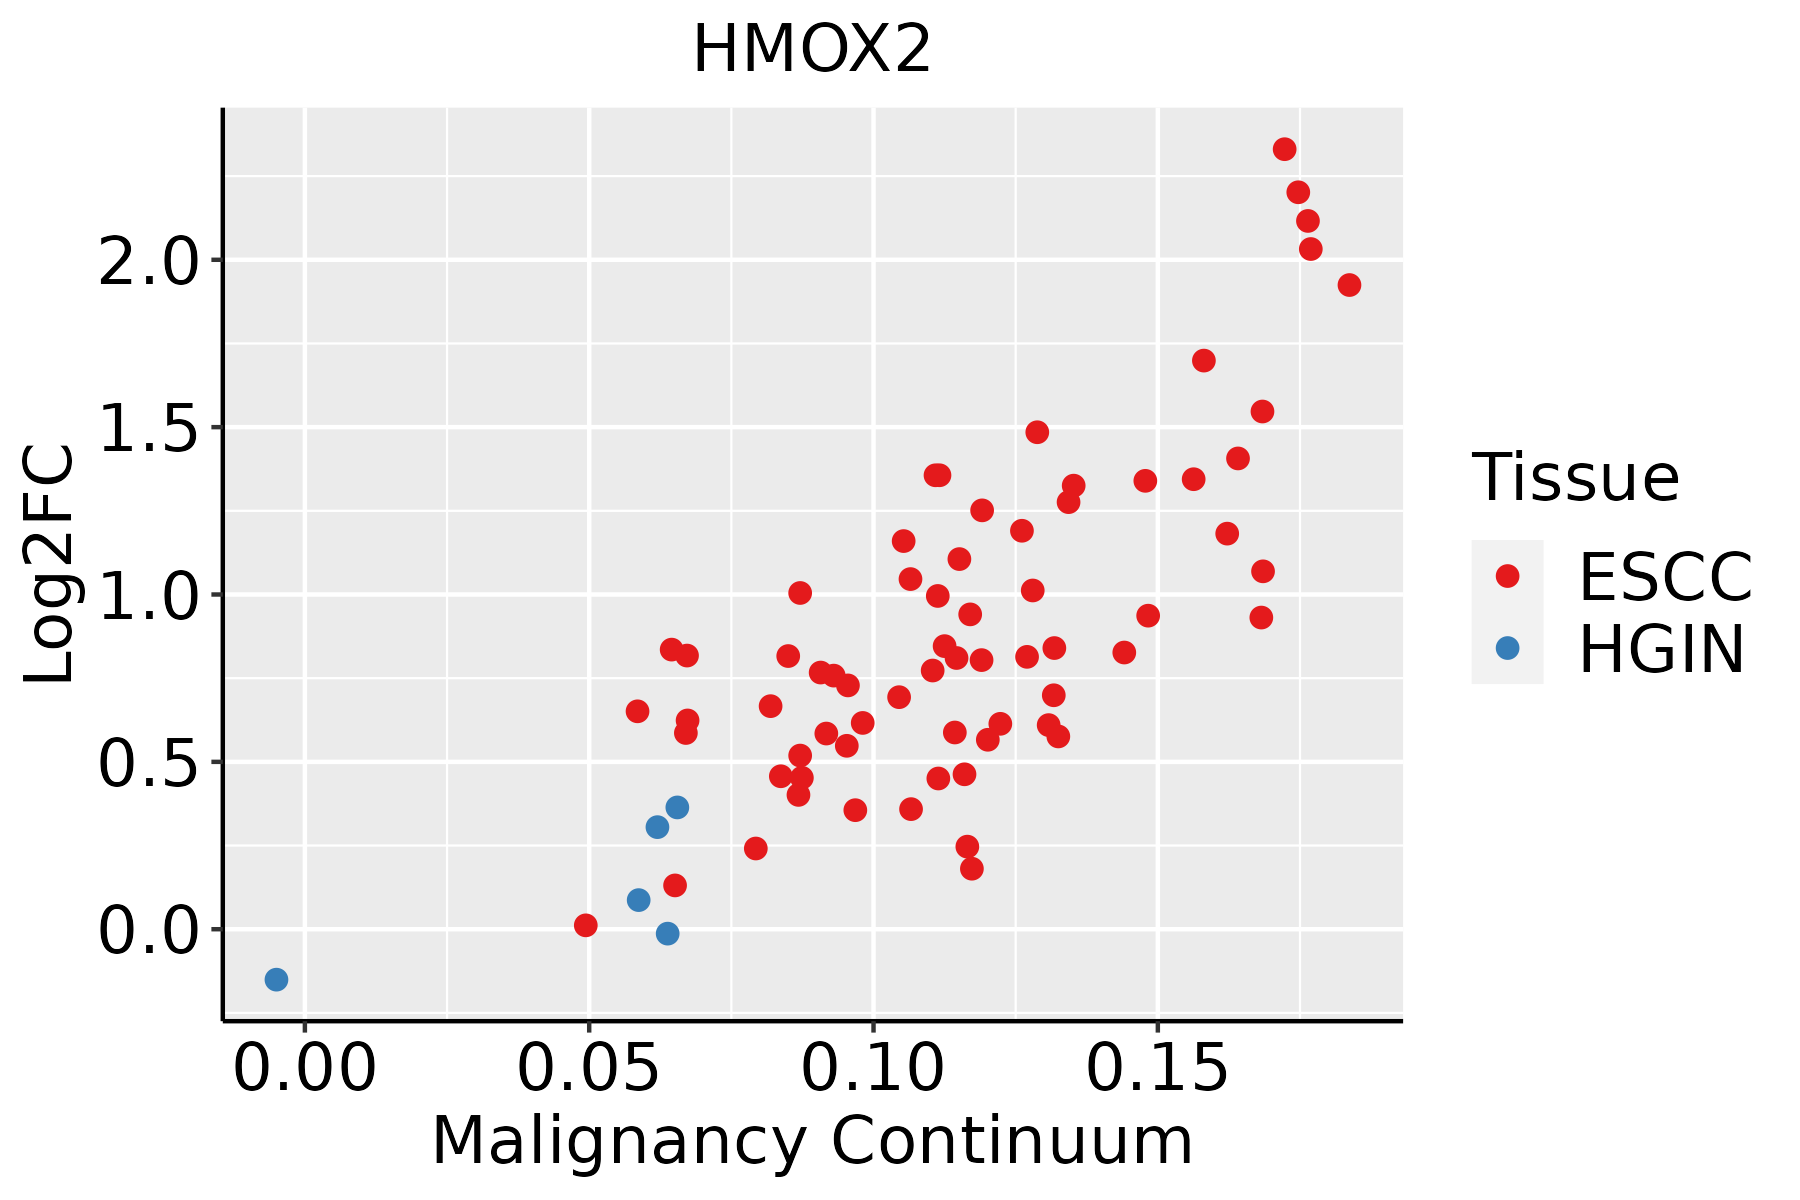 | ESCC: Esophageal squamous cell carcinoma |
| HGIN: High-grade intraepithelial neoplasias | ||
| LGIN: Low-grade intraepithelial neoplasias | ||
| Liver | 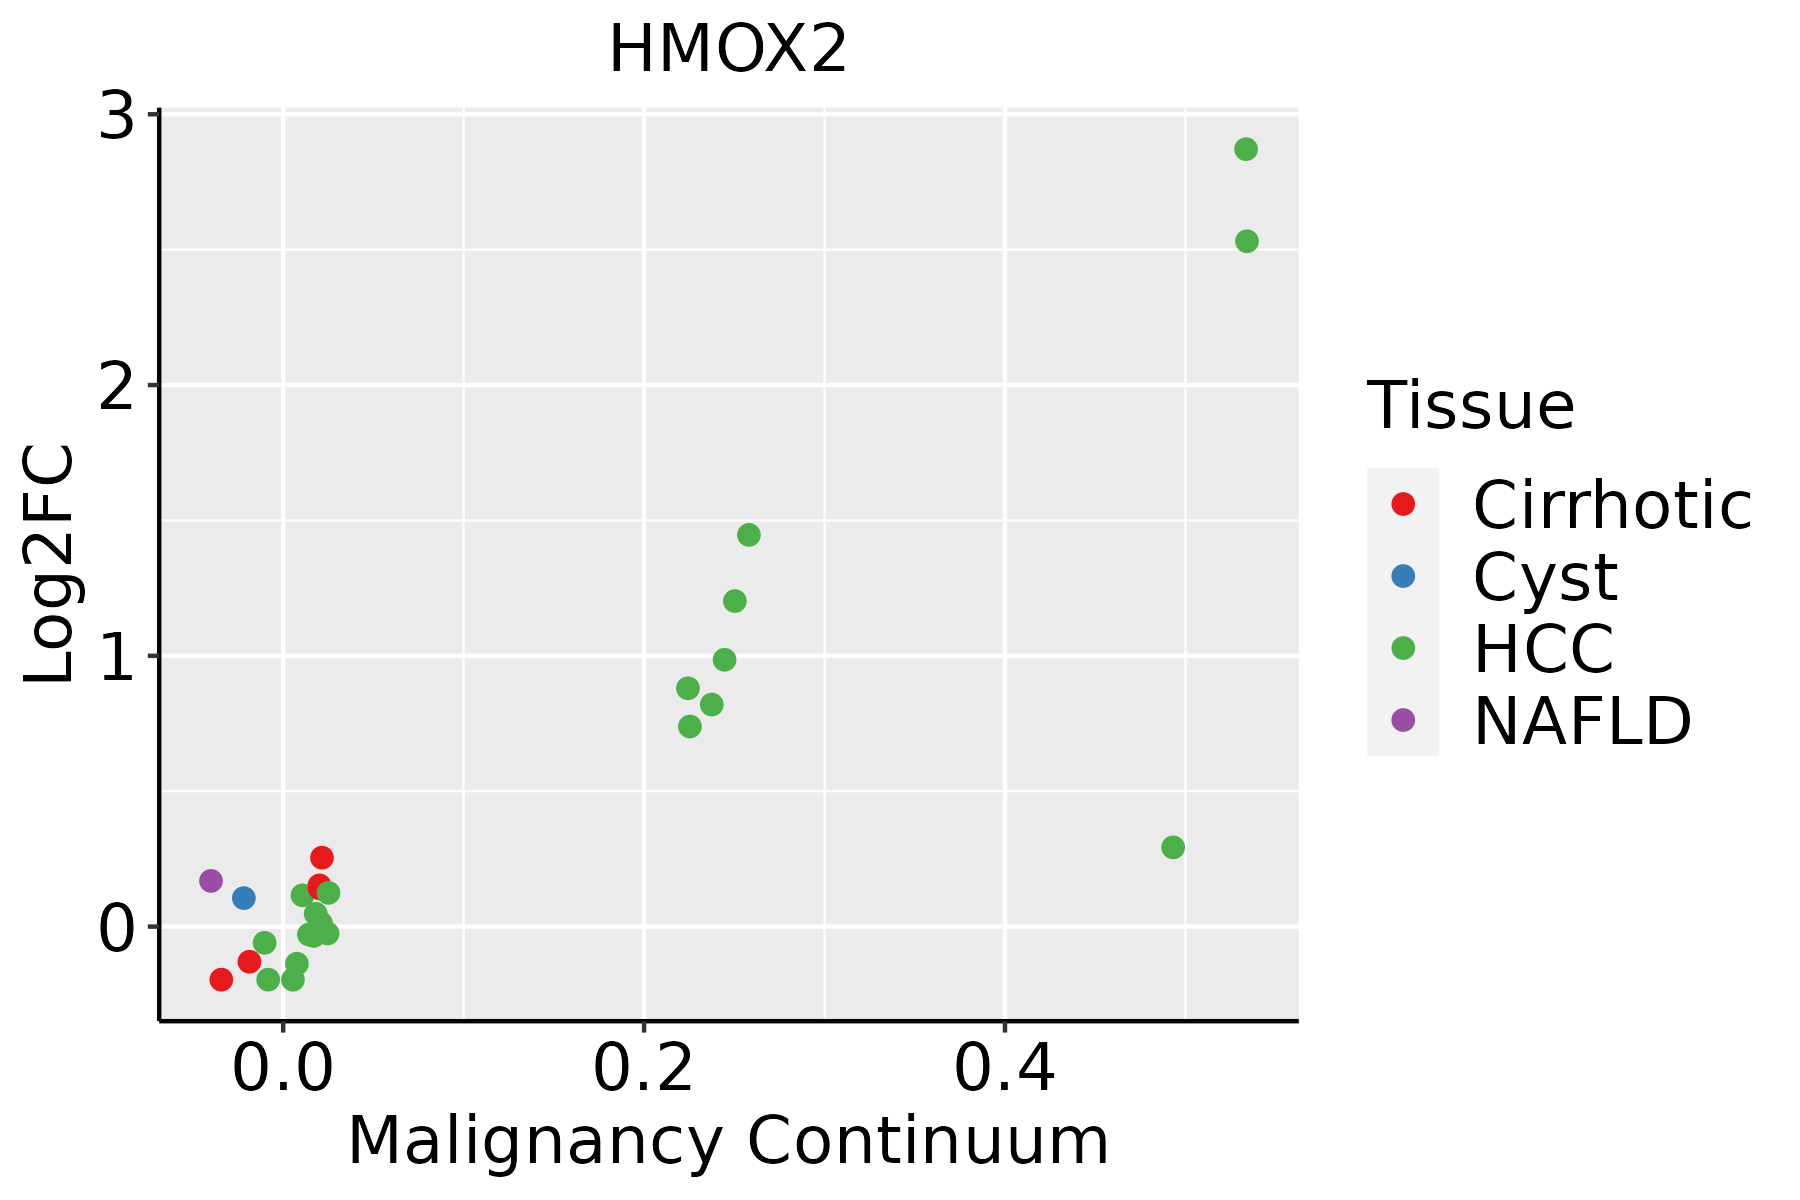 | HCC: Hepatocellular carcinoma |
| NAFLD: Non-alcoholic fatty liver disease | ||
| Oral Cavity |  | EOLP: Erosive Oral lichen planus |
| LP: leukoplakia | ||
| NEOLP: Non-erosive oral lichen planus | ||
| OSCC: Oral squamous cell carcinoma | ||
| Skin | 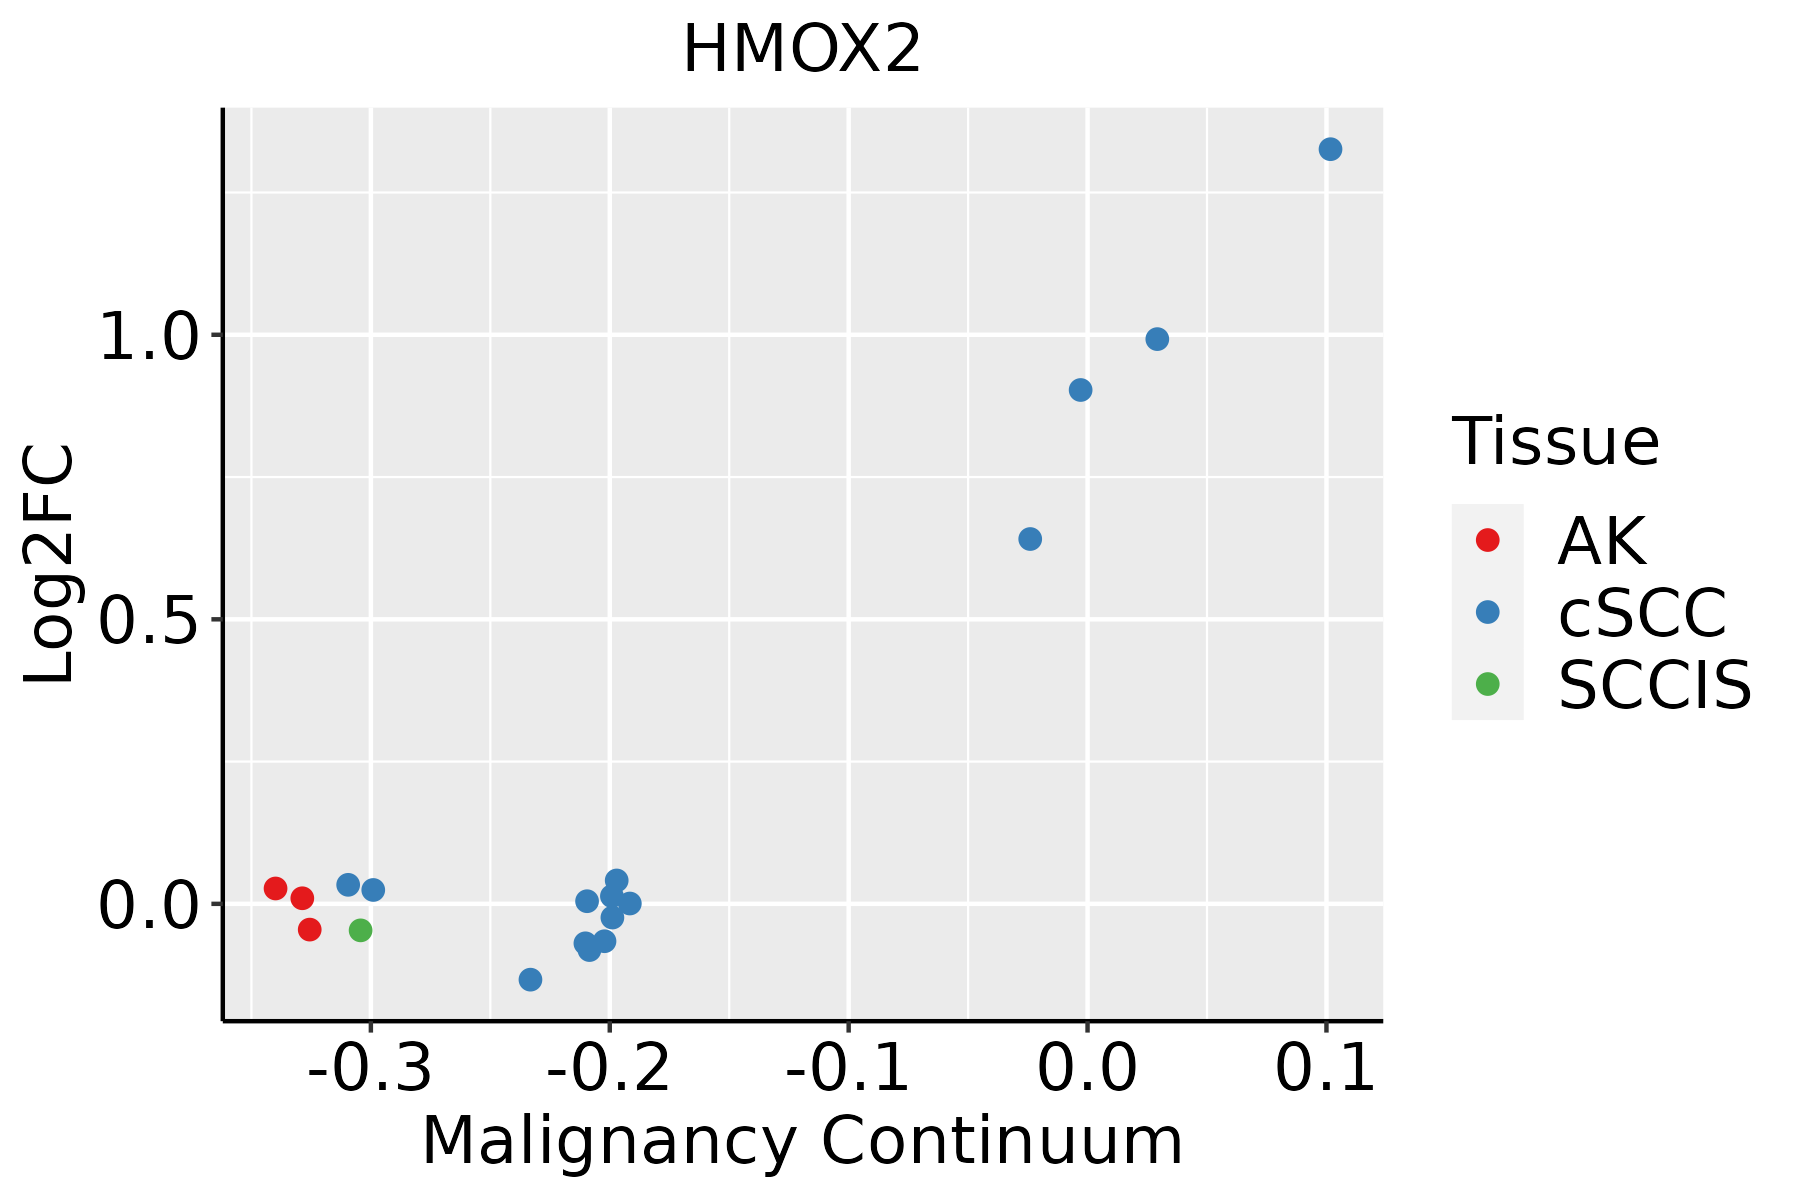 | AK: Actinic keratosis |
| cSCC: Cutaneous squamous cell carcinoma | ||
| SCCIS:squamous cell carcinoma in situ | ||
| Thyroid | 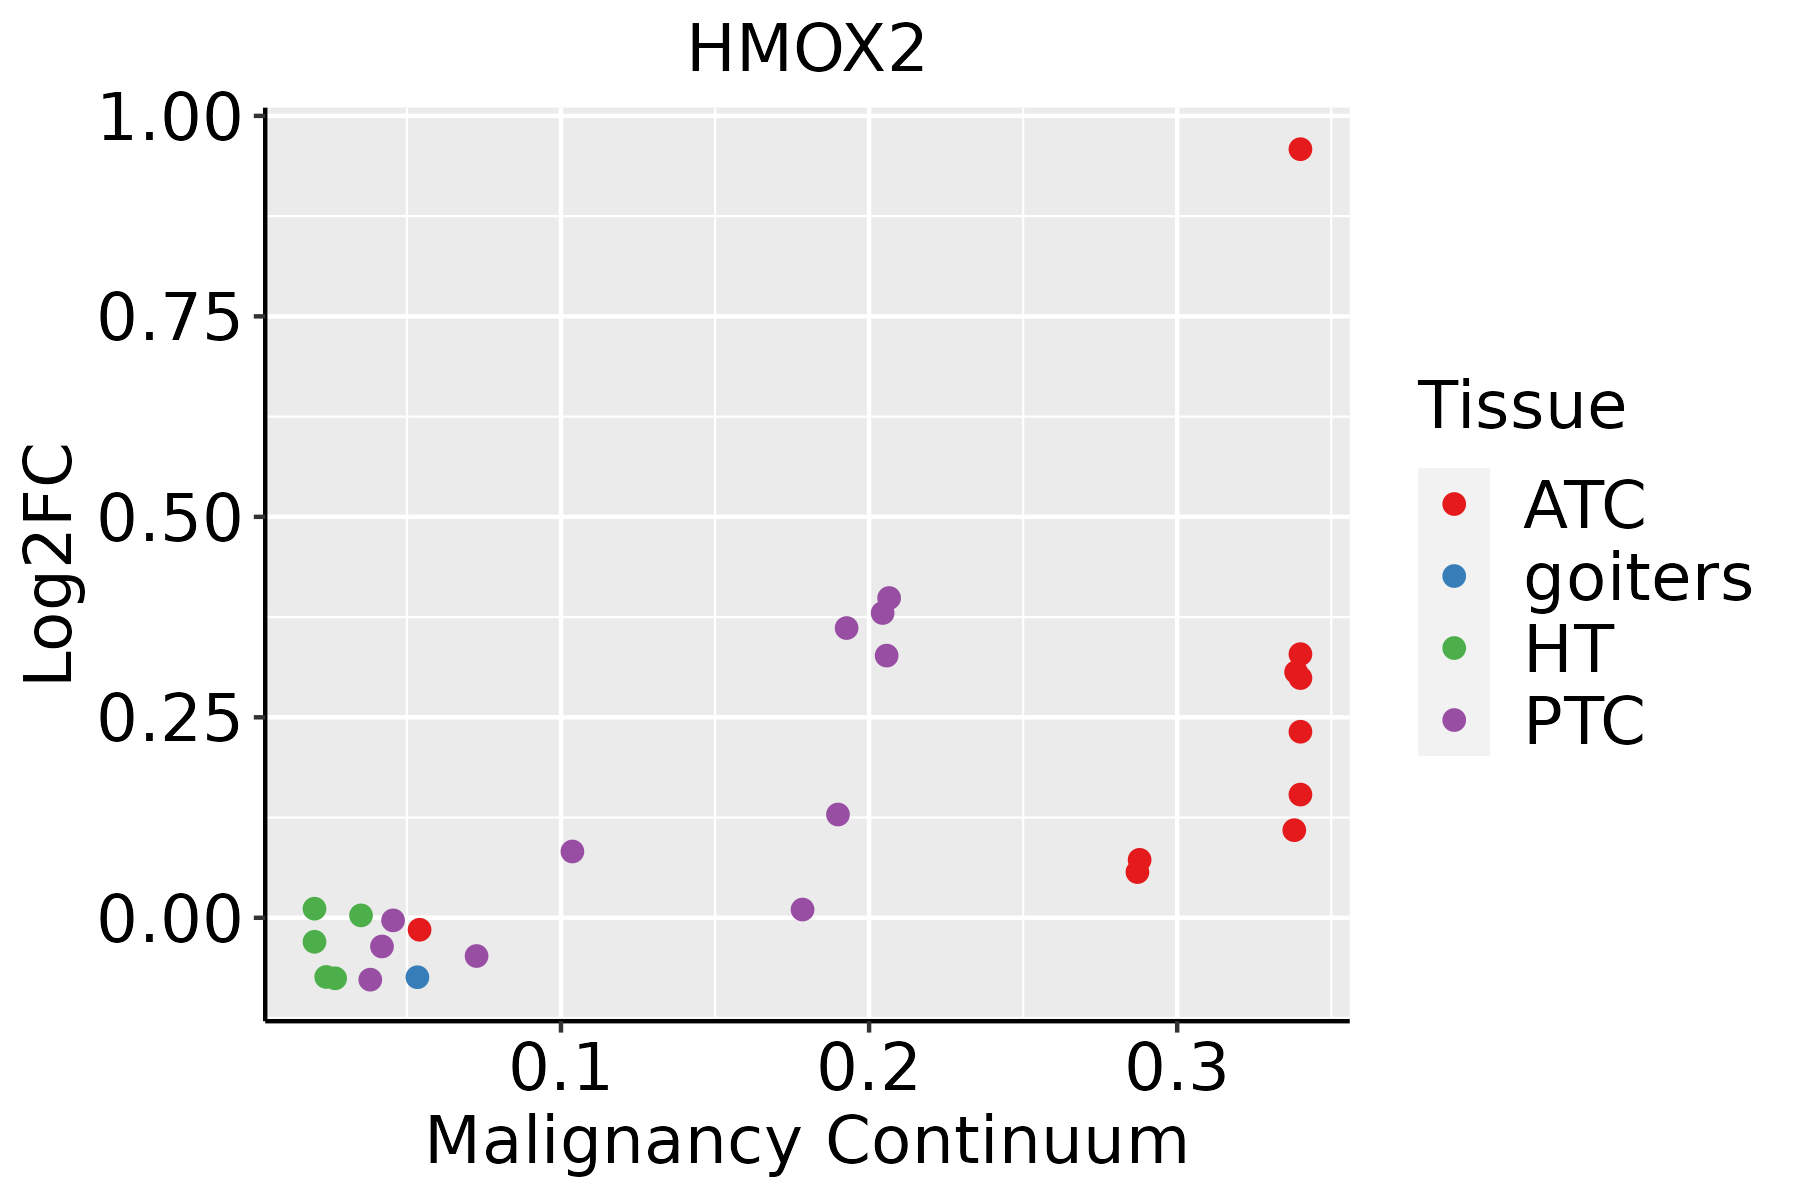 | ATC: Anaplastic thyroid cancer |
| HT: Hashimoto's thyroiditis | ||
| PTC: Papillary thyroid cancer |
| ∗log2FC in expression of this searched gene in stem-like cells from each diseased tissue sample relative to stem-like cells in normal samples in each tissue plotted against the malignancy continuum. Samples are colored based on if they are from different disease stage. |
Top |
Malignant transformation related pathway analysis |
| Find out the enriched GO biological processes and KEGG pathways involved in transition from healthy to precancer to cancer |
| Tissue | Disease Stage | Enriched GO biological Processes |
| Colorectum | AD |  |
| Colorectum | SER |  |
| Colorectum | MSS |  |
| Colorectum | MSI-H |  |
| Colorectum | FAP |  |
| ∗Top 15 enriched GO BP terms are showed in the bar plot of each disease state in each tissue. Each row represents a significant GO biological process which is colored according to the -log10(p.adjust). |
| Page: 1 2 3 4 5 6 7 8 9 |
| GO ID | Tissue | Disease Stage | Description | Gene Ratio | Bg Ratio | pvalue | p.adjust | Count |
| GO:0006979111 | Esophagus | ESCC | response to oxidative stress | 303/8552 | 446/18723 | 7.15e-22 | 1.30e-19 | 303 |
| GO:004670018 | Esophagus | ESCC | heterocycle catabolic process | 286/8552 | 445/18723 | 1.12e-15 | 7.47e-14 | 286 |
| GO:004427019 | Esophagus | ESCC | cellular nitrogen compound catabolic process | 288/8552 | 451/18723 | 3.03e-15 | 1.79e-13 | 288 |
| GO:001943918 | Esophagus | ESCC | aromatic compound catabolic process | 295/8552 | 467/18723 | 1.09e-14 | 5.98e-13 | 295 |
| GO:190136118 | Esophagus | ESCC | organic cyclic compound catabolic process | 307/8552 | 495/18723 | 9.99e-14 | 4.80e-12 | 307 |
| GO:0070482111 | Esophagus | ESCC | response to oxygen levels | 218/8552 | 347/18723 | 6.91e-11 | 2.17e-09 | 218 |
| GO:0036293111 | Esophagus | ESCC | response to decreased oxygen levels | 201/8552 | 322/18723 | 8.37e-10 | 2.04e-08 | 201 |
| GO:0001666111 | Esophagus | ESCC | response to hypoxia | 192/8552 | 307/18723 | 1.59e-09 | 3.69e-08 | 192 |
| GO:005507617 | Esophagus | ESCC | transition metal ion homeostasis | 87/8552 | 138/18723 | 2.85e-05 | 2.37e-04 | 87 |
| GO:00550729 | Esophagus | ESCC | iron ion homeostasis | 52/8552 | 85/18723 | 2.86e-03 | 1.21e-02 | 52 |
| GO:00330132 | Esophagus | ESCC | tetrapyrrole metabolic process | 37/8552 | 59/18723 | 6.23e-03 | 2.29e-02 | 37 |
| GO:00424401 | Esophagus | ESCC | pigment metabolic process | 50/8552 | 84/18723 | 7.34e-03 | 2.64e-02 | 50 |
| GO:00421681 | Esophagus | ESCC | heme metabolic process | 27/8552 | 42/18723 | 1.16e-02 | 3.90e-02 | 27 |
| GO:190136111 | Liver | Cirrhotic | organic cyclic compound catabolic process | 213/4634 | 495/18723 | 1.58e-19 | 3.67e-17 | 213 |
| GO:000697912 | Liver | Cirrhotic | response to oxidative stress | 196/4634 | 446/18723 | 2.80e-19 | 5.86e-17 | 196 |
| GO:001943911 | Liver | Cirrhotic | aromatic compound catabolic process | 202/4634 | 467/18723 | 6.93e-19 | 1.28e-16 | 202 |
| GO:004427011 | Liver | Cirrhotic | cellular nitrogen compound catabolic process | 195/4634 | 451/18723 | 2.99e-18 | 4.94e-16 | 195 |
| GO:004670011 | Liver | Cirrhotic | heterocycle catabolic process | 192/4634 | 445/18723 | 7.17e-18 | 1.12e-15 | 192 |
| GO:00704827 | Liver | Cirrhotic | response to oxygen levels | 125/4634 | 347/18723 | 1.55e-06 | 3.02e-05 | 125 |
| GO:00550766 | Liver | Cirrhotic | transition metal ion homeostasis | 59/4634 | 138/18723 | 2.59e-06 | 4.65e-05 | 59 |
| Page: 1 2 3 4 5 |
| Pathway ID | Tissue | Disease Stage | Description | Gene Ratio | Bg Ratio | pvalue | p.adjust | qvalue | Count |
| Page: 1 |
Top |
Cell-cell communication analysis |
| Identification of potential cell-cell interactions between two cell types and their ligand-receptor pairs for different disease states |
| Ligand | Receptor | LRpair | Pathway | Tissue | Disease Stage |
| Page: 1 |
Top |
Single-cell gene regulatory network inference analysis |
| Find out the significant the regulons (TFs) and the target genes of each regulon across cell types for different disease states |
| TF | Cell Type | Tissue | Disease Stage | Target Gene | RSS | Regulon Activity |
| ∗The dot plots of a searched regulon are shown for all cell subpopulations in each disease state of each tissue based on the regulon specific score inferred using pySCENIC and by calculating the average expression. |
| Page: 1 |
Top |
Somatic mutation of malignant transformation related genes |
| Annotation of somatic variants for genes involved in malignant transformation |
| Hugo Symbol | Variant Class | Variant Classification | dbSNP RS | HGVSc | HGVSp | HGVSp Short | SWISSPROT | BIOTYPE | SIFT | PolyPhen | Tumor Sample Barcode | Tissue | Histology | Sex | Age | Stage | Therapy Types | Drugs | Outcome |
| HMOX2 | SNV | Missense_Mutation | c.673N>A | p.Ala225Thr | p.A225T | protein_coding | tolerated(0.09) | possibly_damaging(0.553) | TCGA-AQ-A0Y5-01 | Breast | breast invasive carcinoma | Female | >=65 | III/IV | Chemotherapy | cytoxan | SD | ||
| HMOX2 | SNV | Missense_Mutation | rs762804813 | c.769N>T | p.Arg257Trp | p.R257W | protein_coding | deleterious(0) | probably_damaging(0.99) | TCGA-E9-A229-01 | Breast | breast invasive carcinoma | Female | <65 | I/II | Chemotherapy | 5-fluorouracil | SD | |
| HMOX2 | insertion | Frame_Shift_Ins | novel | c.719_720insTGTCAAGGACTTCTTGAAAGGCAACATTAAGAAGGAG | p.Tyr241ValfsTer16 | p.Y241Vfs*16 | protein_coding | TCGA-A8-A08X-01 | Breast | breast invasive carcinoma | Female | <65 | III/IV | Chemotherapy | doxorubicin | PD | |||
| HMOX2 | insertion | Nonsense_Mutation | novel | c.447_448insGTCTGAGAAGCCCCAGCCTCCAGTACAA | p.Pro150ValfsTer2 | p.P150Vfs*2 | protein_coding | TCGA-AO-A0JD-01 | Breast | breast invasive carcinoma | Female | <65 | III/IV | Chemotherapy | cyclophosphamide | SD | |||
| HMOX2 | deletion | Frame_Shift_Del | novel | c.871delC | p.Leu291TrpfsTer55 | p.L291Wfs*55 | protein_coding | TCGA-D8-A27V-01 | Breast | breast invasive carcinoma | Female | <65 | I/II | Hormone Therapy | tamoxiphen | SD | |||
| HMOX2 | SNV | Missense_Mutation | c.213G>T | p.Lys71Asn | p.K71N | protein_coding | tolerated(0.06) | benign(0.012) | TCGA-AA-3977-01 | Colorectum | colon adenocarcinoma | Male | >=65 | I/II | Unknown | Unknown | SD | ||
| HMOX2 | SNV | Missense_Mutation | rs151216051 | c.476G>A | p.Arg159Gln | p.R159Q | protein_coding | deleterious(0.01) | probably_damaging(0.999) | TCGA-CM-4744-01 | Colorectum | colon adenocarcinoma | Male | >=65 | I/II | Unknown | Unknown | SD | |
| HMOX2 | SNV | Missense_Mutation | c.218N>T | p.Ser73Phe | p.S73F | protein_coding | tolerated_low_confidence(0.11) | benign(0.02) | TCGA-AG-A002-01 | Colorectum | rectum adenocarcinoma | Male | <65 | I/II | Unknown | Unknown | SD | ||
| HMOX2 | SNV | Missense_Mutation | novel | c.510N>A | p.Phe170Leu | p.F170L | protein_coding | deleterious(0.05) | benign(0.098) | TCGA-AG-A002-01 | Colorectum | rectum adenocarcinoma | Male | <65 | I/II | Unknown | Unknown | SD | |
| HMOX2 | SNV | Missense_Mutation | novel | c.1075G>A | p.Ala359Thr | p.A359T | protein_coding | tolerated_low_confidence(0.13) | probably_damaging(0.944) | TCGA-AG-A00Y-01 | Colorectum | rectum adenocarcinoma | Male | >=65 | I/II | Unknown | Unknown | PD |
| Page: 1 2 3 |
Top |
Related drugs of malignant transformation related genes |
| Identification of chemicals and drugs interact with genes involved in malignant transfromation |
| (DGIdb 4.0) |
| Entrez ID | Symbol | Category | Interaction Types | Drug Claim Name | Drug Name | PMIDs |
| 3163 | HMOX2 | ENZYME | STANNSOPORFIN | STANNSOPORFIN | ||
| 3163 | HMOX2 | ENZYME | MORPHINE | MORPHINE | 14580950,10686338 | |
| 3163 | HMOX2 | ENZYME | HORMONES | 14985830 | ||
| 3163 | HMOX2 | ENZYME | BETAMETHASONE | BETAMETHASONE | 11698254 | |
| 3163 | HMOX2 | ENZYME | ANTIOXIDANT | 11449996 |
| Page: 1 |

Copyright 2023-Present -The University of Texas Health Science Center at Houston |