
|
|||||
|
 | |
| |
| |
| |
| |
| |
|
Gene: HMMR |
Gene summary for HMMR |
| Gene information | Species | Human | Gene symbol | HMMR | Gene ID | 3161 |
| Gene name | hyaluronan mediated motility receptor | |
| Gene Alias | CD168 | |
| Cytomap | 5q34 | |
| Gene Type | protein-coding | GO ID | GO:0005575 | UniProtAcc | O75330 |
Top |
Malignant transformation analysis |
| Identification of the aberrant gene expression in precancerous and cancerous lesions by comparing the gene expression of stem-like cells in diseased tissues with normal stem cells |
| Entrez ID | Symbol | Replicates | Species | Organ | Tissue | Adj P-value | Log2FC | Malignancy |
| 3161 | HMMR | LZE2T | Human | Esophagus | ESCC | 3.94e-07 | 6.95e-01 | 0.082 |
| 3161 | HMMR | P2T-E | Human | Esophagus | ESCC | 4.31e-06 | 3.43e-01 | 0.1177 |
| 3161 | HMMR | P4T-E | Human | Esophagus | ESCC | 6.14e-11 | 4.43e-01 | 0.1323 |
| 3161 | HMMR | P5T-E | Human | Esophagus | ESCC | 5.79e-16 | 5.52e-01 | 0.1327 |
| 3161 | HMMR | P10T-E | Human | Esophagus | ESCC | 8.40e-04 | 1.75e-01 | 0.116 |
| 3161 | HMMR | P17T-E | Human | Esophagus | ESCC | 8.50e-05 | 4.29e-01 | 0.1278 |
| 3161 | HMMR | P19T-E | Human | Esophagus | ESCC | 6.53e-04 | 5.18e-01 | 0.1662 |
| 3161 | HMMR | P21T-E | Human | Esophagus | ESCC | 4.12e-11 | 4.33e-01 | 0.1617 |
| 3161 | HMMR | P22T-E | Human | Esophagus | ESCC | 8.84e-05 | 3.43e-01 | 0.1236 |
| 3161 | HMMR | P24T-E | Human | Esophagus | ESCC | 9.02e-11 | 4.22e-01 | 0.1287 |
| 3161 | HMMR | P28T-E | Human | Esophagus | ESCC | 2.02e-06 | 2.05e-01 | 0.1149 |
| 3161 | HMMR | P31T-E | Human | Esophagus | ESCC | 1.88e-04 | 2.18e-01 | 0.1251 |
| 3161 | HMMR | P32T-E | Human | Esophagus | ESCC | 1.35e-23 | 1.11e+00 | 0.1666 |
| 3161 | HMMR | P36T-E | Human | Esophagus | ESCC | 1.55e-04 | 3.72e-01 | 0.1187 |
| 3161 | HMMR | P37T-E | Human | Esophagus | ESCC | 3.34e-07 | 2.89e-01 | 0.1371 |
| 3161 | HMMR | P38T-E | Human | Esophagus | ESCC | 3.67e-05 | 3.85e-01 | 0.127 |
| 3161 | HMMR | P44T-E | Human | Esophagus | ESCC | 6.29e-05 | 3.04e-01 | 0.1096 |
| 3161 | HMMR | P52T-E | Human | Esophagus | ESCC | 9.20e-06 | 2.23e-01 | 0.1555 |
| 3161 | HMMR | P56T-E | Human | Esophagus | ESCC | 1.75e-02 | 8.30e-01 | 0.1613 |
| 3161 | HMMR | P62T-E | Human | Esophagus | ESCC | 2.60e-03 | 1.91e-01 | 0.1302 |
| Page: 1 2 3 |
| Tissue | Expression Dynamics | Abbreviation |
| Esophagus | 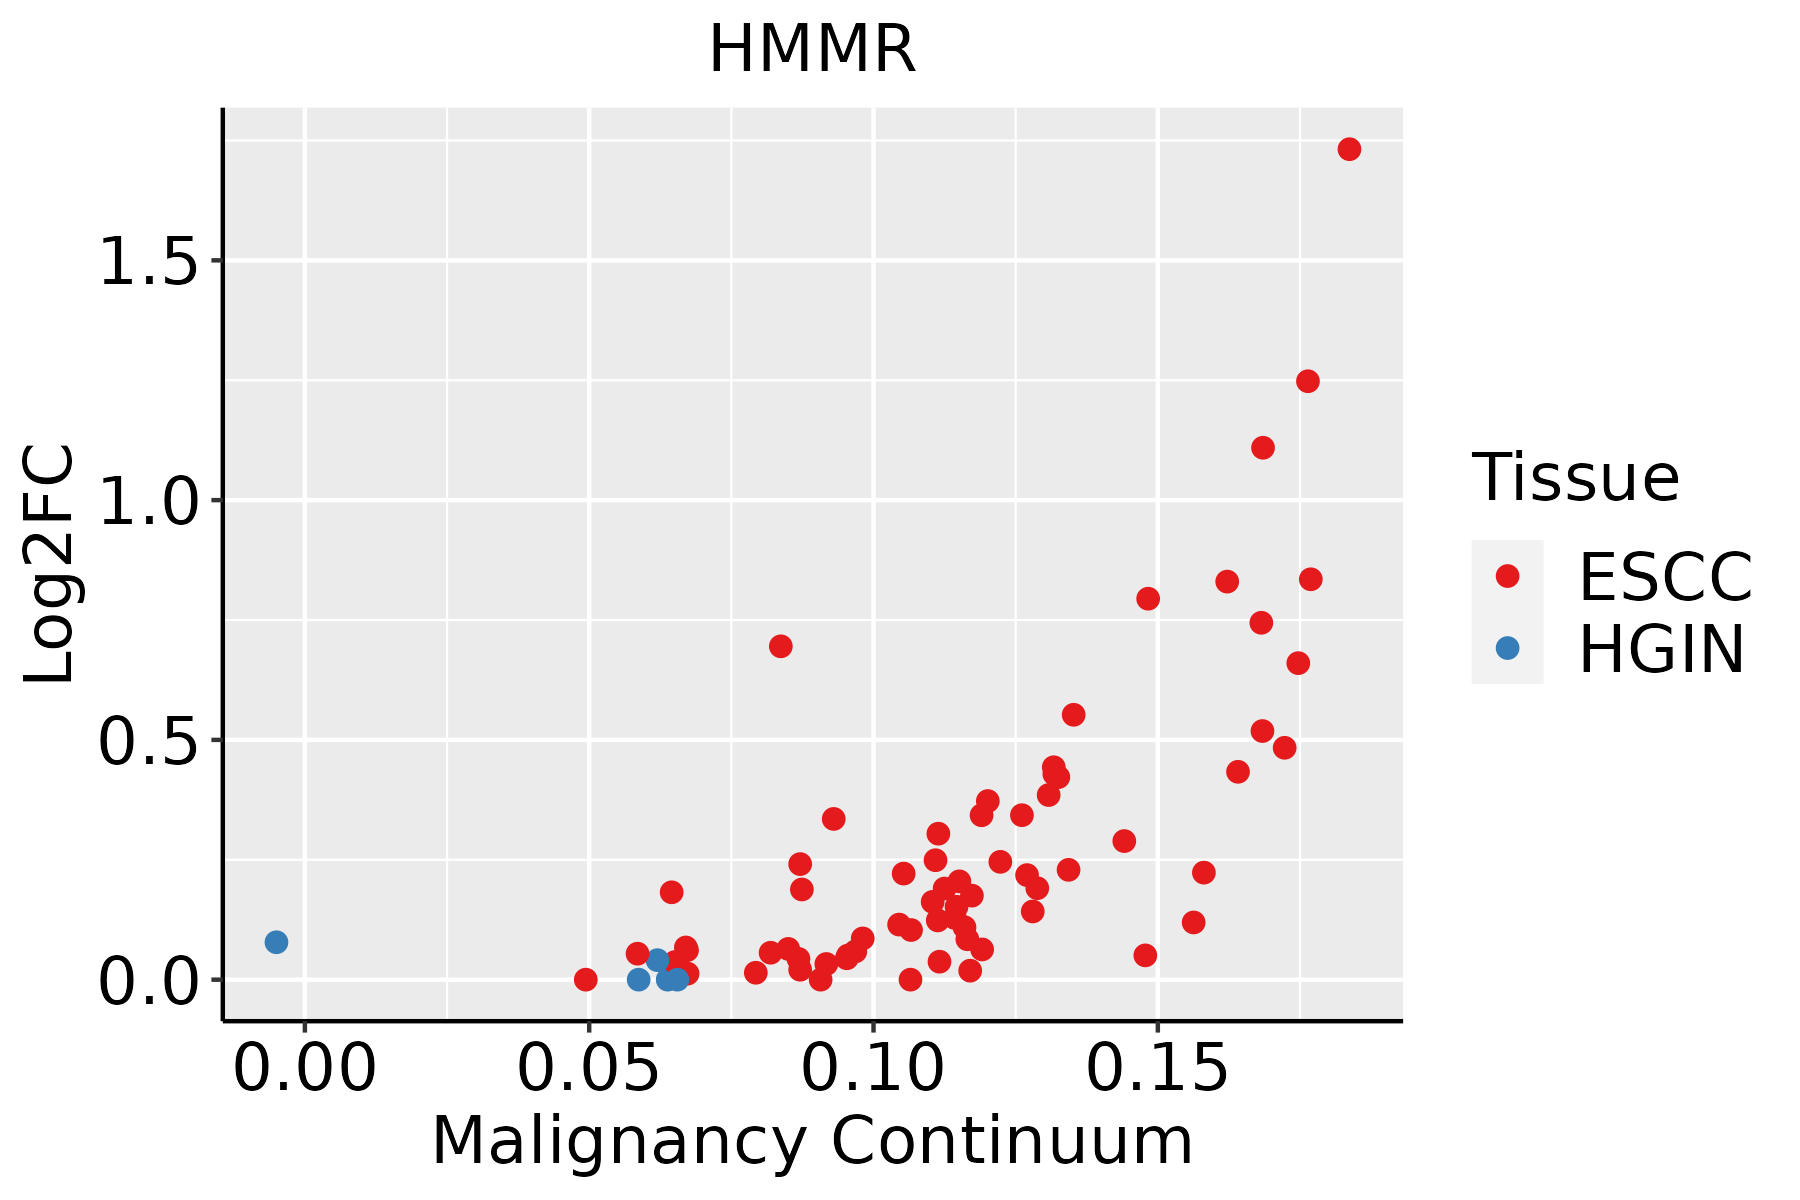 | ESCC: Esophageal squamous cell carcinoma |
| HGIN: High-grade intraepithelial neoplasias | ||
| LGIN: Low-grade intraepithelial neoplasias | ||
| Oral Cavity | 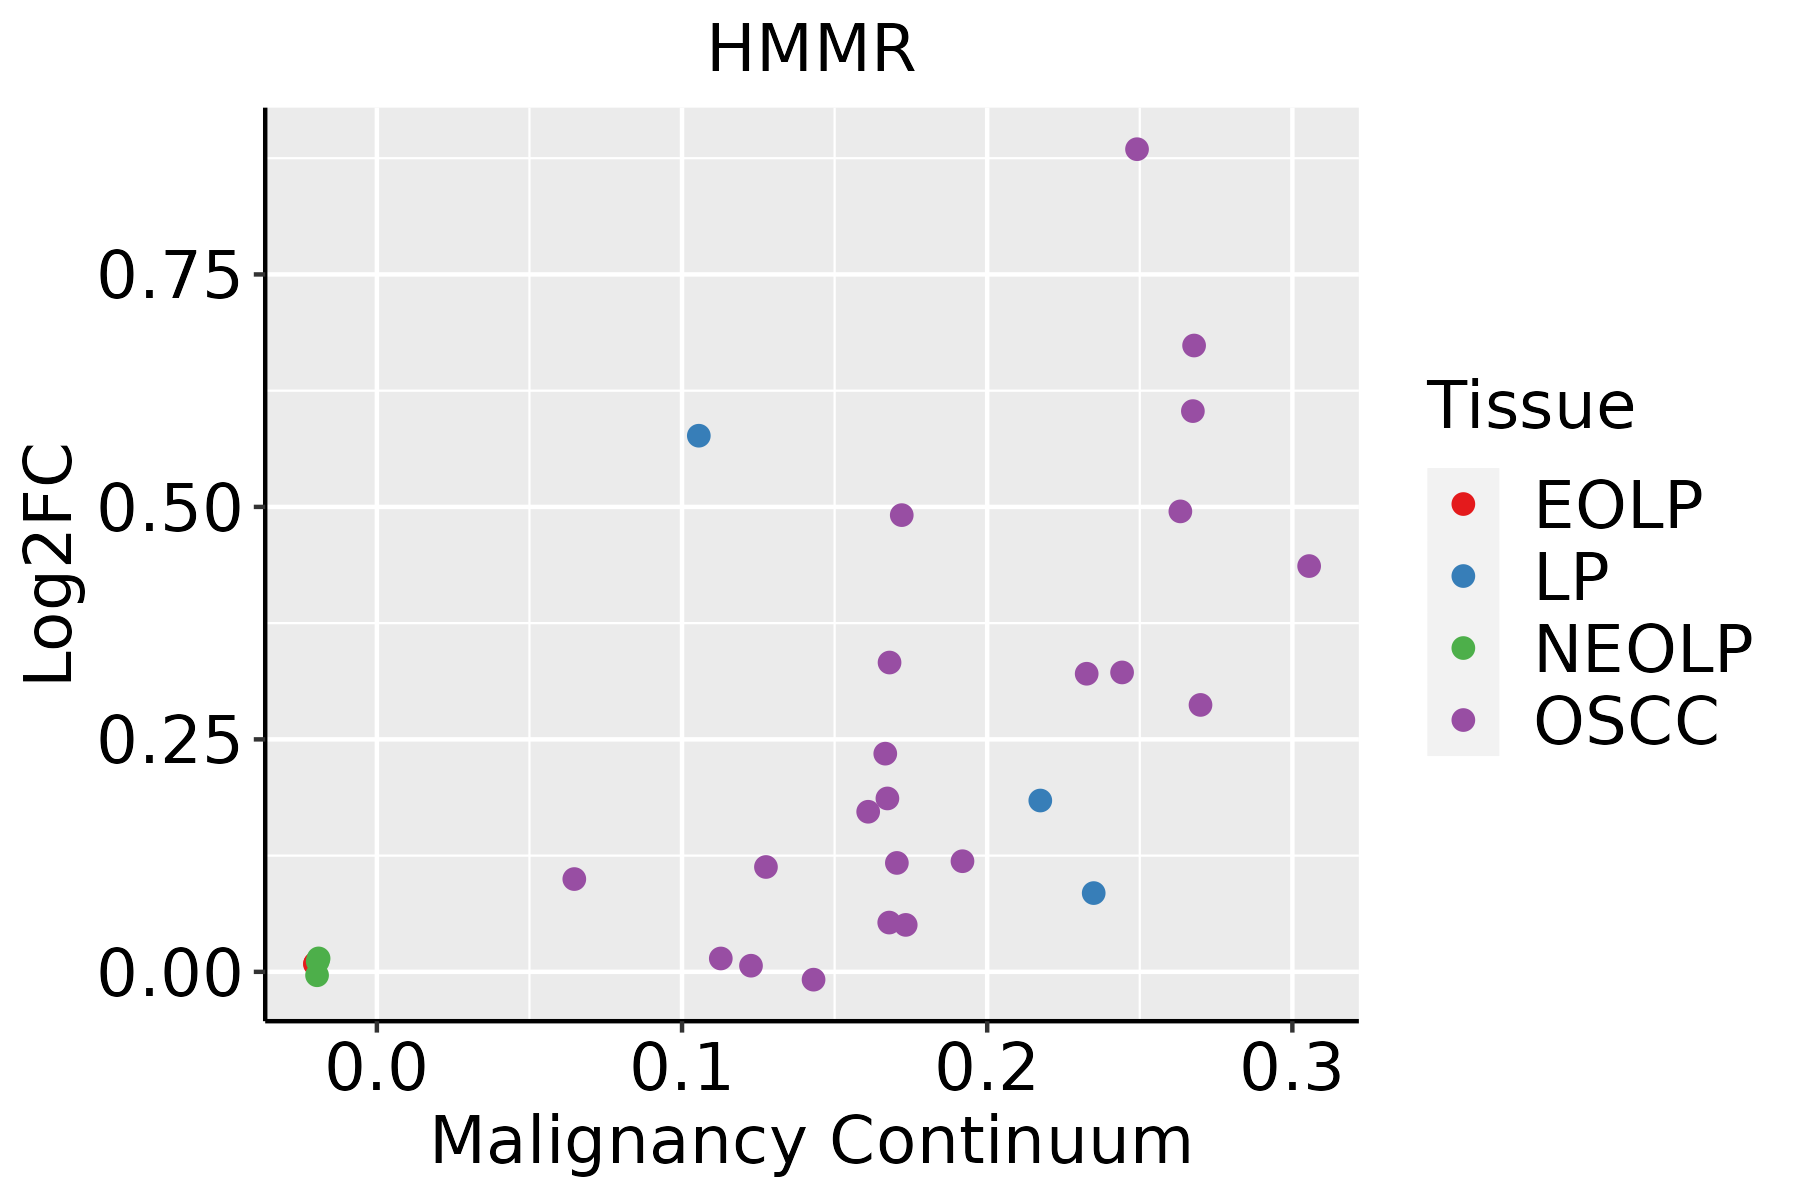 | EOLP: Erosive Oral lichen planus |
| LP: leukoplakia | ||
| NEOLP: Non-erosive oral lichen planus | ||
| OSCC: Oral squamous cell carcinoma | ||
| Skin | 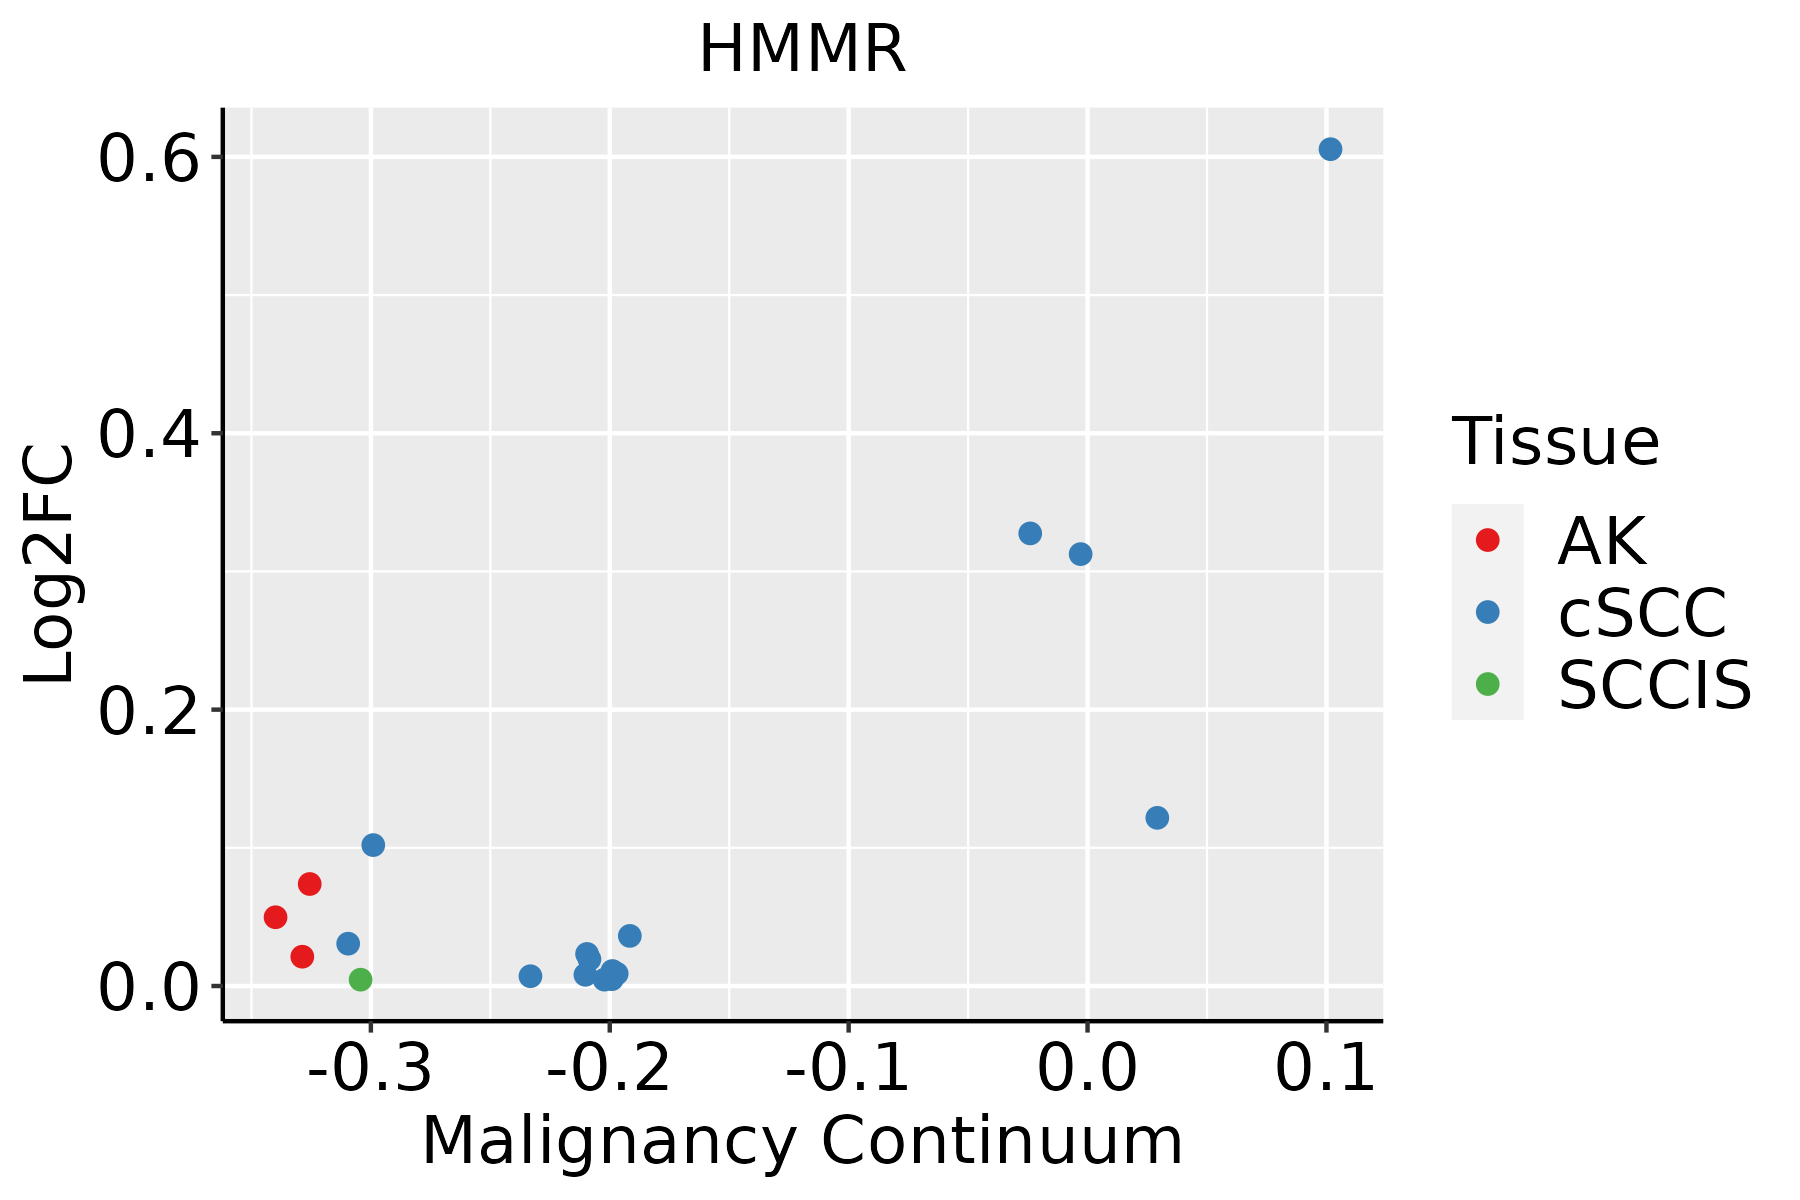 | AK: Actinic keratosis |
| cSCC: Cutaneous squamous cell carcinoma | ||
| SCCIS:squamous cell carcinoma in situ | ||
| Thyroid | 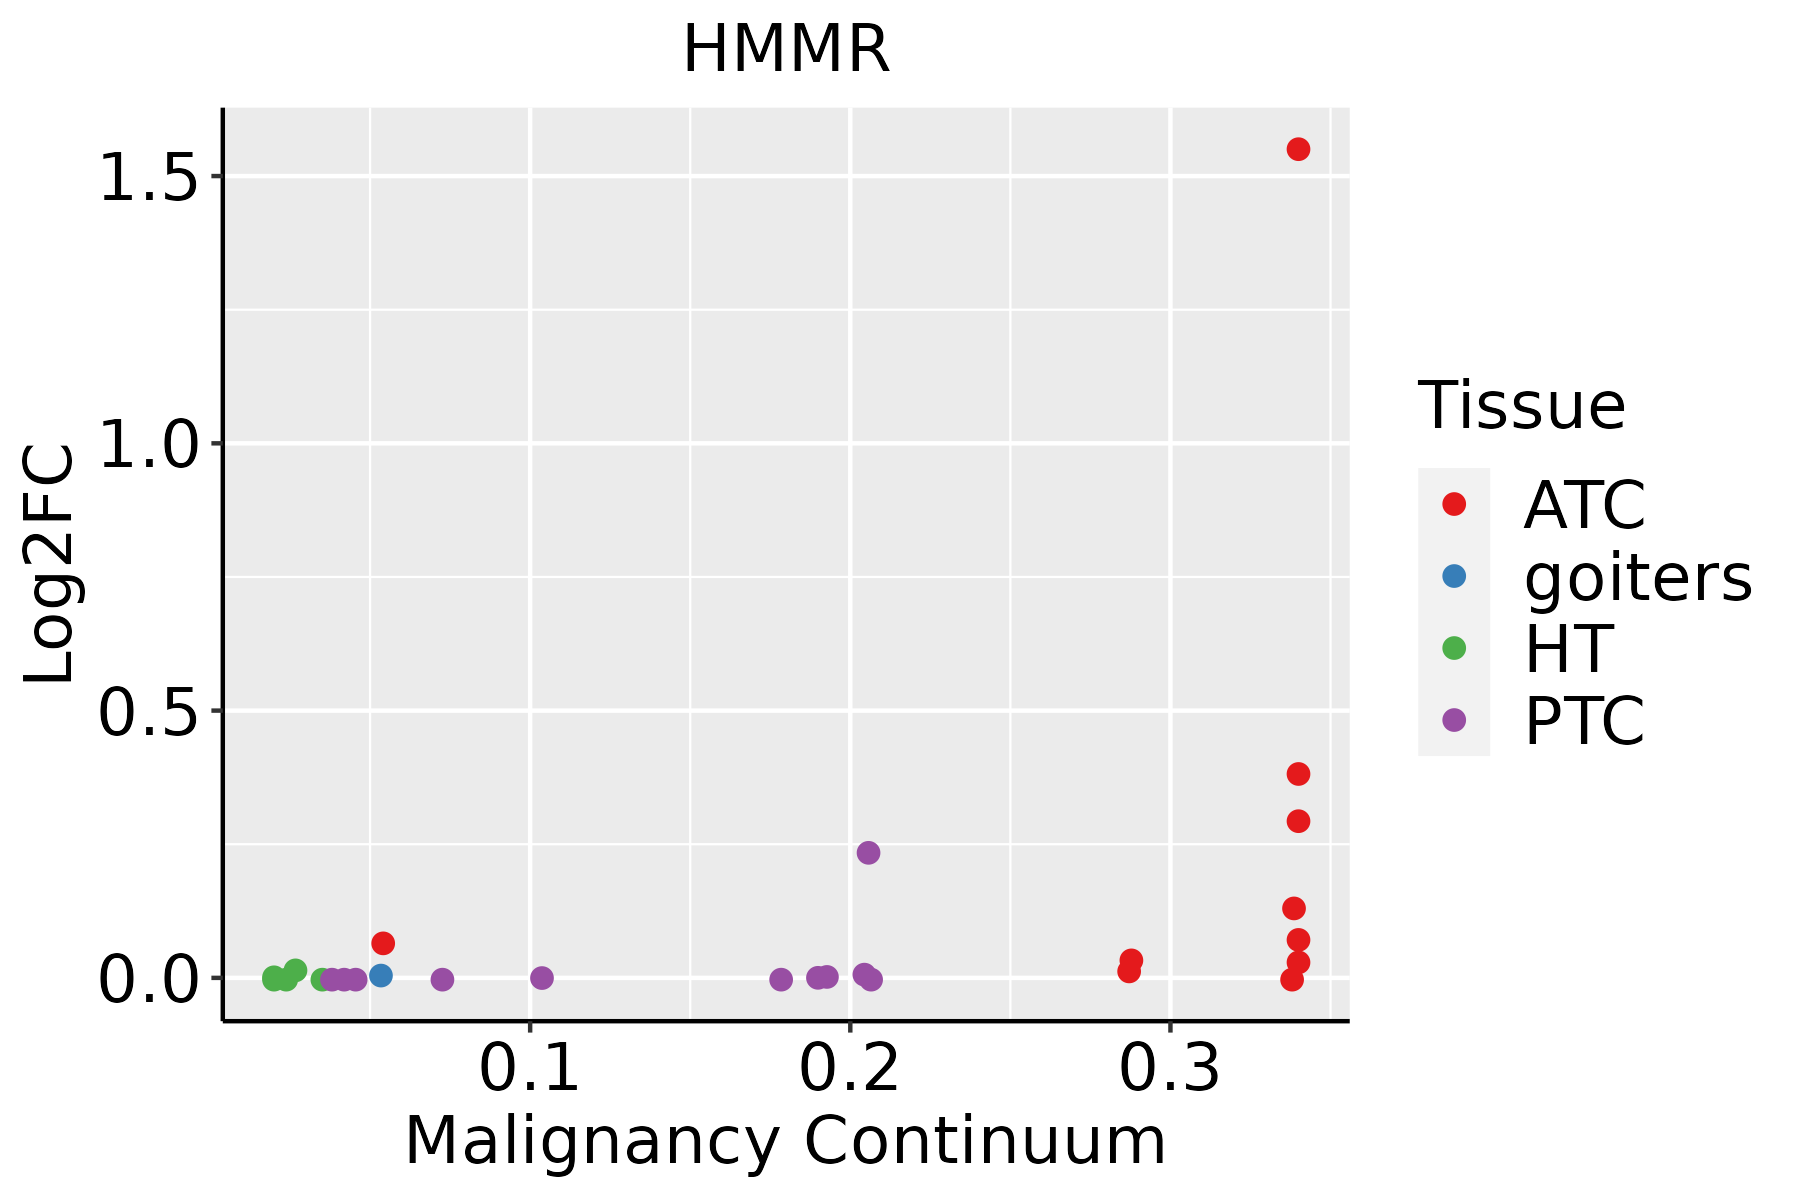 | ATC: Anaplastic thyroid cancer |
| HT: Hashimoto's thyroiditis | ||
| PTC: Papillary thyroid cancer |
| ∗log2FC in expression of this searched gene in stem-like cells from each diseased tissue sample relative to stem-like cells in normal samples in each tissue plotted against the malignancy continuum. Samples are colored based on if they are from different disease stage. |
Top |
Malignant transformation related pathway analysis |
| Find out the enriched GO biological processes and KEGG pathways involved in transition from healthy to precancer to cancer |
| Tissue | Disease Stage | Enriched GO biological Processes |
| Colorectum | AD |  |
| Colorectum | SER |  |
| Colorectum | MSS |  |
| Colorectum | MSI-H |  |
| Colorectum | FAP |  |
| ∗Top 15 enriched GO BP terms are showed in the bar plot of each disease state in each tissue. Each row represents a significant GO biological process which is colored according to the -log10(p.adjust). |
| Page: 1 2 3 4 5 6 7 8 9 |
| GO ID | Tissue | Disease Stage | Description | Gene Ratio | Bg Ratio | pvalue | p.adjust | Count |
| Page: 1 |
| Pathway ID | Tissue | Disease Stage | Description | Gene Ratio | Bg Ratio | pvalue | p.adjust | qvalue | Count |
| Page: 1 |
Top |
Cell-cell communication analysis |
| Identification of potential cell-cell interactions between two cell types and their ligand-receptor pairs for different disease states |
| Ligand | Receptor | LRpair | Pathway | Tissue | Disease Stage |
| Page: 1 |
Top |
Single-cell gene regulatory network inference analysis |
| Find out the significant the regulons (TFs) and the target genes of each regulon across cell types for different disease states |
| TF | Cell Type | Tissue | Disease Stage | Target Gene | RSS | Regulon Activity |
| ∗The dot plots of a searched regulon are shown for all cell subpopulations in each disease state of each tissue based on the regulon specific score inferred using pySCENIC and by calculating the average expression. |
| Page: 1 |
Top |
Somatic mutation of malignant transformation related genes |
| Annotation of somatic variants for genes involved in malignant transformation |
| Hugo Symbol | Variant Class | Variant Classification | dbSNP RS | HGVSc | HGVSp | HGVSp Short | SWISSPROT | BIOTYPE | SIFT | PolyPhen | Tumor Sample Barcode | Tissue | Histology | Sex | Age | Stage | Therapy Types | Drugs | Outcome |
| HMMR | SNV | Missense_Mutation | c.1551N>C | p.Gln517His | p.Q517H | O75330 | protein_coding | deleterious(0) | probably_damaging(0.952) | TCGA-AC-A23H-01 | Breast | breast invasive carcinoma | Female | >=65 | I/II | Unknown | Unknown | PD | |
| HMMR | deletion | Frame_Shift_Del | rs761272507 | c.2001delA | p.Lys667AsnfsTer11 | p.K667Nfs*11 | O75330 | protein_coding | TCGA-D8-A1XK-01 | Breast | breast invasive carcinoma | Female | <65 | I/II | Chemotherapy | doxorubicine+cyclophosphamide | SD | ||
| HMMR | SNV | Missense_Mutation | rs764564030 | c.715N>A | p.Glu239Lys | p.E239K | O75330 | protein_coding | tolerated(0.09) | benign(0.052) | TCGA-FU-A3HZ-01 | Cervix | cervical & endocervical cancer | Female | <65 | I/II | Chemotherapy | cisplatin | CR |
| HMMR | SNV | Missense_Mutation | c.1408N>A | p.Glu470Lys | p.E470K | O75330 | protein_coding | deleterious(0.01) | possibly_damaging(0.894) | TCGA-IR-A3LH-01 | Cervix | cervical & endocervical cancer | Female | <65 | I/II | Chemotherapy | cisplatin | CR | |
| HMMR | SNV | Missense_Mutation | novel | c.1507N>A | p.Glu503Lys | p.E503K | O75330 | protein_coding | tolerated(0.16) | possibly_damaging(0.73) | TCGA-VS-A958-01 | Cervix | cervical & endocervical cancer | Female | <65 | I/II | Chemotherapy | cisplatin | CR |
| HMMR | SNV | Missense_Mutation | novel | c.1585N>C | p.Glu529Gln | p.E529Q | O75330 | protein_coding | tolerated(0.32) | possibly_damaging(0.509) | TCGA-VS-A9V3-01 | Cervix | cervical & endocervical cancer | Female | <65 | I/II | Chemotherapy | cisplatin | PD |
| HMMR | deletion | Frame_Shift_Del | rs761272507 | c.2001delA | p.Lys667AsnfsTer11 | p.K667Nfs*11 | O75330 | protein_coding | TCGA-EA-A410-01 | Cervix | cervical & endocervical cancer | Female | <65 | I/II | Unknown | Unknown | SD | ||
| HMMR | SNV | Missense_Mutation | c.712N>G | p.Ile238Val | p.I238V | O75330 | protein_coding | tolerated(0.16) | possibly_damaging(0.847) | TCGA-A6-5665-01 | Colorectum | colon adenocarcinoma | Female | >=65 | I/II | Unknown | Unknown | PD | |
| HMMR | SNV | Missense_Mutation | c.425T>A | p.Ile142Asn | p.I142N | O75330 | protein_coding | deleterious(0.01) | benign(0.397) | TCGA-A6-A56B-01 | Colorectum | colon adenocarcinoma | Male | <65 | III/IV | Chemotherapy | fluorouracil | PD | |
| HMMR | SNV | Missense_Mutation | c.233C>A | p.Ser78Tyr | p.S78Y | O75330 | protein_coding | deleterious(0.01) | benign(0.232) | TCGA-AA-3977-01 | Colorectum | colon adenocarcinoma | Male | >=65 | I/II | Unknown | Unknown | SD |
| Page: 1 2 3 4 5 6 7 8 9 10 11 12 |
Top |
Related drugs of malignant transformation related genes |
| Identification of chemicals and drugs interact with genes involved in malignant transfromation |
| (DGIdb 4.0) |
| Entrez ID | Symbol | Category | Interaction Types | Drug Claim Name | Drug Name | PMIDs |
| 3161 | HMMR | KINASE, CELL SURFACE, DRUGGABLE GENOME | epirubicin | EPIRUBICIN | ||
| 3161 | HMMR | KINASE, CELL SURFACE, DRUGGABLE GENOME | HYALURONAN | HYALURONAN | ||
| 3161 | HMMR | KINASE, CELL SURFACE, DRUGGABLE GENOME | fluorouracil | FLUOROURACIL | ||
| 3161 | HMMR | KINASE, CELL SURFACE, DRUGGABLE GENOME | cyclophosphamide | CYCLOPHOSPHAMIDE |
| Page: 1 |

Copyright 2023-Present -The University of Texas Health Science Center at Houston |