
|
|||||
|
 | |
| |
| |
| |
| |
| |
|
Gene: HMGN3 |
Gene summary for HMGN3 |
| Gene information | Species | Human | Gene symbol | HMGN3 | Gene ID | 9324 |
| Gene name | high mobility group nucleosomal binding domain 3 | |
| Gene Alias | PNAS-24 | |
| Cytomap | 6q14.1 | |
| Gene Type | protein-coding | GO ID | GO:0001678 | UniProtAcc | Q15651 |
Top |
Malignant transformation analysis |
| Identification of the aberrant gene expression in precancerous and cancerous lesions by comparing the gene expression of stem-like cells in diseased tissues with normal stem cells |
| Entrez ID | Symbol | Replicates | Species | Organ | Tissue | Adj P-value | Log2FC | Malignancy |
| 9324 | HMGN3 | GSM4909282 | Human | Breast | IDC | 4.26e-03 | 3.87e-01 | -0.0288 |
| 9324 | HMGN3 | GSM4909285 | Human | Breast | IDC | 1.01e-06 | 4.06e-01 | 0.21 |
| 9324 | HMGN3 | GSM4909286 | Human | Breast | IDC | 2.72e-05 | 1.49e-01 | 0.1081 |
| 9324 | HMGN3 | GSM4909290 | Human | Breast | IDC | 8.61e-27 | 7.15e-01 | 0.2096 |
| 9324 | HMGN3 | GSM4909293 | Human | Breast | IDC | 2.57e-03 | 3.10e-01 | 0.1581 |
| 9324 | HMGN3 | GSM4909294 | Human | Breast | IDC | 1.78e-12 | 4.19e-01 | 0.2022 |
| 9324 | HMGN3 | GSM4909296 | Human | Breast | IDC | 2.10e-15 | -3.30e-01 | 0.1524 |
| 9324 | HMGN3 | GSM4909297 | Human | Breast | IDC | 5.84e-11 | -1.48e-01 | 0.1517 |
| 9324 | HMGN3 | GSM4909304 | Human | Breast | IDC | 1.56e-02 | -2.11e-01 | 0.1636 |
| 9324 | HMGN3 | GSM4909305 | Human | Breast | IDC | 1.85e-02 | 2.60e-01 | 0.0436 |
| 9324 | HMGN3 | GSM4909306 | Human | Breast | IDC | 3.34e-03 | 3.22e-01 | 0.1564 |
| 9324 | HMGN3 | GSM4909308 | Human | Breast | IDC | 9.48e-10 | 4.09e-01 | 0.158 |
| 9324 | HMGN3 | GSM4909311 | Human | Breast | IDC | 2.59e-32 | -5.30e-01 | 0.1534 |
| 9324 | HMGN3 | GSM4909312 | Human | Breast | IDC | 5.74e-17 | -3.73e-01 | 0.1552 |
| 9324 | HMGN3 | GSM4909319 | Human | Breast | IDC | 9.04e-38 | -4.22e-01 | 0.1563 |
| 9324 | HMGN3 | GSM4909320 | Human | Breast | IDC | 1.94e-03 | -3.60e-01 | 0.1575 |
| 9324 | HMGN3 | GSM4909321 | Human | Breast | IDC | 3.50e-22 | -4.22e-01 | 0.1559 |
| 9324 | HMGN3 | ctrl6 | Human | Breast | Precancer | 2.56e-08 | -5.47e-01 | -0.0061 |
| 9324 | HMGN3 | brca1 | Human | Breast | Precancer | 5.37e-05 | -2.99e-01 | -0.0338 |
| 9324 | HMGN3 | brca3 | Human | Breast | Precancer | 1.16e-06 | -2.91e-01 | -0.0263 |
| Page: 1 2 3 4 5 6 7 8 9 10 11 |
| Tissue | Expression Dynamics | Abbreviation |
| Breast | 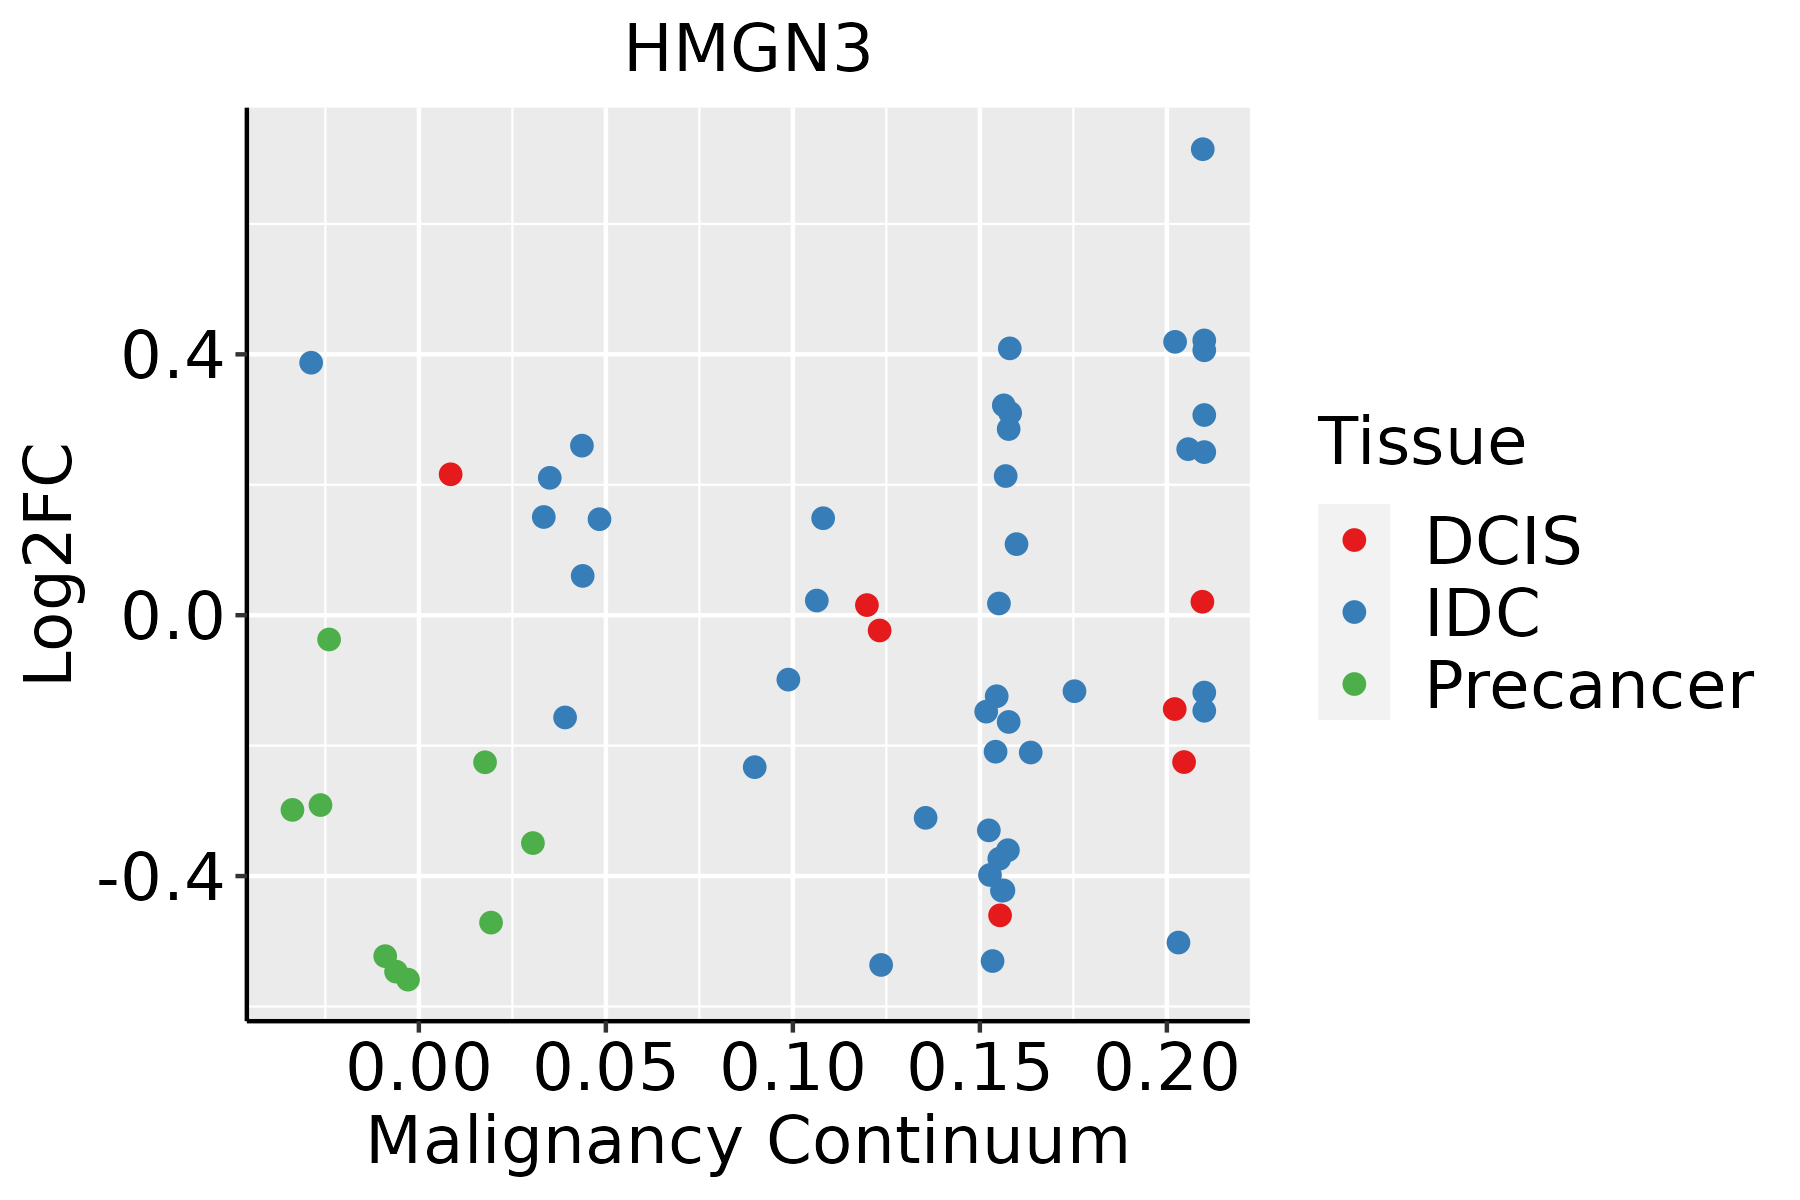 | IDC: Invasive ductal carcinoma |
| DCIS: Ductal carcinoma in situ | ||
| Precancer(BRCA1-mut): Precancerous lesion from BRCA1 mutation carriers | ||
| Cervix | 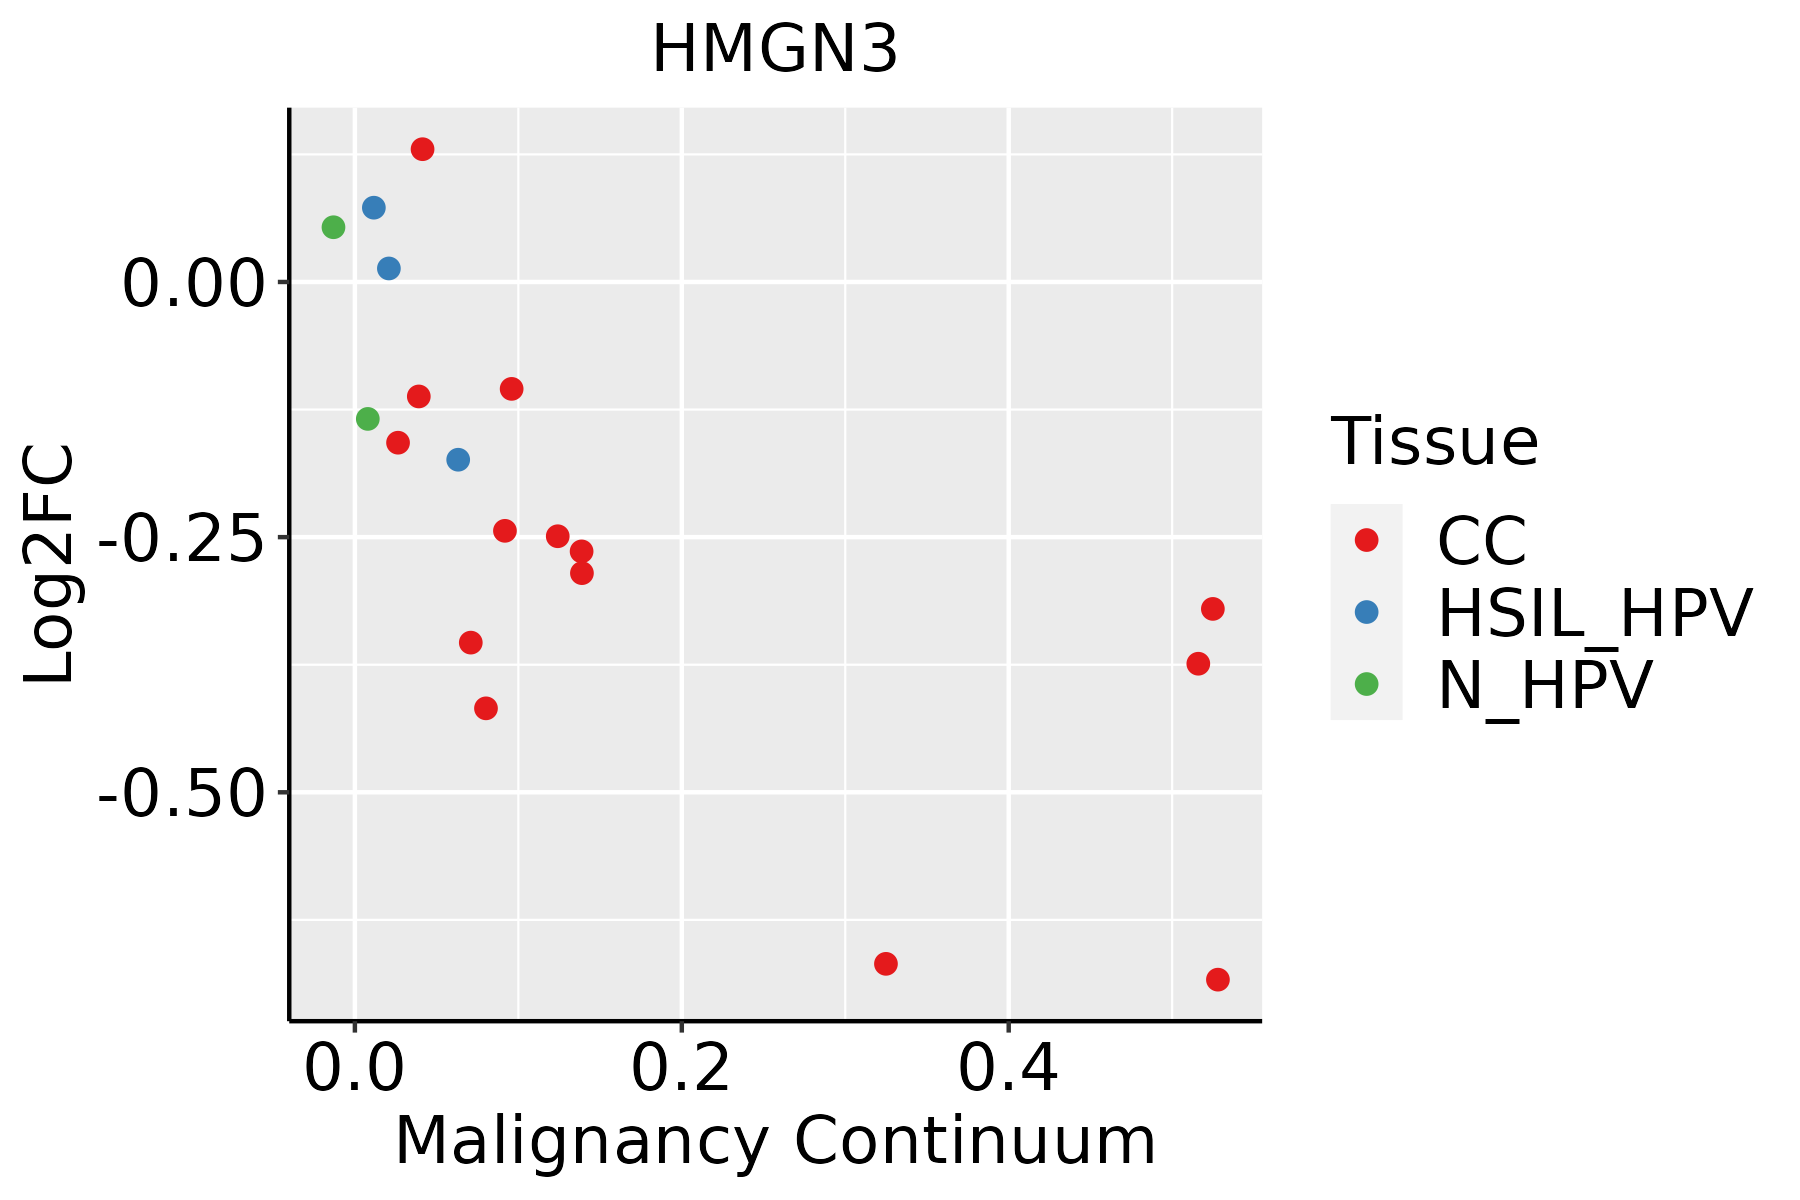 | CC: Cervix cancer |
| HSIL_HPV: HPV-infected high-grade squamous intraepithelial lesions | ||
| N_HPV: HPV-infected normal cervix | ||
| Endometrium | 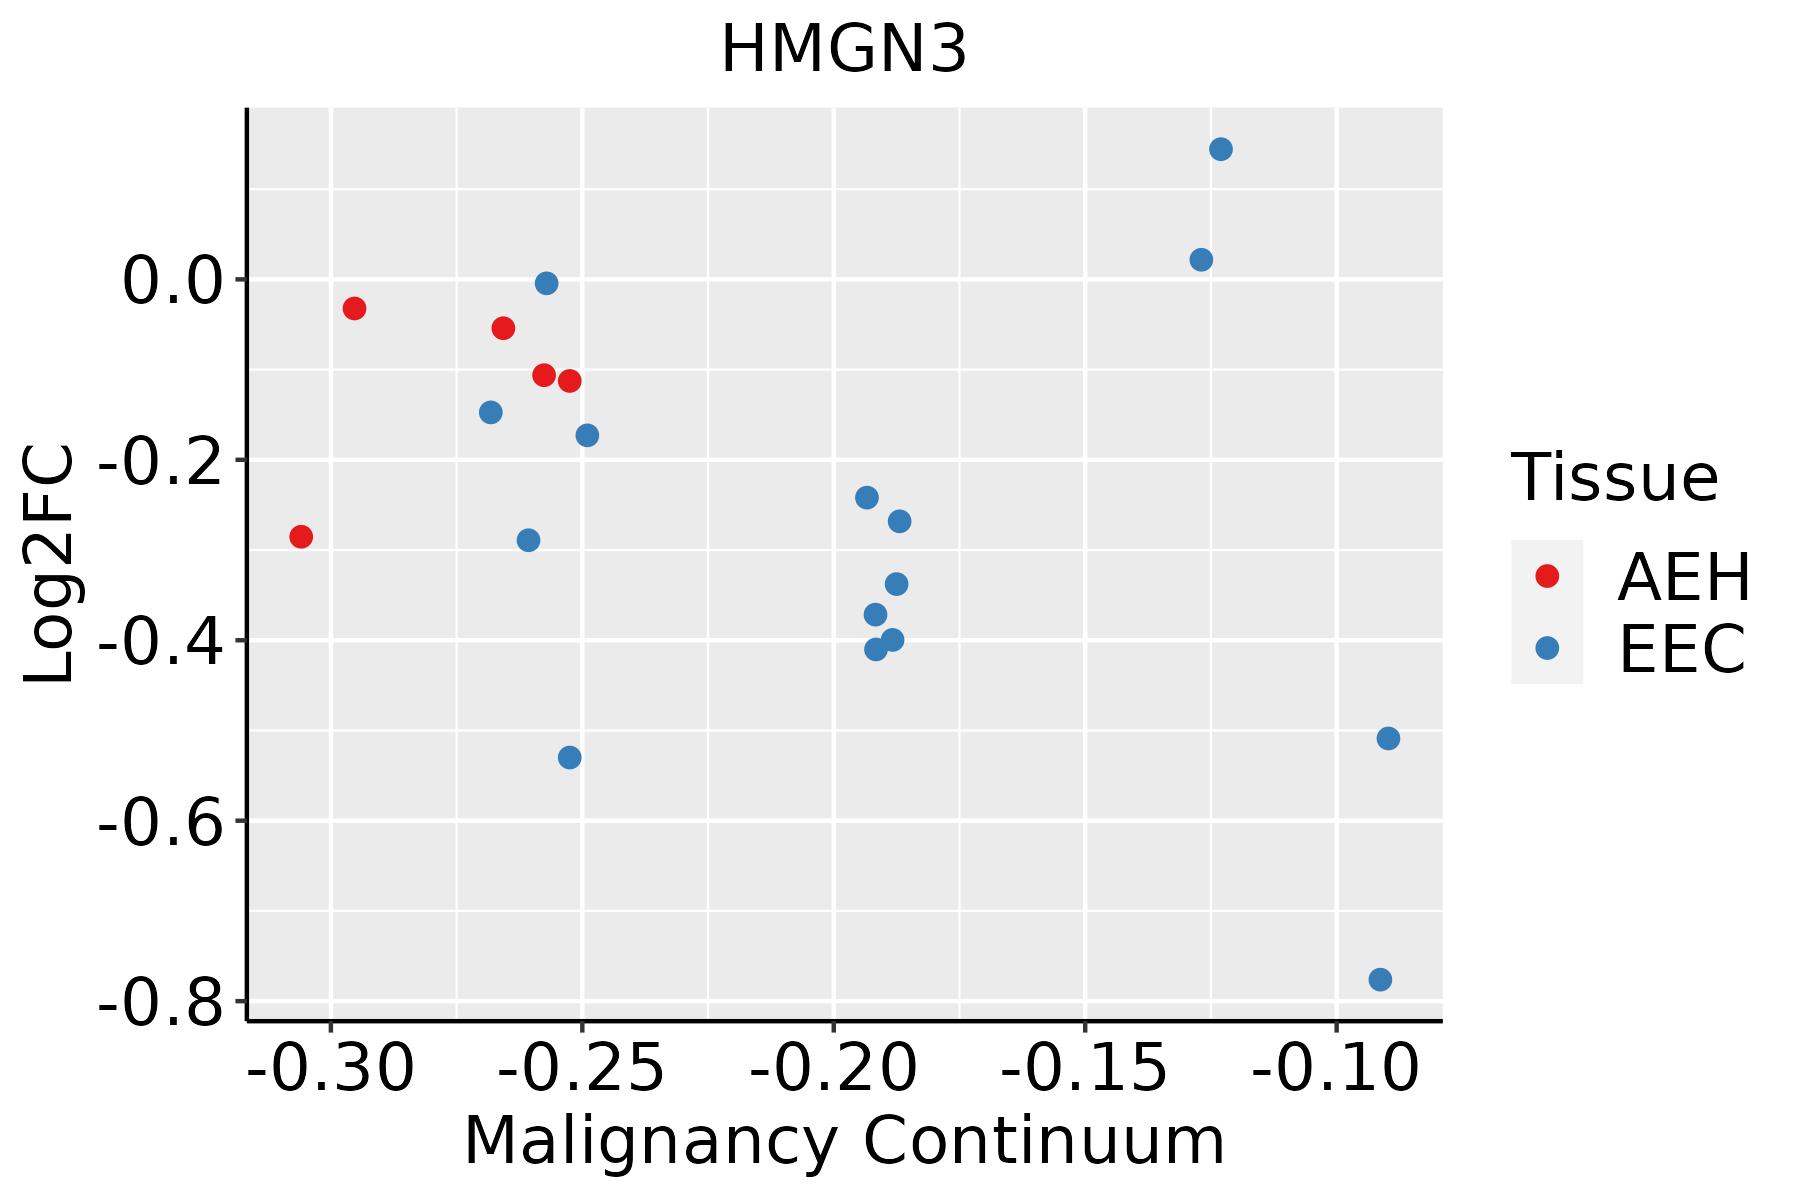 | AEH: Atypical endometrial hyperplasia |
| EEC: Endometrioid Cancer | ||
| Esophagus | 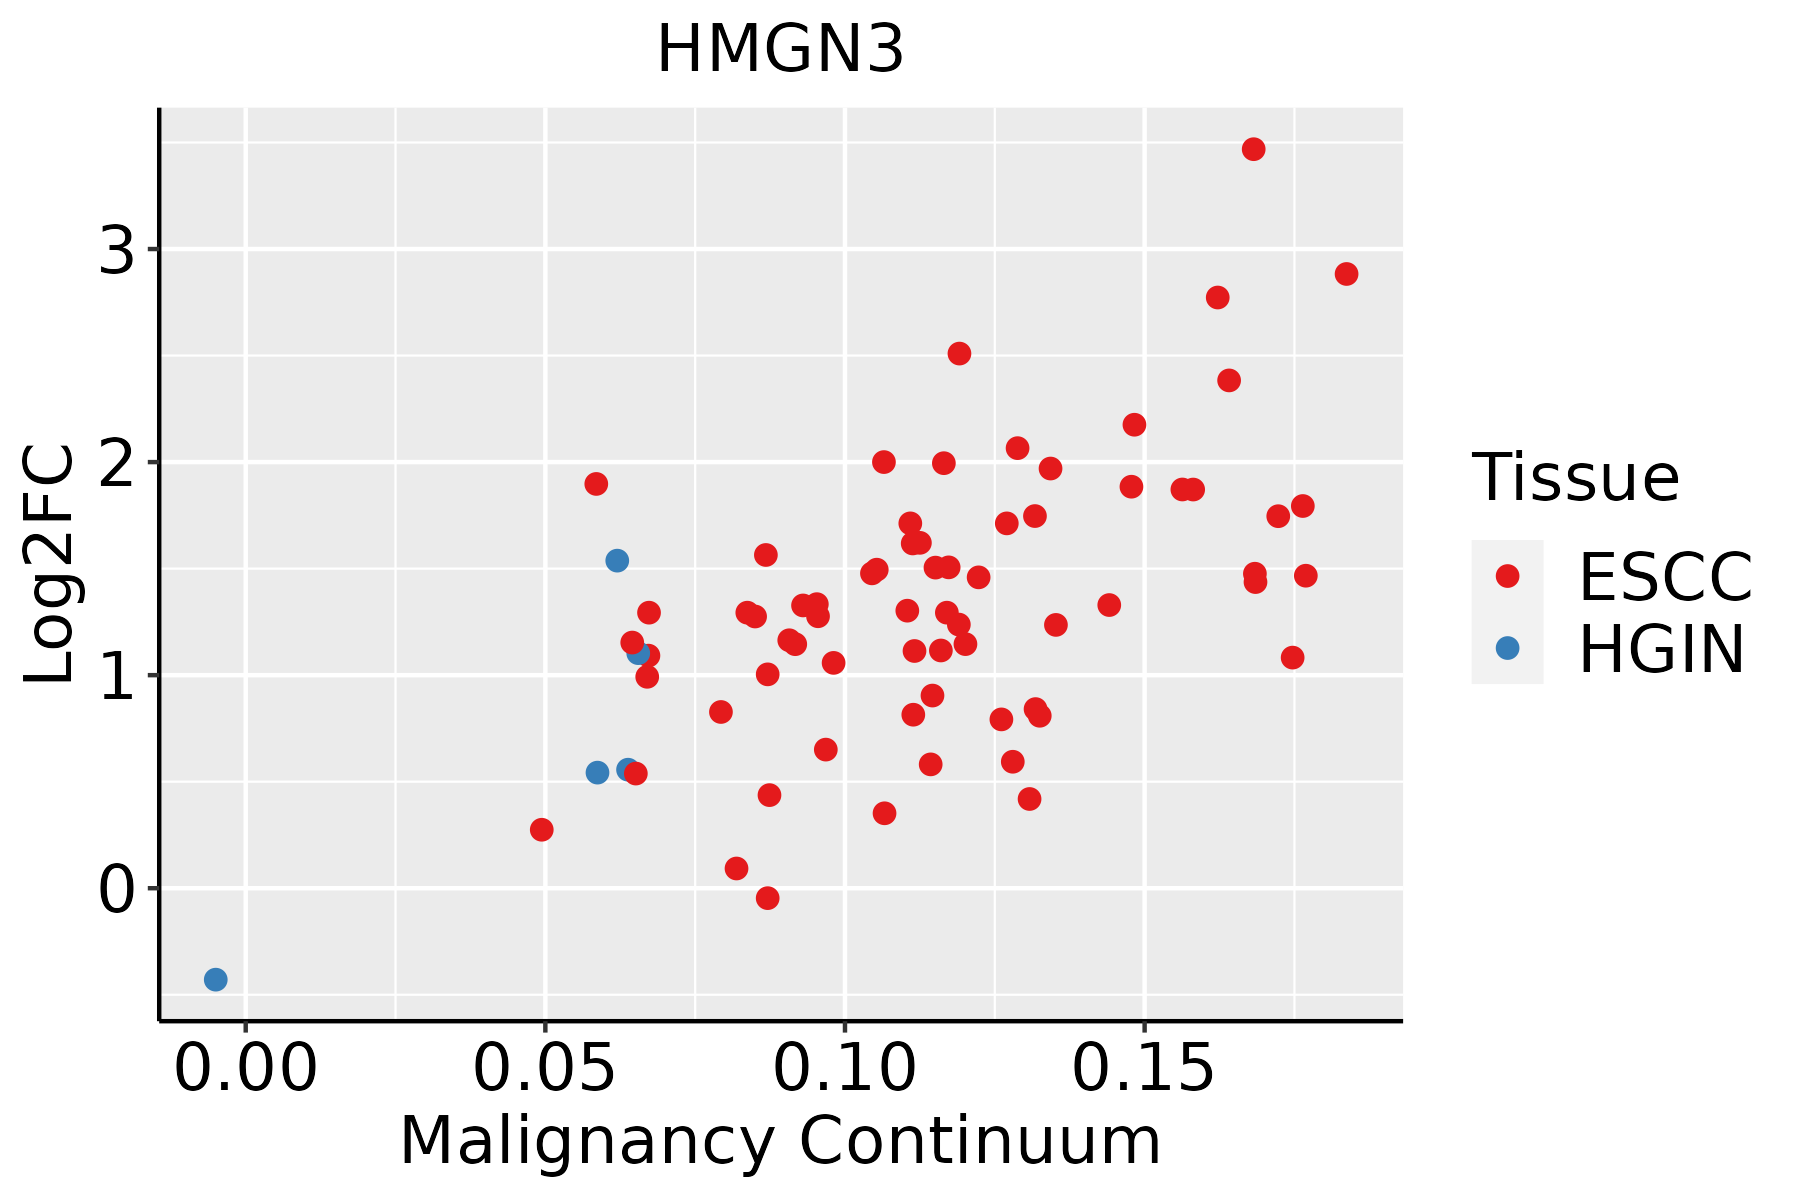 | ESCC: Esophageal squamous cell carcinoma |
| HGIN: High-grade intraepithelial neoplasias | ||
| LGIN: Low-grade intraepithelial neoplasias | ||
| Liver | 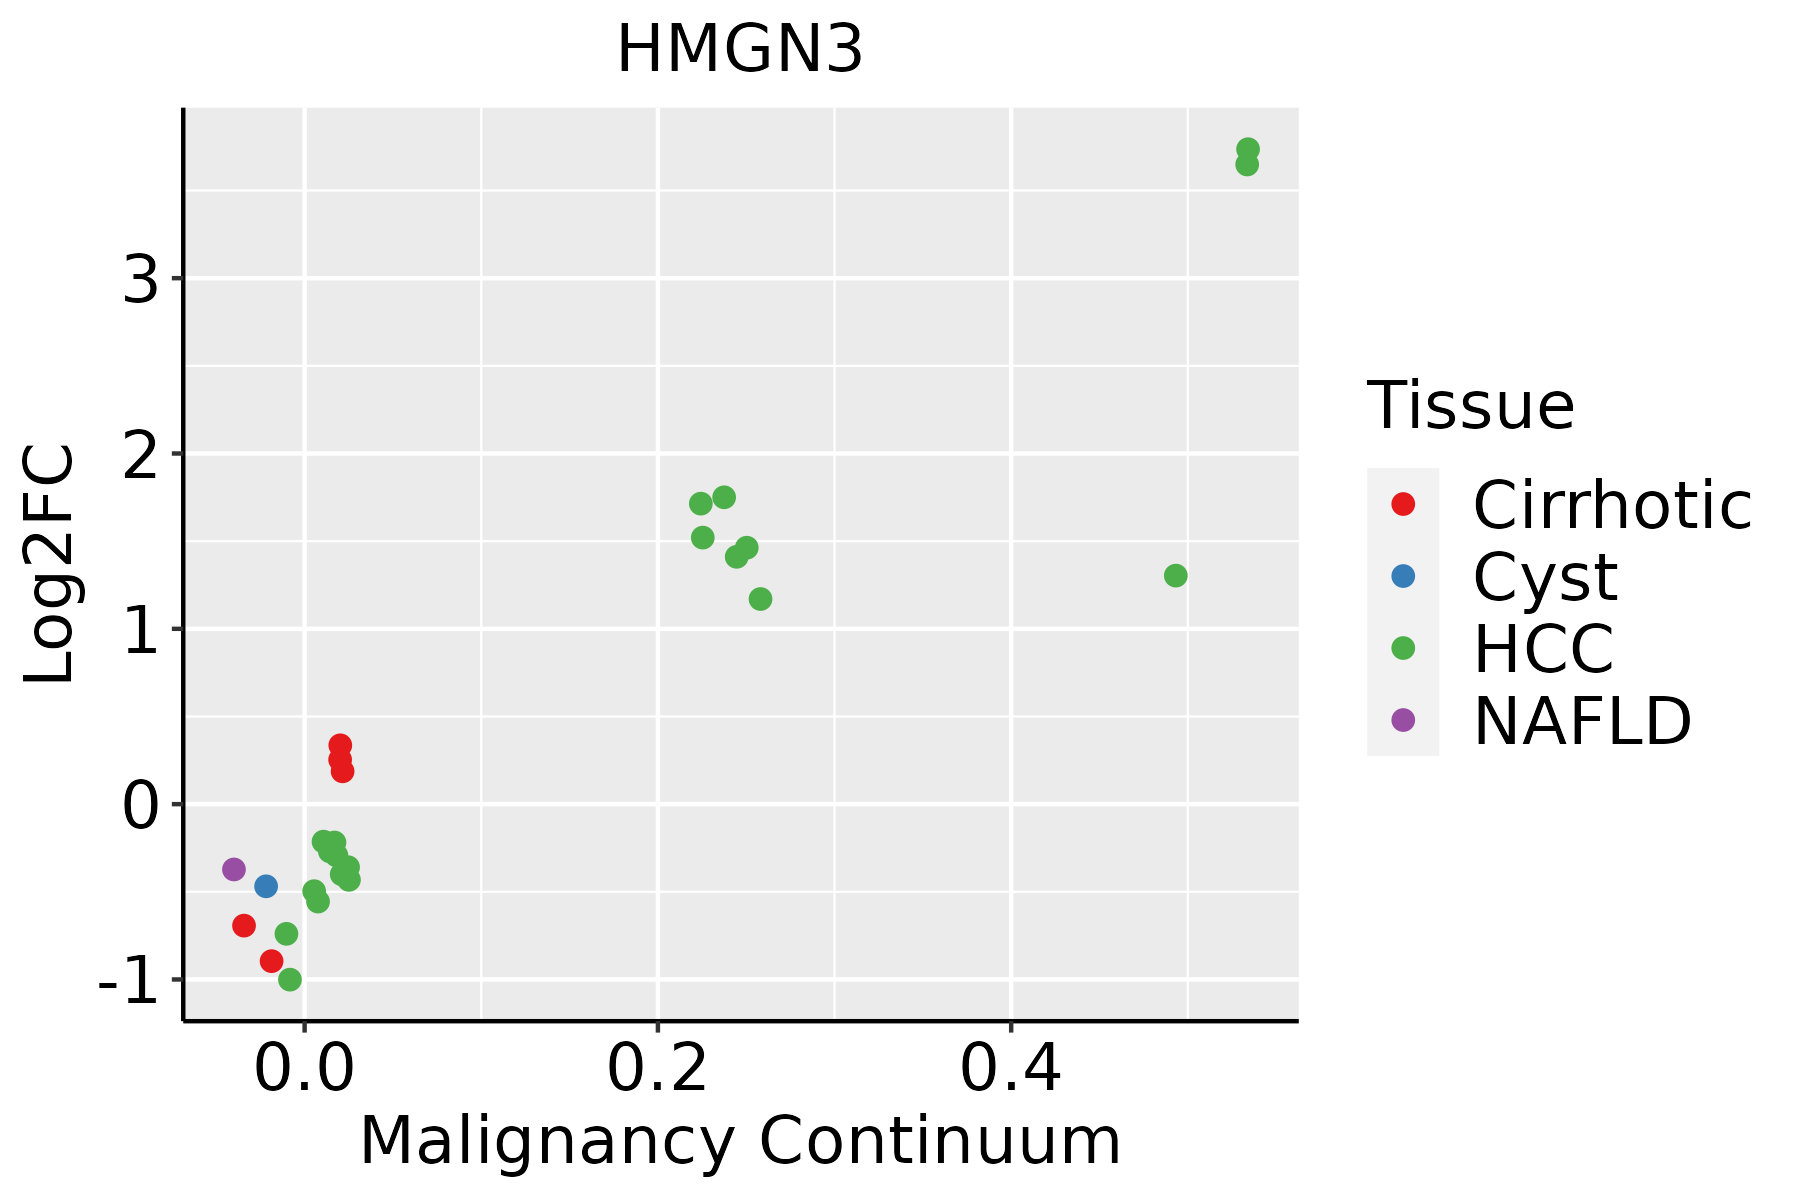 | HCC: Hepatocellular carcinoma |
| NAFLD: Non-alcoholic fatty liver disease | ||
| Oral Cavity | 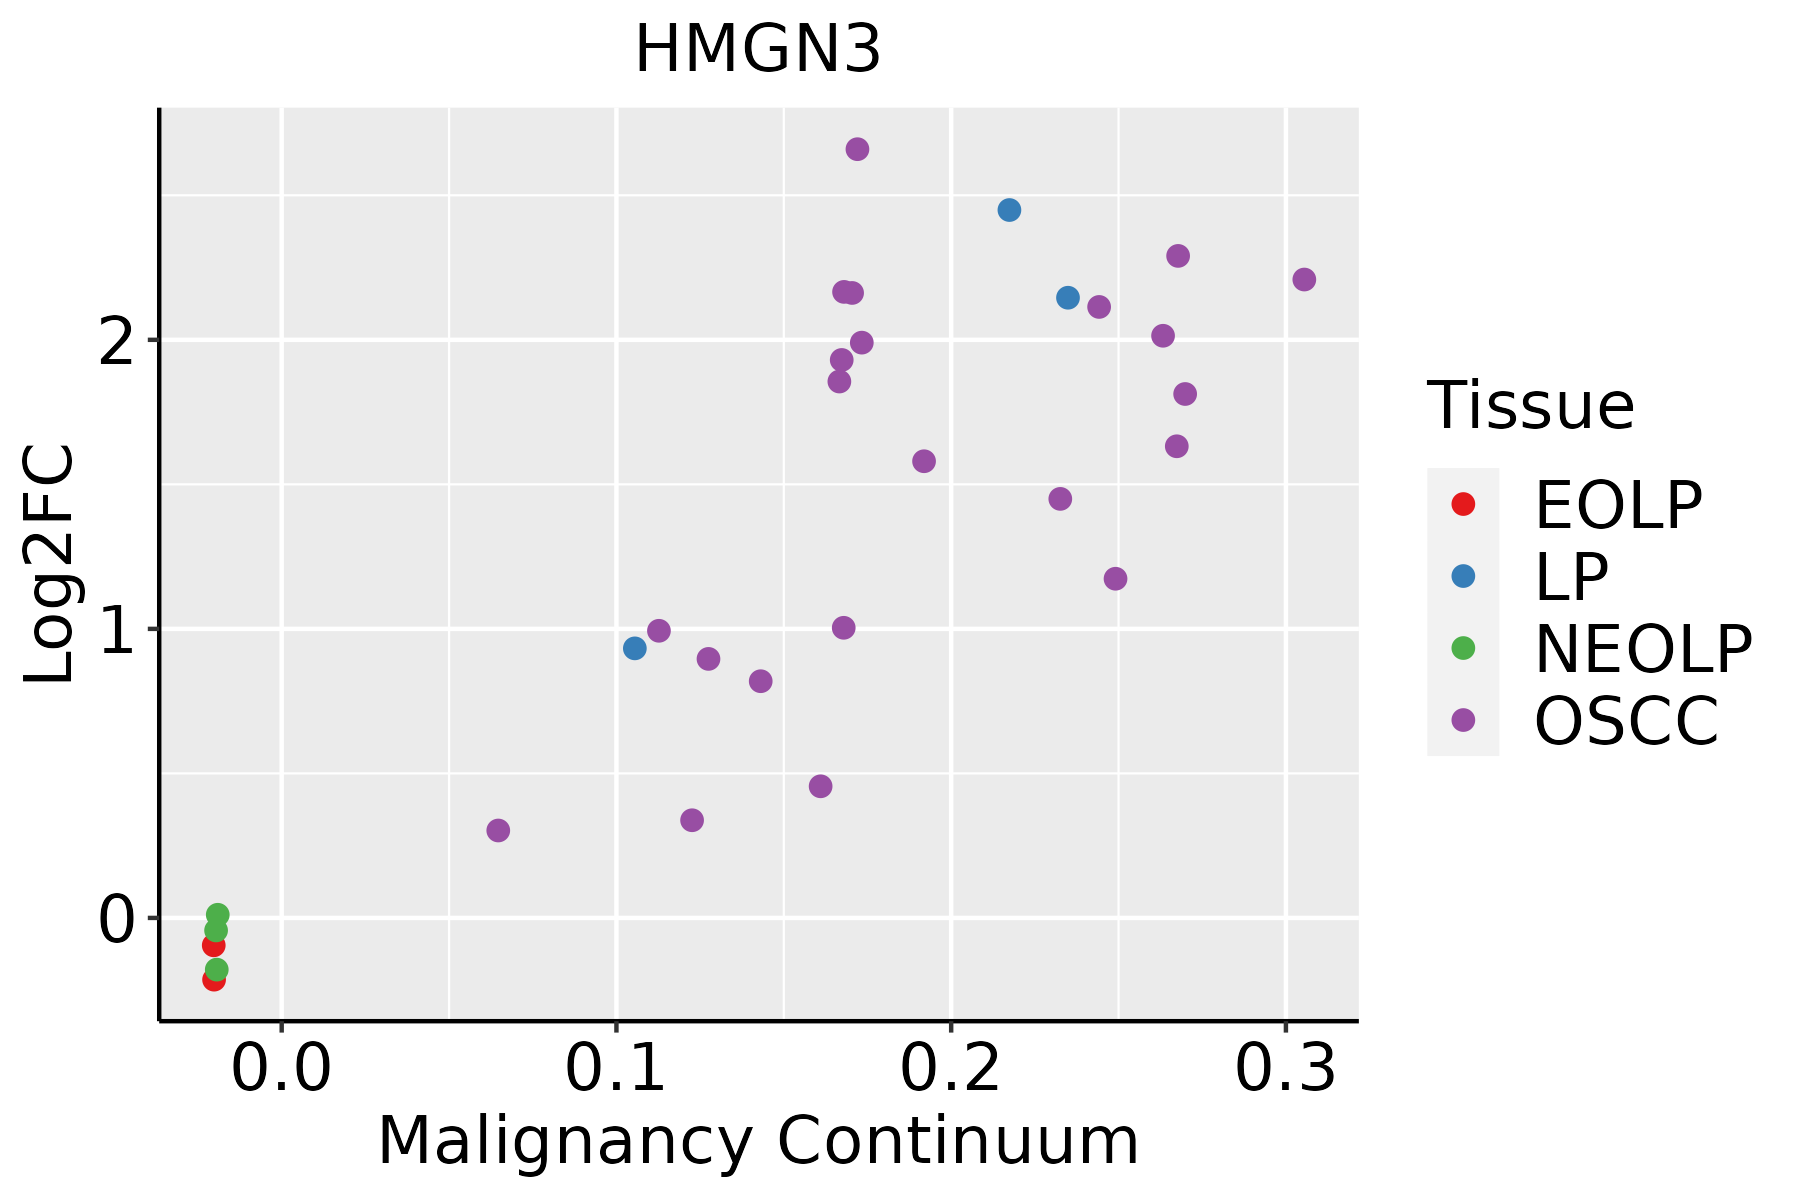 | EOLP: Erosive Oral lichen planus |
| LP: leukoplakia | ||
| NEOLP: Non-erosive oral lichen planus | ||
| OSCC: Oral squamous cell carcinoma | ||
| Prostate |  | BPH: Benign Prostatic Hyperplasia |
| Skin |  | AK: Actinic keratosis |
| cSCC: Cutaneous squamous cell carcinoma | ||
| SCCIS:squamous cell carcinoma in situ | ||
| Thyroid | 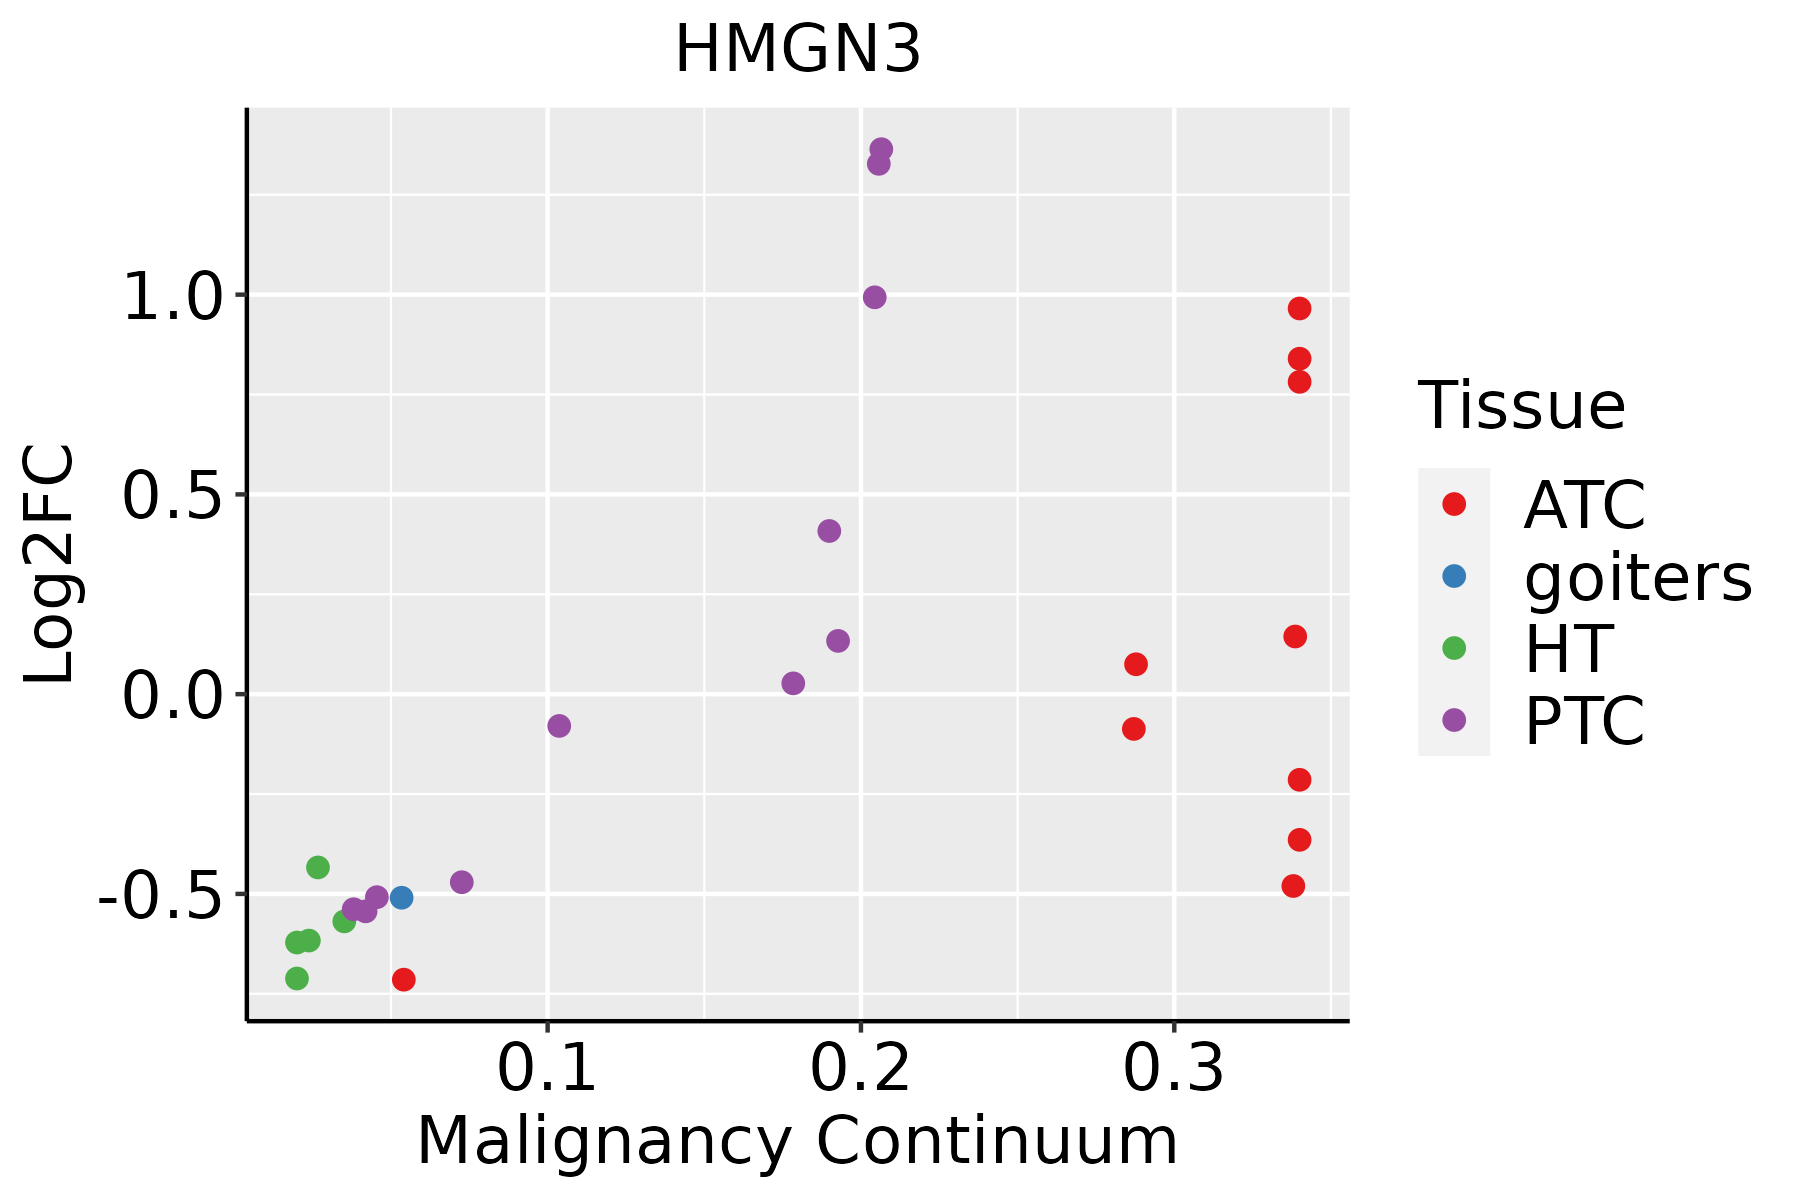 | ATC: Anaplastic thyroid cancer |
| HT: Hashimoto's thyroiditis | ||
| PTC: Papillary thyroid cancer |
| ∗log2FC in expression of this searched gene in stem-like cells from each diseased tissue sample relative to stem-like cells in normal samples in each tissue plotted against the malignancy continuum. Samples are colored based on if they are from different disease stage. |
Top |
Malignant transformation related pathway analysis |
| Find out the enriched GO biological processes and KEGG pathways involved in transition from healthy to precancer to cancer |
| Tissue | Disease Stage | Enriched GO biological Processes |
| Colorectum | AD |  |
| Colorectum | SER |  |
| Colorectum | MSS |  |
| Colorectum | MSI-H |  |
| Colorectum | FAP |  |
| ∗Top 15 enriched GO BP terms are showed in the bar plot of each disease state in each tissue. Each row represents a significant GO biological process which is colored according to the -log10(p.adjust). |
| Page: 1 2 3 4 5 6 7 8 9 |
| GO ID | Tissue | Disease Stage | Description | Gene Ratio | Bg Ratio | pvalue | p.adjust | Count |
| GO:00342849 | Breast | Precancer | response to monosaccharide | 29/1080 | 225/18723 | 4.19e-05 | 9.00e-04 | 29 |
| GO:00097439 | Breast | Precancer | response to carbohydrate | 31/1080 | 253/18723 | 6.15e-05 | 1.25e-03 | 31 |
| GO:00425938 | Breast | Precancer | glucose homeostasis | 31/1080 | 258/18723 | 8.89e-05 | 1.69e-03 | 31 |
| GO:00335008 | Breast | Precancer | carbohydrate homeostasis | 31/1080 | 259/18723 | 9.56e-05 | 1.79e-03 | 31 |
| GO:00097469 | Breast | Precancer | response to hexose | 27/1080 | 219/18723 | 1.61e-04 | 2.69e-03 | 27 |
| GO:00097498 | Breast | Precancer | response to glucose | 25/1080 | 212/18723 | 5.46e-04 | 7.00e-03 | 25 |
| GO:00016787 | Breast | Precancer | cellular glucose homeostasis | 21/1080 | 172/18723 | 9.38e-04 | 1.06e-02 | 21 |
| GO:00713337 | Breast | Precancer | cellular response to glucose stimulus | 19/1080 | 151/18723 | 1.12e-03 | 1.23e-02 | 19 |
| GO:00713228 | Breast | Precancer | cellular response to carbohydrate stimulus | 20/1080 | 163/18723 | 1.15e-03 | 1.26e-02 | 20 |
| GO:00713317 | Breast | Precancer | cellular response to hexose stimulus | 19/1080 | 153/18723 | 1.31e-03 | 1.39e-02 | 19 |
| GO:00713267 | Breast | Precancer | cellular response to monosaccharide stimulus | 19/1080 | 154/18723 | 1.42e-03 | 1.48e-02 | 19 |
| GO:00507086 | Breast | Precancer | regulation of protein secretion | 28/1080 | 268/18723 | 1.76e-03 | 1.74e-02 | 28 |
| GO:00158336 | Breast | Precancer | peptide transport | 27/1080 | 264/18723 | 2.84e-03 | 2.49e-02 | 27 |
| GO:00900875 | Breast | Precancer | regulation of peptide transport | 22/1080 | 202/18723 | 3.14e-03 | 2.65e-02 | 22 |
| GO:00300736 | Breast | Precancer | insulin secretion | 21/1080 | 195/18723 | 4.38e-03 | 3.42e-02 | 21 |
| GO:00716926 | Breast | Precancer | protein localization to extracellular region | 34/1080 | 368/18723 | 4.65e-03 | 3.58e-02 | 34 |
| GO:00093067 | Breast | Precancer | protein secretion | 33/1080 | 359/18723 | 5.65e-03 | 4.08e-02 | 33 |
| GO:00027915 | Breast | Precancer | regulation of peptide secretion | 21/1080 | 200/18723 | 5.86e-03 | 4.20e-02 | 21 |
| GO:00355927 | Breast | Precancer | establishment of protein localization to extracellular region | 33/1080 | 360/18723 | 5.89e-03 | 4.21e-02 | 33 |
| GO:00027904 | Breast | Precancer | peptide secretion | 24/1080 | 242/18723 | 6.87e-03 | 4.67e-02 | 24 |
| Page: 1 2 3 4 5 6 7 8 9 10 11 12 13 14 |
| Pathway ID | Tissue | Disease Stage | Description | Gene Ratio | Bg Ratio | pvalue | p.adjust | qvalue | Count |
| Page: 1 |
Top |
Cell-cell communication analysis |
| Identification of potential cell-cell interactions between two cell types and their ligand-receptor pairs for different disease states |
| Ligand | Receptor | LRpair | Pathway | Tissue | Disease Stage |
| Page: 1 |
Top |
Single-cell gene regulatory network inference analysis |
| Find out the significant the regulons (TFs) and the target genes of each regulon across cell types for different disease states |
| TF | Cell Type | Tissue | Disease Stage | Target Gene | RSS | Regulon Activity |
| HMGN3 | PERI | Breast | Healthy | S100A4,TSPO,PRSS23, etc. | 1.48e-01 |  |
| HMGN3 | PVA | Breast | IDC | S100A4,TSPO,PRSS23, etc. | 1.40e-04 |  |
| HMGN3 | MYOFIB | Breast | IDC | S100A4,TSPO,PRSS23, etc. | 4.74e-04 | |
| HMGN3 | cDC | Lung | AIS | TXN,GABARAPL2,CTSW, etc. | 1.89e-02 |  |
| HMGN3 | PVA | Oral cavity | EOLP | CLU,ADIRF,CRIP1, etc. | 4.17e-02 |  |
| HMGN3 | MSC.MVA | Skin | ADJ | EXPH5,GNA15,PTPN6, etc. | 8.73e-02 |  |
| HMGN3 | MSC.MVA | Skin | cSCC | EXPH5,GNA15,PTPN6, etc. | 1.24e-01 |  |
| HMGN3 | MSC.MVA | Skin | Healthy | EXPH5,GNA15,PTPN6, etc. | 5.11e-02 |  |
| HMGN3 | MSC.MVA | Skin | SCCIS | EXPH5,GNA15,PTPN6, etc. | 8.12e-02 |  |
| HMGN3 | MON | Stomach | GC | TXN,AUTS2,TMSB10, etc. | 2.28e-02 |  |
| ∗The dot plots of a searched regulon are shown for all cell subpopulations in each disease state of each tissue based on the regulon specific score inferred using pySCENIC and by calculating the average expression. |
| Page: 1 2 |
Top |
Somatic mutation of malignant transformation related genes |
| Annotation of somatic variants for genes involved in malignant transformation |
| Hugo Symbol | Variant Class | Variant Classification | dbSNP RS | HGVSc | HGVSp | HGVSp Short | SWISSPROT | BIOTYPE | SIFT | PolyPhen | Tumor Sample Barcode | Tissue | Histology | Sex | Age | Stage | Therapy Types | Drugs | Outcome |
| HMGN3 | SNV | Missense_Mutation | rs752710119 | c.382N>A | p.Glu128Lys | p.E128K | protein_coding | tolerated_low_confidence(1) | benign(0) | TCGA-VS-A8QM-01 | Cervix | cervical & endocervical cancer | Female | <65 | I/II | Chemotherapy | cisplatin | PD | |
| HMGN3 | SNV | Missense_Mutation | c.83N>T | p.Ala28Val | p.A28V | protein_coding | tolerated(0.05) | probably_damaging(0.998) | TCGA-A6-2686-01 | Colorectum | colon adenocarcinoma | Female | >=65 | I/II | Unknown | Unknown | SD | ||
| HMGN3 | SNV | Missense_Mutation | c.226G>A | p.Ala76Thr | p.A76T | protein_coding | tolerated(0.61) | benign(0.005) | TCGA-D5-6930-01 | Colorectum | colon adenocarcinoma | Male | >=65 | I/II | Unknown | Unknown | SD | ||
| HMGN3 | SNV | Missense_Mutation | rs755149736 | c.95C>T | p.Ala32Val | p.A32V | protein_coding | deleterious(0.05) | possibly_damaging(0.629) | TCGA-AP-A059-01 | Endometrium | uterine corpus endometrioid carcinoma | Female | >=65 | I/II | Unknown | Unknown | SD | |
| HMGN3 | SNV | Missense_Mutation | novel | c.157G>A | p.Gly53Arg | p.G53R | protein_coding | tolerated(0.05) | possibly_damaging(0.895) | TCGA-B5-A1MX-01 | Endometrium | uterine corpus endometrioid carcinoma | Female | <65 | I/II | Hormone Therapy | megace | SD | |
| HMGN3 | SNV | Missense_Mutation | novel | c.317G>A | p.Ser106Asn | p.S106N | protein_coding | deleterious_low_confidence(0.04) | benign(0.295) | TCGA-D1-A15X-01 | Endometrium | uterine corpus endometrioid carcinoma | Female | <65 | I/II | Unknown | Unknown | SD | |
| HMGN3 | SNV | Missense_Mutation | novel | c.383N>G | p.Glu128Gly | p.E128G | protein_coding | deleterious_low_confidence(0.01) | benign(0.048) | TCGA-D1-A1NZ-01 | Endometrium | uterine corpus endometrioid carcinoma | Female | <65 | I/II | Unknown | Unknown | SD | |
| HMGN3 | SNV | Missense_Mutation | novel | c.358N>G | p.Gln120Glu | p.Q120E | protein_coding | tolerated(0.06) | benign(0.03) | TCGA-DF-A2KU-01 | Endometrium | uterine corpus endometrioid carcinoma | Female | Unknown | I/II | Unknown | Unknown | SD | |
| HMGN3 | deletion | Frame_Shift_Del | novel | c.199_200delNN | p.Lys67AlafsTer12 | p.K67Afs*12 | protein_coding | TCGA-B5-A11F-01 | Endometrium | uterine corpus endometrioid carcinoma | Female | <65 | I/II | Hormone Therapy | megace | SD | |||
| HMGN3 | SNV | Missense_Mutation | novel | c.179C>G | p.Ala60Gly | p.A60G | protein_coding | tolerated(0.09) | benign(0.003) | TCGA-98-A53I-01 | Lung | lung squamous cell carcinoma | Male | <65 | I/II | Chemotherapy | navelbine | SD |
| Page: 1 2 |
Top |
Related drugs of malignant transformation related genes |
| Identification of chemicals and drugs interact with genes involved in malignant transfromation |
| (DGIdb 4.0) |
| Entrez ID | Symbol | Category | Interaction Types | Drug Claim Name | Drug Name | PMIDs |
| Page: 1 |

Copyright 2023-Present -The University of Texas Health Science Center at Houston |