
|
|||||
|
 | |
| |
| |
| |
| |
| |
|
Gene: HMGN2 |
Gene summary for HMGN2 |
| Gene information | Species | Human | Gene symbol | HMGN2 | Gene ID | 3151 |
| Gene name | high mobility group nucleosomal binding domain 2 | |
| Gene Alias | HMG17 | |
| Cytomap | 1p36.11 | |
| Gene Type | protein-coding | GO ID | GO:0001906 | UniProtAcc | P05204 |
Top |
Malignant transformation analysis |
| Identification of the aberrant gene expression in precancerous and cancerous lesions by comparing the gene expression of stem-like cells in diseased tissues with normal stem cells |
| Entrez ID | Symbol | Replicates | Species | Organ | Tissue | Adj P-value | Log2FC | Malignancy |
| 3151 | HMGN2 | GSM4909281 | Human | Breast | IDC | 9.22e-20 | 6.06e-01 | 0.21 |
| 3151 | HMGN2 | GSM4909282 | Human | Breast | IDC | 2.27e-45 | 8.00e-01 | -0.0288 |
| 3151 | HMGN2 | GSM4909285 | Human | Breast | IDC | 3.52e-04 | 2.98e-01 | 0.21 |
| 3151 | HMGN2 | GSM4909286 | Human | Breast | IDC | 1.06e-07 | 3.52e-01 | 0.1081 |
| 3151 | HMGN2 | GSM4909287 | Human | Breast | IDC | 1.24e-17 | 4.34e-01 | 0.2057 |
| 3151 | HMGN2 | GSM4909288 | Human | Breast | IDC | 6.24e-04 | 2.82e-01 | 0.0988 |
| 3151 | HMGN2 | GSM4909290 | Human | Breast | IDC | 3.25e-07 | 4.30e-01 | 0.2096 |
| 3151 | HMGN2 | GSM4909291 | Human | Breast | IDC | 2.53e-05 | 3.51e-01 | 0.1753 |
| 3151 | HMGN2 | GSM4909293 | Human | Breast | IDC | 6.98e-15 | 4.30e-01 | 0.1581 |
| 3151 | HMGN2 | GSM4909294 | Human | Breast | IDC | 4.92e-37 | 6.56e-01 | 0.2022 |
| 3151 | HMGN2 | GSM4909295 | Human | Breast | IDC | 1.34e-06 | 3.93e-01 | 0.0898 |
| 3151 | HMGN2 | GSM4909296 | Human | Breast | IDC | 1.78e-14 | 2.69e-01 | 0.1524 |
| 3151 | HMGN2 | GSM4909297 | Human | Breast | IDC | 3.25e-22 | 1.30e-01 | 0.1517 |
| 3151 | HMGN2 | GSM4909298 | Human | Breast | IDC | 1.98e-09 | 4.41e-01 | 0.1551 |
| 3151 | HMGN2 | GSM4909301 | Human | Breast | IDC | 6.91e-05 | 3.14e-01 | 0.1577 |
| 3151 | HMGN2 | GSM4909305 | Human | Breast | IDC | 1.21e-03 | 3.04e-01 | 0.0436 |
| 3151 | HMGN2 | GSM4909306 | Human | Breast | IDC | 2.19e-02 | 3.06e-01 | 0.1564 |
| 3151 | HMGN2 | GSM4909307 | Human | Breast | IDC | 4.39e-03 | 3.42e-01 | 0.1569 |
| 3151 | HMGN2 | GSM4909308 | Human | Breast | IDC | 1.25e-20 | 5.92e-01 | 0.158 |
| 3151 | HMGN2 | GSM4909309 | Human | Breast | IDC | 2.35e-10 | 3.08e-01 | 0.0483 |
| Page: 1 2 3 4 5 6 7 8 9 10 11 12 13 14 |
| Tissue | Expression Dynamics | Abbreviation |
| Breast |  | IDC: Invasive ductal carcinoma |
| DCIS: Ductal carcinoma in situ | ||
| Precancer(BRCA1-mut): Precancerous lesion from BRCA1 mutation carriers | ||
| Cervix | 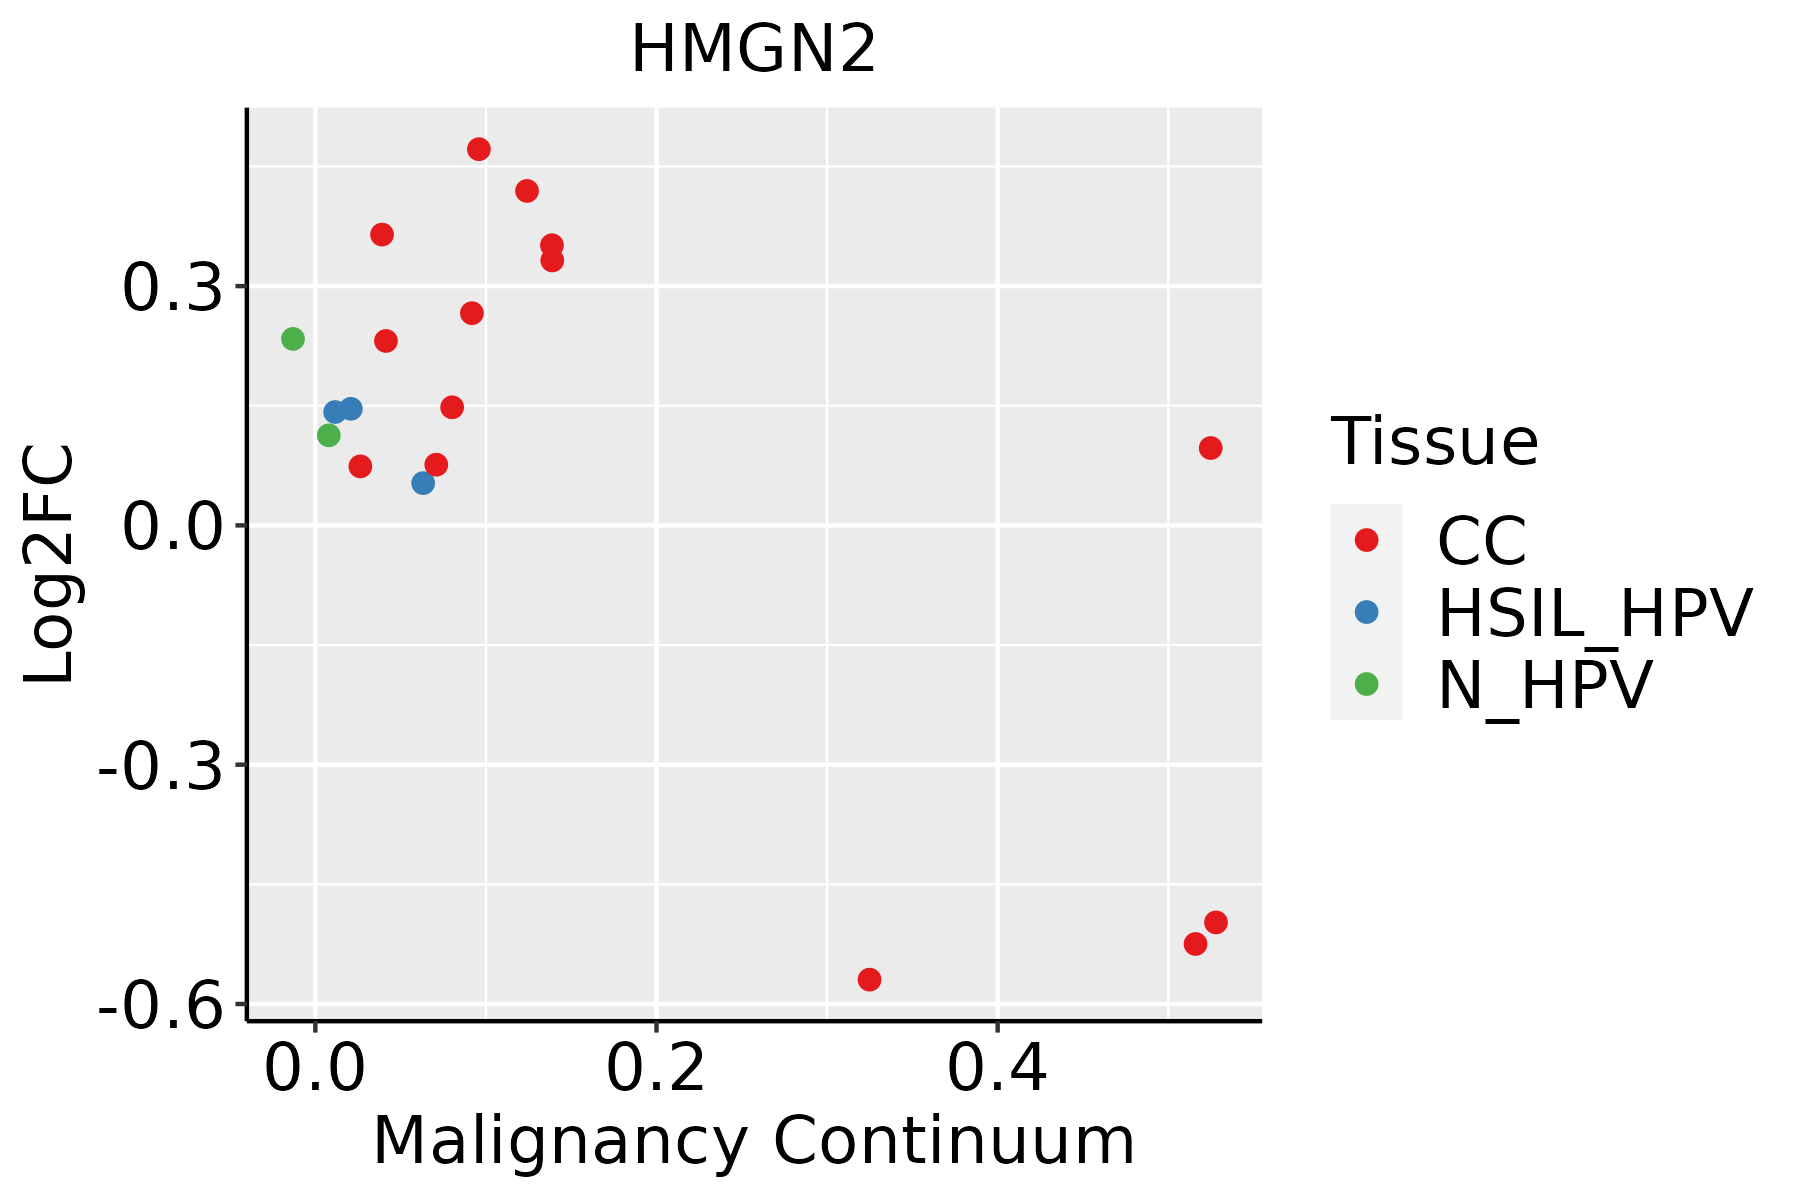 | CC: Cervix cancer |
| HSIL_HPV: HPV-infected high-grade squamous intraepithelial lesions | ||
| N_HPV: HPV-infected normal cervix | ||
| Endometrium |  | AEH: Atypical endometrial hyperplasia |
| EEC: Endometrioid Cancer | ||
| Esophagus |  | ESCC: Esophageal squamous cell carcinoma |
| HGIN: High-grade intraepithelial neoplasias | ||
| LGIN: Low-grade intraepithelial neoplasias | ||
| GC | 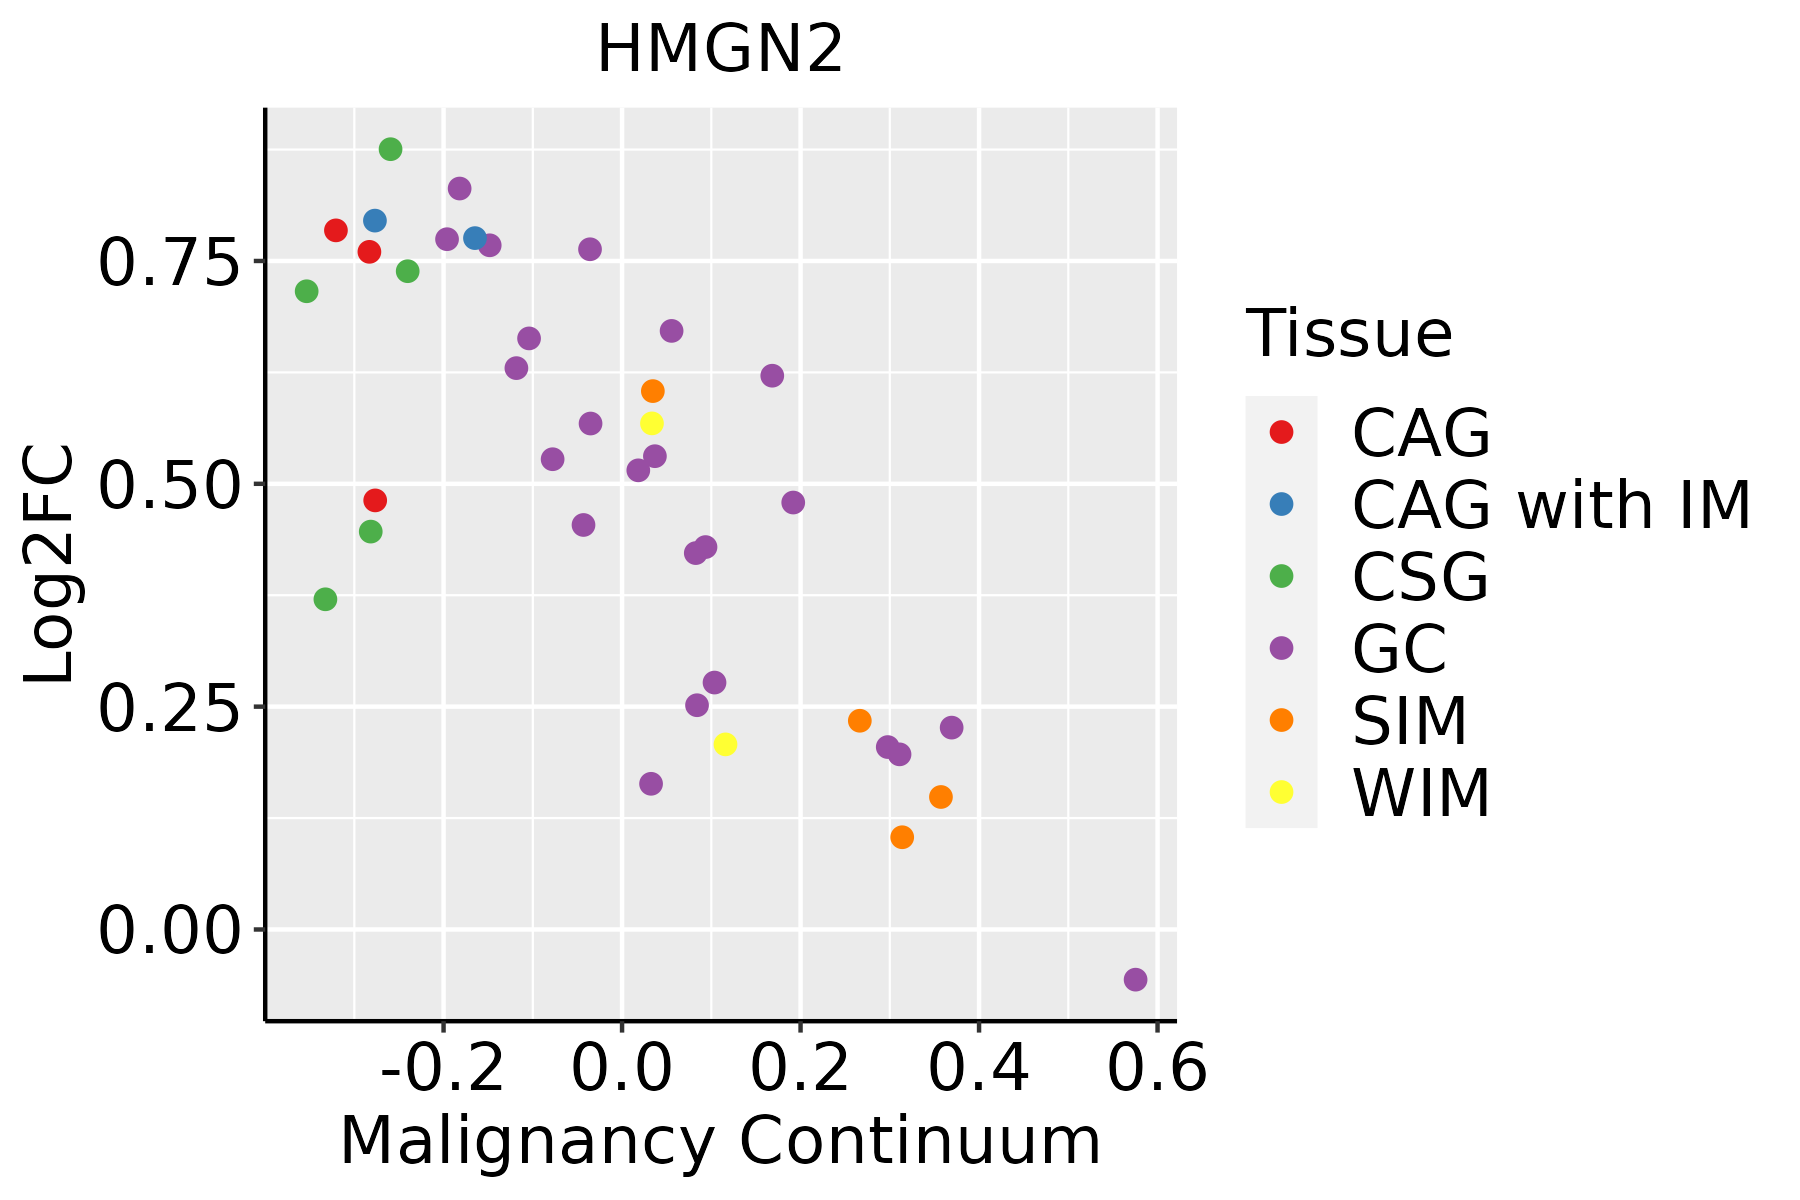 | CAG: Chronic atrophic gastritis |
| CAG with IM: Chronic atrophic gastritis with intestinal metaplasia | ||
| CSG: Chronic superficial gastritis | ||
| GC: Gastric cancer | ||
| SIM: Severe intestinal metaplasia | ||
| WIM: Wild intestinal metaplasia | ||
| Liver |  | HCC: Hepatocellular carcinoma |
| NAFLD: Non-alcoholic fatty liver disease | ||
| Oral Cavity | 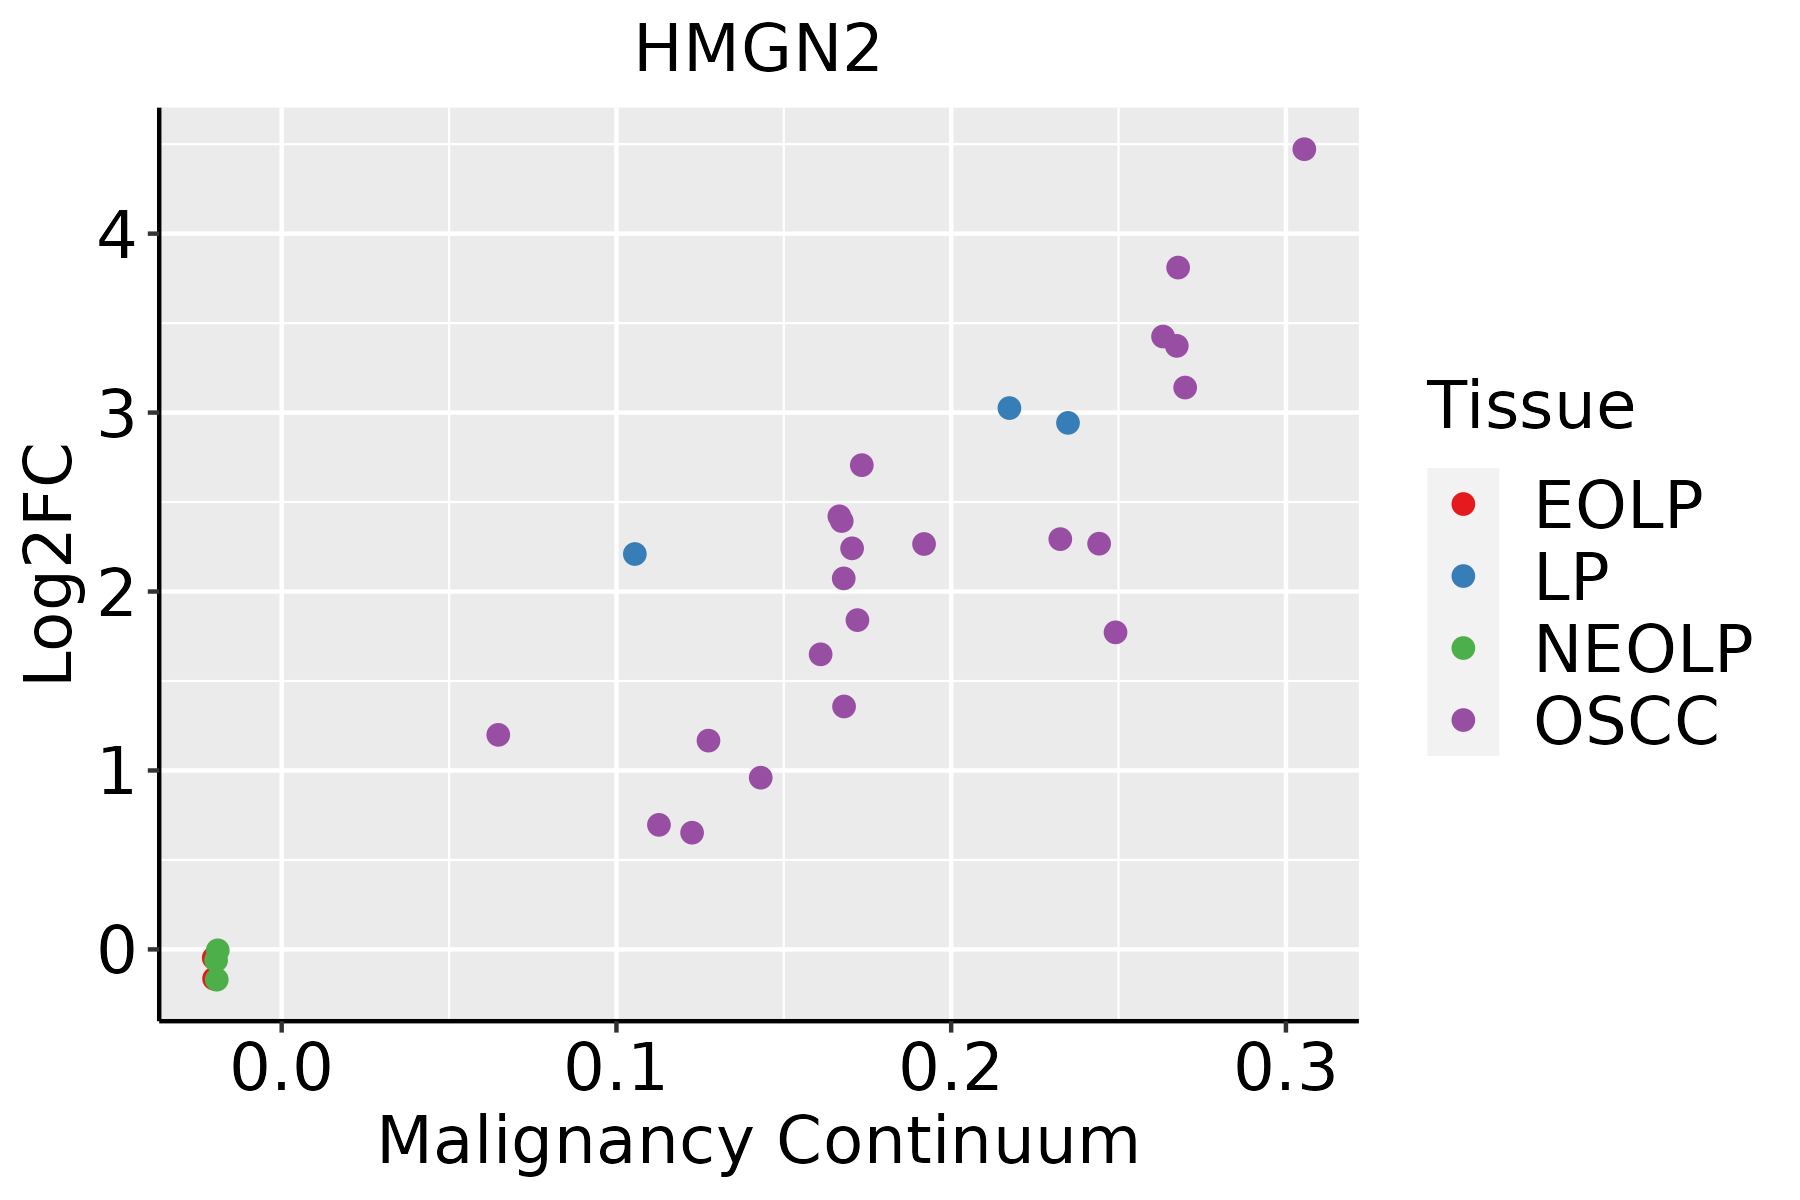 | EOLP: Erosive Oral lichen planus |
| LP: leukoplakia | ||
| NEOLP: Non-erosive oral lichen planus | ||
| OSCC: Oral squamous cell carcinoma | ||
| Prostate |  | BPH: Benign Prostatic Hyperplasia |
| Skin | 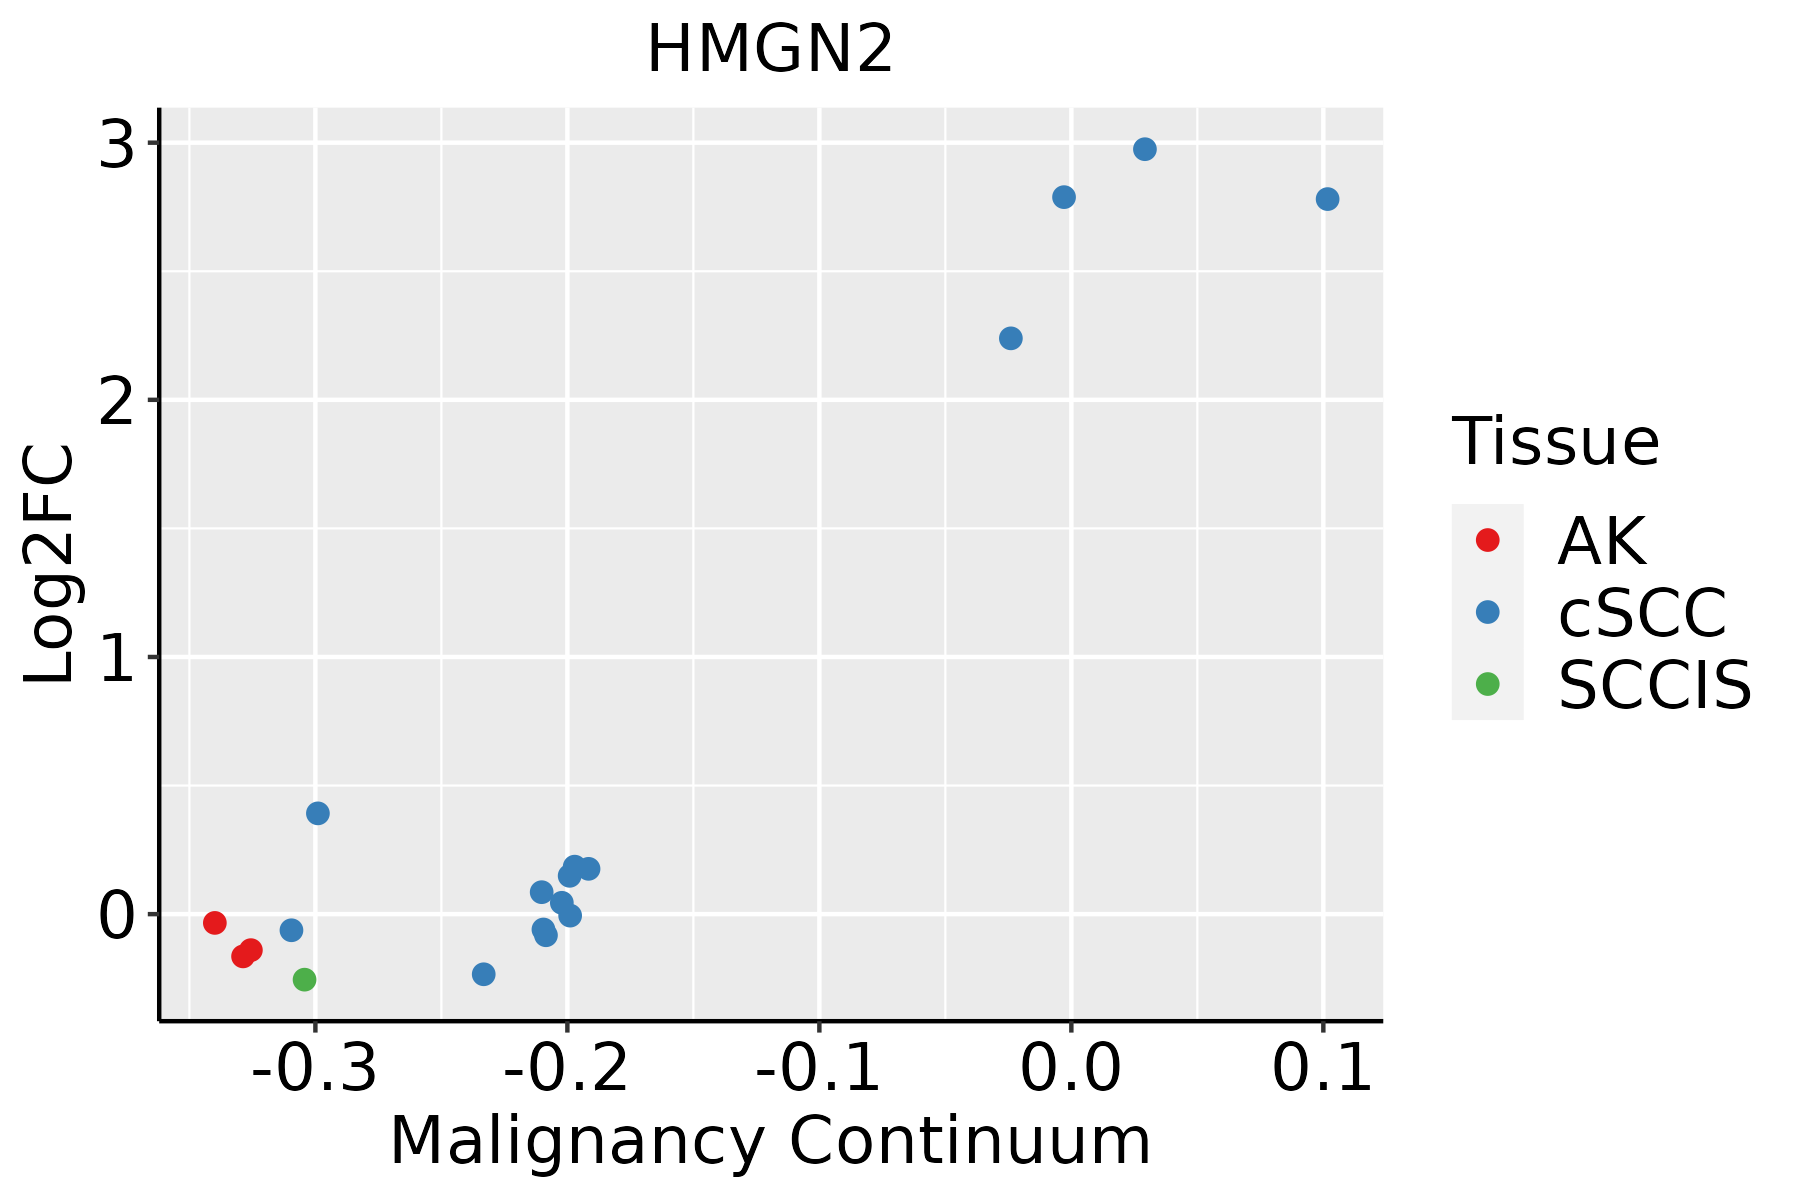 | AK: Actinic keratosis |
| cSCC: Cutaneous squamous cell carcinoma | ||
| SCCIS:squamous cell carcinoma in situ | ||
| Thyroid | 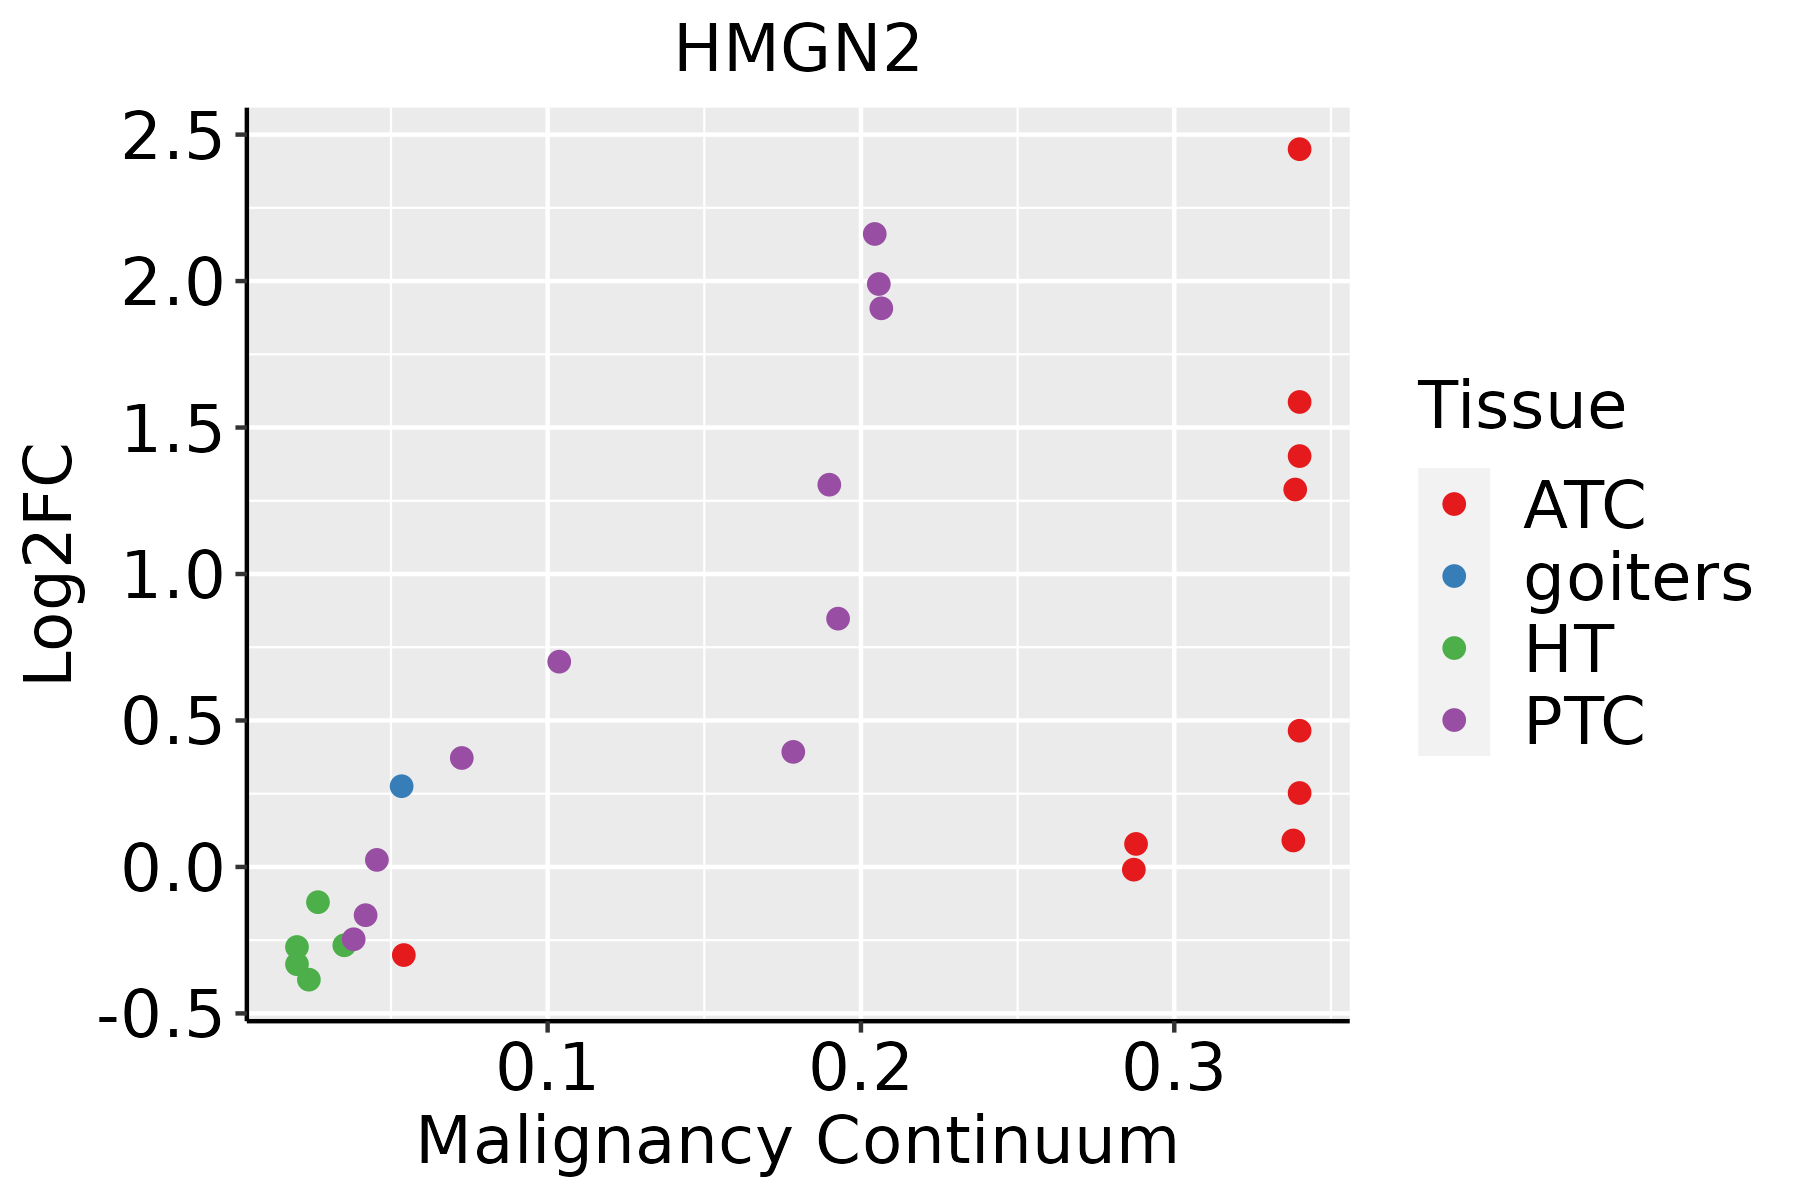 | ATC: Anaplastic thyroid cancer |
| HT: Hashimoto's thyroiditis | ||
| PTC: Papillary thyroid cancer |
| ∗log2FC in expression of this searched gene in stem-like cells from each diseased tissue sample relative to stem-like cells in normal samples in each tissue plotted against the malignancy continuum. Samples are colored based on if they are from different disease stage. |
Top |
Malignant transformation related pathway analysis |
| Find out the enriched GO biological processes and KEGG pathways involved in transition from healthy to precancer to cancer |
| Tissue | Disease Stage | Enriched GO biological Processes |
| Colorectum | AD |  |
| Colorectum | SER |  |
| Colorectum | MSS |  |
| Colorectum | MSI-H |  |
| Colorectum | FAP |  |
| ∗Top 15 enriched GO BP terms are showed in the bar plot of each disease state in each tissue. Each row represents a significant GO biological process which is colored according to the -log10(p.adjust). |
| Page: 1 2 3 4 5 6 7 8 9 |
| GO ID | Tissue | Disease Stage | Description | Gene Ratio | Bg Ratio | pvalue | p.adjust | Count |
| GO:00197307 | Breast | Precancer | antimicrobial humoral response | 19/1080 | 122/18723 | 7.02e-05 | 1.40e-03 | 19 |
| GO:00618446 | Breast | Precancer | antimicrobial humoral immune response mediated by antimicrobial peptide | 14/1080 | 79/18723 | 1.53e-04 | 2.61e-03 | 14 |
| GO:001973011 | Breast | IDC | antimicrobial humoral response | 23/1434 | 122/18723 | 4.67e-05 | 1.04e-03 | 23 |
| GO:006184411 | Breast | IDC | antimicrobial humoral immune response mediated by antimicrobial peptide | 16/1434 | 79/18723 | 2.75e-04 | 4.24e-03 | 16 |
| GO:00069596 | Breast | IDC | humoral immune response | 40/1434 | 317/18723 | 1.25e-03 | 1.33e-02 | 40 |
| GO:001973021 | Breast | DCIS | antimicrobial humoral response | 21/1390 | 122/18723 | 2.40e-04 | 3.75e-03 | 21 |
| GO:006184421 | Breast | DCIS | antimicrobial humoral immune response mediated by antimicrobial peptide | 15/1390 | 79/18723 | 6.25e-04 | 7.87e-03 | 15 |
| GO:000695911 | Breast | DCIS | humoral immune response | 37/1390 | 317/18723 | 4.16e-03 | 3.29e-02 | 37 |
| GO:00063257 | Cervix | CC | chromatin organization | 78/2311 | 409/18723 | 5.40e-05 | 8.02e-04 | 78 |
| GO:00197308 | Cervix | CC | antimicrobial humoral response | 27/2311 | 122/18723 | 1.70e-03 | 1.29e-02 | 27 |
| GO:00019067 | Cervix | CC | cell killing | 37/2311 | 188/18723 | 2.61e-03 | 1.80e-02 | 37 |
| GO:00618447 | Cervix | CC | antimicrobial humoral immune response mediated by antimicrobial peptide | 18/2311 | 79/18723 | 6.82e-03 | 3.74e-02 | 18 |
| GO:00069597 | Cervix | CC | humoral immune response | 54/2311 | 317/18723 | 8.57e-03 | 4.42e-02 | 54 |
| GO:00063258 | Endometrium | AEH | chromatin organization | 64/2100 | 409/18723 | 3.69e-03 | 2.52e-02 | 64 |
| GO:000632513 | Endometrium | EEC | chromatin organization | 65/2168 | 409/18723 | 4.98e-03 | 3.14e-02 | 65 |
| GO:000632516 | Esophagus | HGIN | chromatin organization | 92/2587 | 409/18723 | 1.05e-06 | 4.16e-05 | 92 |
| GO:000632517 | Esophagus | ESCC | chromatin organization | 240/8552 | 409/18723 | 6.52e-08 | 1.14e-06 | 240 |
| GO:000632511 | Liver | HCC | chromatin organization | 206/7958 | 409/18723 | 7.23e-04 | 4.41e-03 | 206 |
| GO:00197306 | Liver | Cyst | antimicrobial humoral response | 11/496 | 122/18723 | 4.02e-04 | 1.24e-02 | 11 |
| GO:00019066 | Liver | Cyst | cell killing | 13/496 | 188/18723 | 1.55e-03 | 3.61e-02 | 13 |
| Page: 1 2 3 |
| Pathway ID | Tissue | Disease Stage | Description | Gene Ratio | Bg Ratio | pvalue | p.adjust | qvalue | Count |
| Page: 1 |
Top |
Cell-cell communication analysis |
| Identification of potential cell-cell interactions between two cell types and their ligand-receptor pairs for different disease states |
| Ligand | Receptor | LRpair | Pathway | Tissue | Disease Stage |
| Page: 1 |
Top |
Single-cell gene regulatory network inference analysis |
| Find out the significant the regulons (TFs) and the target genes of each regulon across cell types for different disease states |
| TF | Cell Type | Tissue | Disease Stage | Target Gene | RSS | Regulon Activity |
| ∗The dot plots of a searched regulon are shown for all cell subpopulations in each disease state of each tissue based on the regulon specific score inferred using pySCENIC and by calculating the average expression. |
| Page: 1 |
Top |
Somatic mutation of malignant transformation related genes |
| Annotation of somatic variants for genes involved in malignant transformation |
| Hugo Symbol | Variant Class | Variant Classification | dbSNP RS | HGVSc | HGVSp | HGVSp Short | SWISSPROT | BIOTYPE | SIFT | PolyPhen | Tumor Sample Barcode | Tissue | Histology | Sex | Age | Stage | Therapy Types | Drugs | Outcome |
| HMGN2 | SNV | Missense_Mutation | c.37G>A | p.Asp13Asn | p.D13N | P05204 | protein_coding | deleterious(0.05) | benign(0.116) | TCGA-B6-A0IK-01 | Breast | breast invasive carcinoma | Female | <65 | III/IV | Unknown | Unknown | PD | |
| HMGN2 | SNV | Missense_Mutation | novel | c.181N>C | p.Asp61His | p.D61H | P05204 | protein_coding | deleterious(0) | probably_damaging(0.954) | TCGA-VS-A94X-01 | Cervix | cervical & endocervical cancer | Female | <65 | I/II | Chemotherapy | cisplatin | PD |
| HMGN2 | SNV | Missense_Mutation | c.116C>A | p.Pro39His | p.P39H | P05204 | protein_coding | deleterious(0.02) | possibly_damaging(0.888) | TCGA-B5-A0JY-01 | Endometrium | uterine corpus endometrioid carcinoma | Female | <65 | III/IV | Chemotherapy | doxorubicin | SD | |
| HMGN2 | SNV | Missense_Mutation | c.243N>T | p.Gln81His | p.Q81H | P05204 | protein_coding | deleterious(0.04) | probably_damaging(0.986) | TCGA-BS-A0UF-01 | Endometrium | uterine corpus endometrioid carcinoma | Female | >=65 | I/II | Unknown | Unknown | SD | |
| HMGN2 | SNV | Missense_Mutation | novel | c.250G>A | p.Glu84Lys | p.E84K | P05204 | protein_coding | deleterious(0.02) | possibly_damaging(0.587) | TCGA-CQ-5334-01 | Oral cavity | head & neck squamous cell carcinoma | Male | >=65 | I/II | Unknown | Unknown | PD |
| HMGN2 | SNV | Missense_Mutation | c.217G>A | p.Gly73Arg | p.G73R | P05204 | protein_coding | tolerated(0.16) | probably_damaging(0.999) | TCGA-BR-7703-01 | Stomach | stomach adenocarcinoma | Male | >=65 | I/II | Unknown | Unknown | SD |
| Page: 1 |
Top |
Related drugs of malignant transformation related genes |
| Identification of chemicals and drugs interact with genes involved in malignant transfromation |
| (DGIdb 4.0) |
| Entrez ID | Symbol | Category | Interaction Types | Drug Claim Name | Drug Name | PMIDs |
| Page: 1 |

Copyright 2023-Present -The University of Texas Health Science Center at Houston |