
|
|||||
|
 | |
| |
| |
| |
| |
| |
|
Gene: HMGB3 |
Gene summary for HMGB3 |
| Gene information | Species | Human | Gene symbol | HMGB3 | Gene ID | 3149 |
| Gene name | high mobility group box 3 | |
| Gene Alias | HMG-2a | |
| Cytomap | Xq28 | |
| Gene Type | protein-coding | GO ID | GO:0002376 | UniProtAcc | O15347 |
Top |
Malignant transformation analysis |
| Identification of the aberrant gene expression in precancerous and cancerous lesions by comparing the gene expression of stem-like cells in diseased tissues with normal stem cells |
| Entrez ID | Symbol | Replicates | Species | Organ | Tissue | Adj P-value | Log2FC | Malignancy |
| 3149 | HMGB3 | GSM4909281 | Human | Breast | IDC | 3.40e-14 | 4.14e-01 | 0.21 |
| 3149 | HMGB3 | GSM4909282 | Human | Breast | IDC | 1.99e-28 | 6.52e-01 | -0.0288 |
| 3149 | HMGB3 | GSM4909285 | Human | Breast | IDC | 3.64e-13 | 3.37e-01 | 0.21 |
| 3149 | HMGB3 | GSM4909286 | Human | Breast | IDC | 3.52e-04 | 2.39e-01 | 0.1081 |
| 3149 | HMGB3 | GSM4909287 | Human | Breast | IDC | 1.46e-11 | 4.32e-01 | 0.2057 |
| 3149 | HMGB3 | GSM4909290 | Human | Breast | IDC | 1.04e-18 | 5.57e-01 | 0.2096 |
| 3149 | HMGB3 | GSM4909295 | Human | Breast | IDC | 7.01e-03 | 3.08e-01 | 0.0898 |
| 3149 | HMGB3 | GSM4909304 | Human | Breast | IDC | 1.39e-02 | 1.71e-01 | 0.1636 |
| 3149 | HMGB3 | GSM4909307 | Human | Breast | IDC | 1.16e-03 | 2.92e-01 | 0.1569 |
| 3149 | HMGB3 | GSM4909308 | Human | Breast | IDC | 3.63e-27 | 6.27e-01 | 0.158 |
| 3149 | HMGB3 | GSM4909311 | Human | Breast | IDC | 3.11e-02 | -9.37e-02 | 0.1534 |
| 3149 | HMGB3 | GSM4909319 | Human | Breast | IDC | 8.39e-04 | -1.18e-02 | 0.1563 |
| 3149 | HMGB3 | M2 | Human | Breast | IDC | 5.39e-08 | 6.50e-01 | 0.21 |
| 3149 | HMGB3 | NCCBC3 | Human | Breast | DCIS | 3.35e-03 | 2.73e-01 | 0.1198 |
| 3149 | HMGB3 | P2 | Human | Breast | IDC | 3.87e-27 | 9.17e-01 | 0.21 |
| 3149 | HMGB3 | DCIS2 | Human | Breast | DCIS | 1.01e-12 | 4.36e-02 | 0.0085 |
| 3149 | HMGB3 | HTA11_3410_2000001011 | Human | Colorectum | AD | 1.30e-03 | 1.44e-01 | 0.0155 |
| 3149 | HMGB3 | HTA11_2487_2000001011 | Human | Colorectum | SER | 5.46e-08 | 2.75e-01 | -0.1808 |
| 3149 | HMGB3 | HTA11_1938_2000001011 | Human | Colorectum | AD | 1.89e-11 | 5.02e-01 | -0.0811 |
| 3149 | HMGB3 | HTA11_78_2000001011 | Human | Colorectum | AD | 2.30e-02 | 2.32e-01 | -0.1088 |
| Page: 1 2 3 4 5 6 7 8 |
| Tissue | Expression Dynamics | Abbreviation |
| Breast |  | IDC: Invasive ductal carcinoma |
| DCIS: Ductal carcinoma in situ | ||
| Precancer(BRCA1-mut): Precancerous lesion from BRCA1 mutation carriers | ||
| Colorectum (GSE201348) |  | FAP: Familial adenomatous polyposis |
| CRC: Colorectal cancer | ||
| Colorectum (HTA11) | 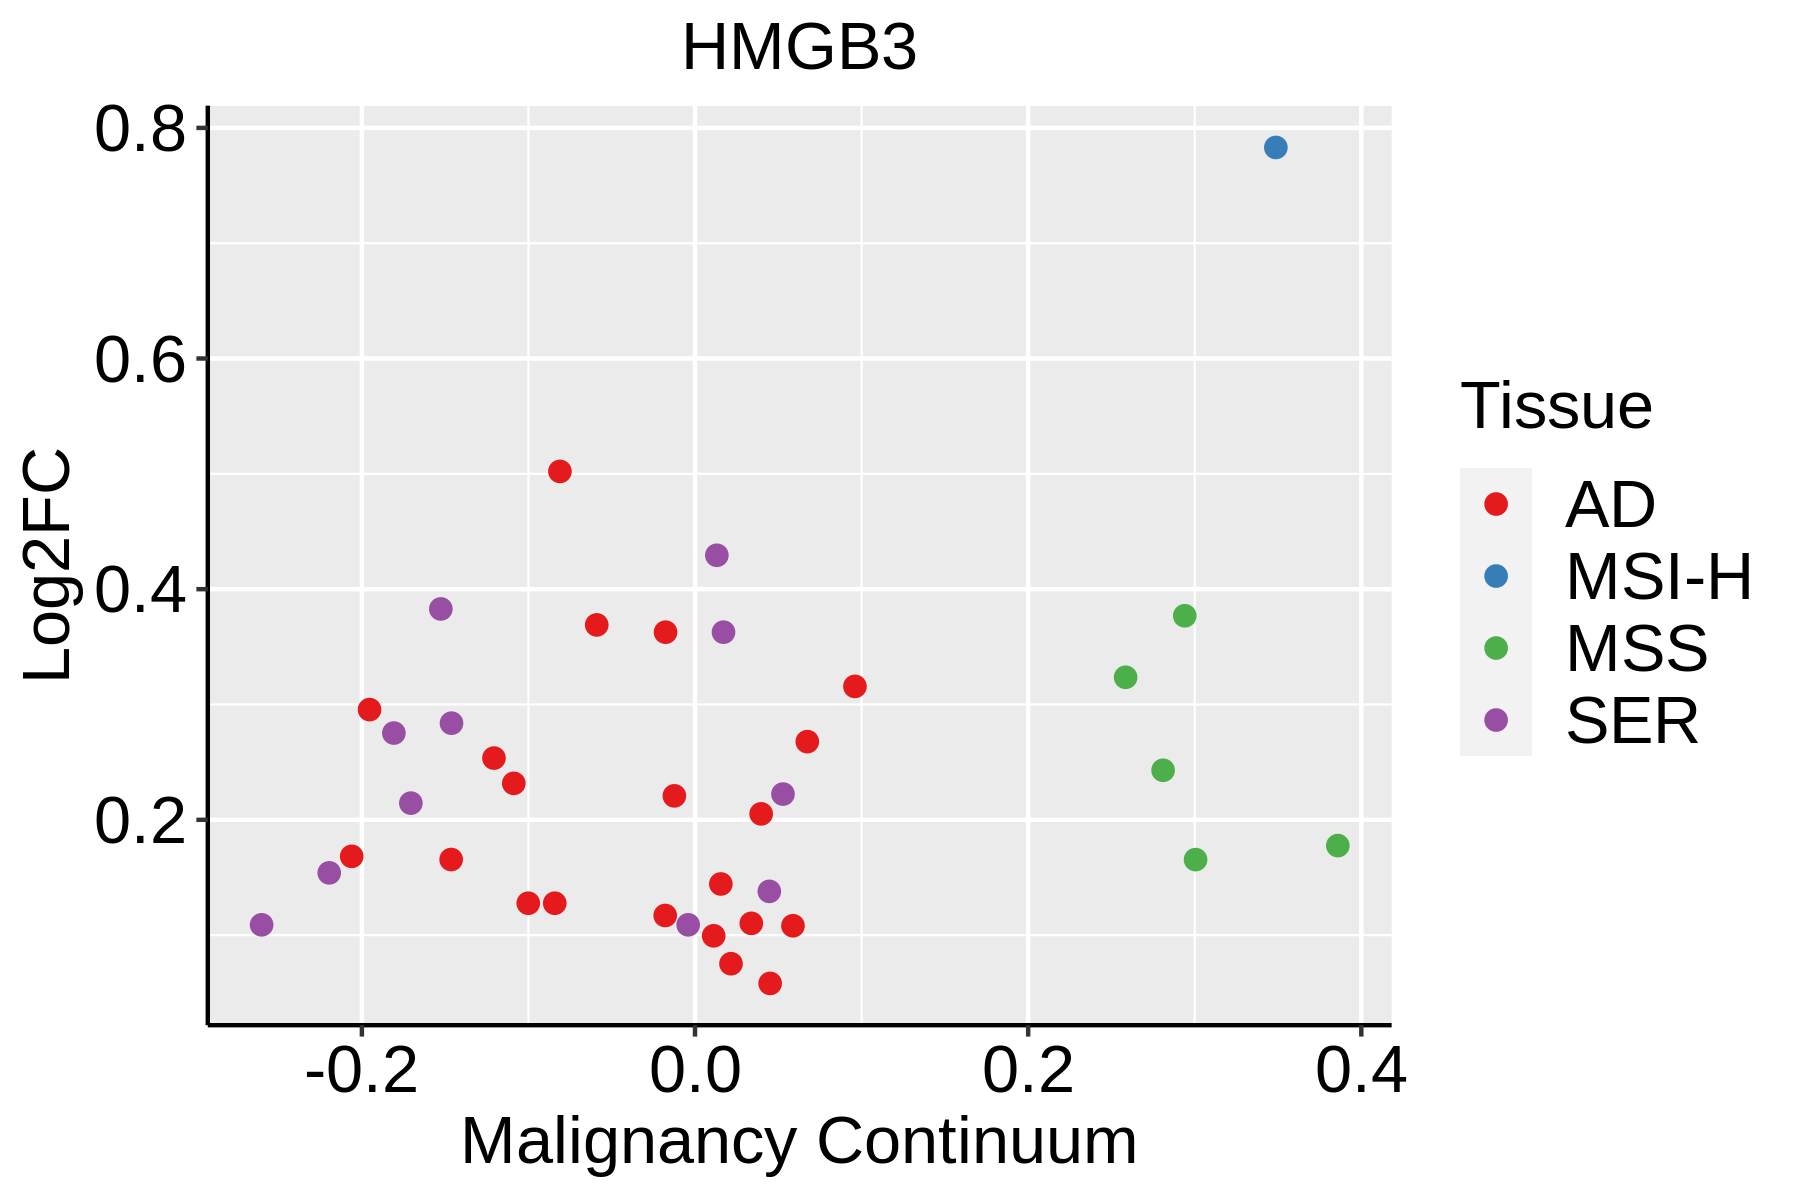 | AD: Adenomas |
| SER: Sessile serrated lesions | ||
| MSI-H: Microsatellite-high colorectal cancer | ||
| MSS: Microsatellite stable colorectal cancer | ||
| Esophagus |  | ESCC: Esophageal squamous cell carcinoma |
| HGIN: High-grade intraepithelial neoplasias | ||
| LGIN: Low-grade intraepithelial neoplasias | ||
| Liver | 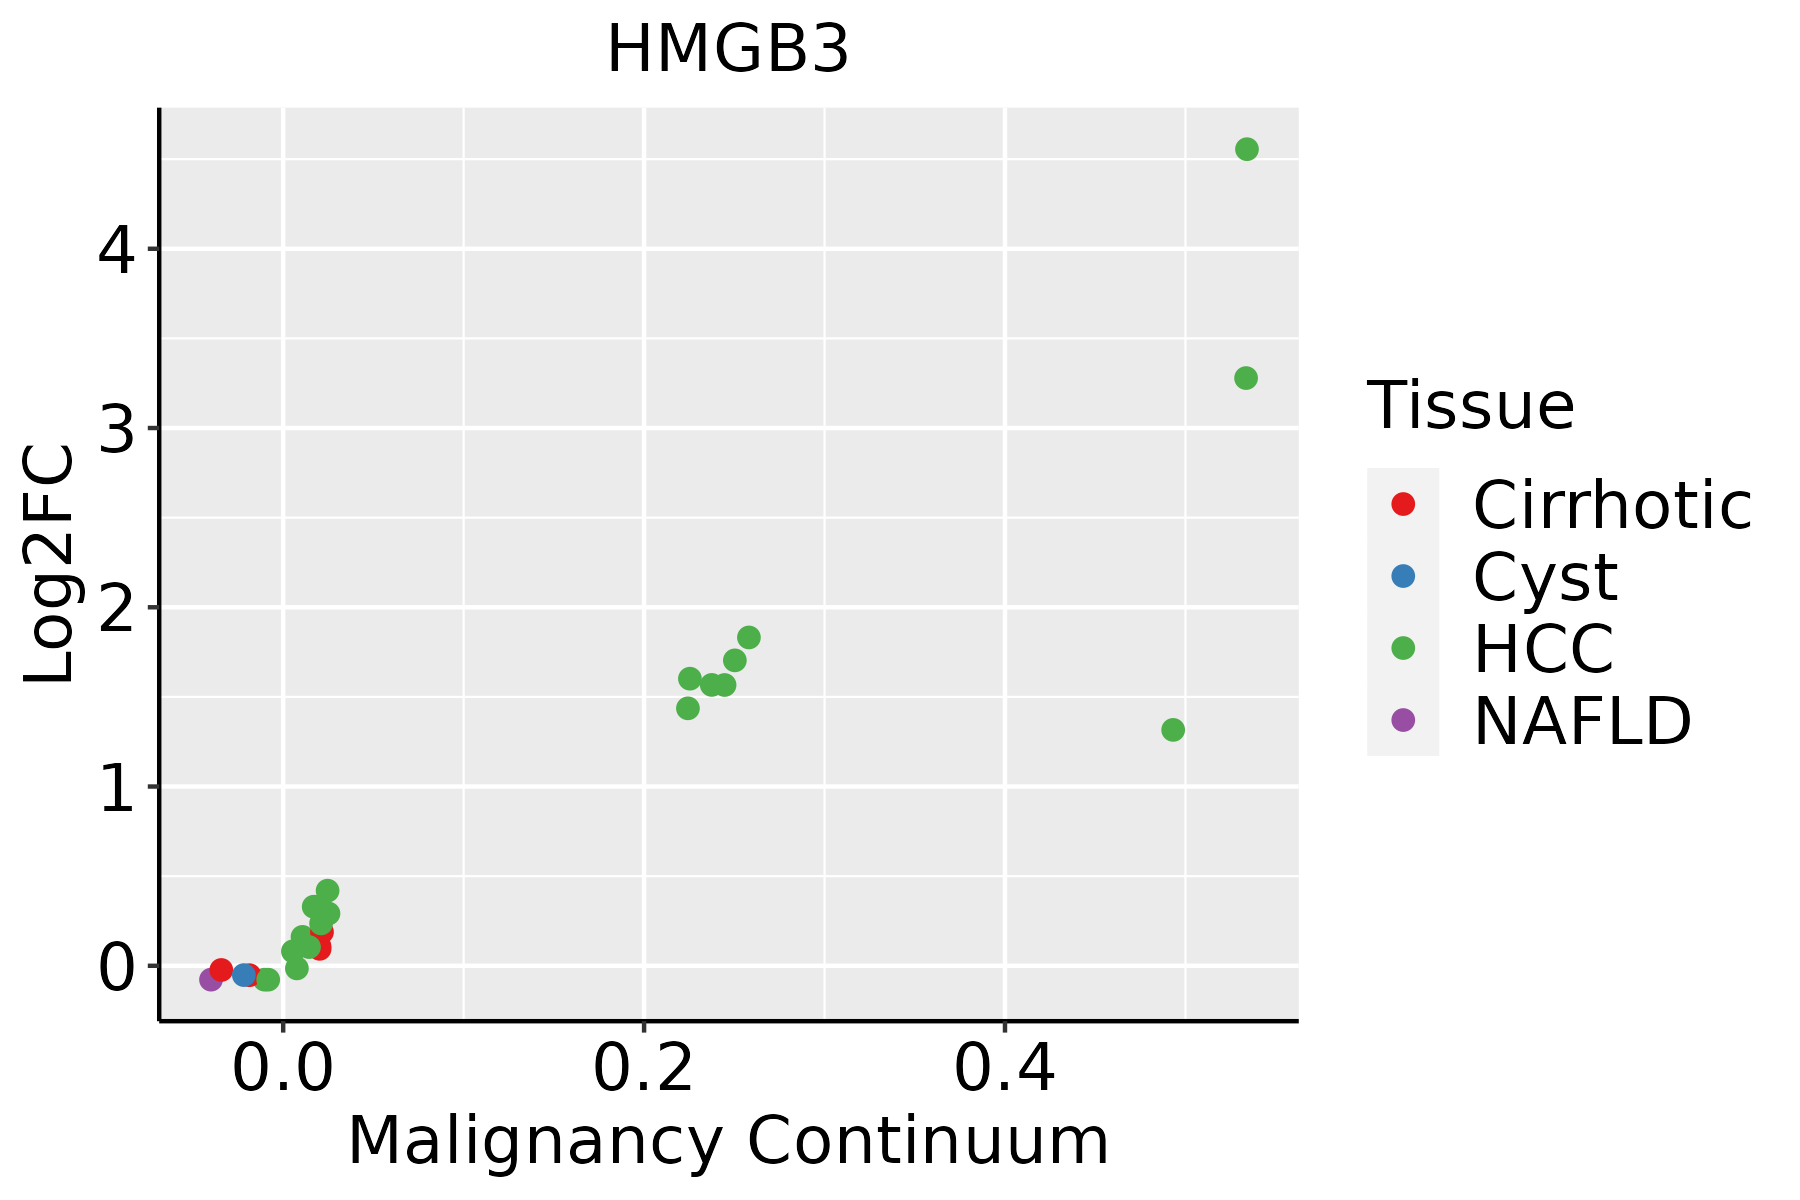 | HCC: Hepatocellular carcinoma |
| NAFLD: Non-alcoholic fatty liver disease | ||
| Oral Cavity | 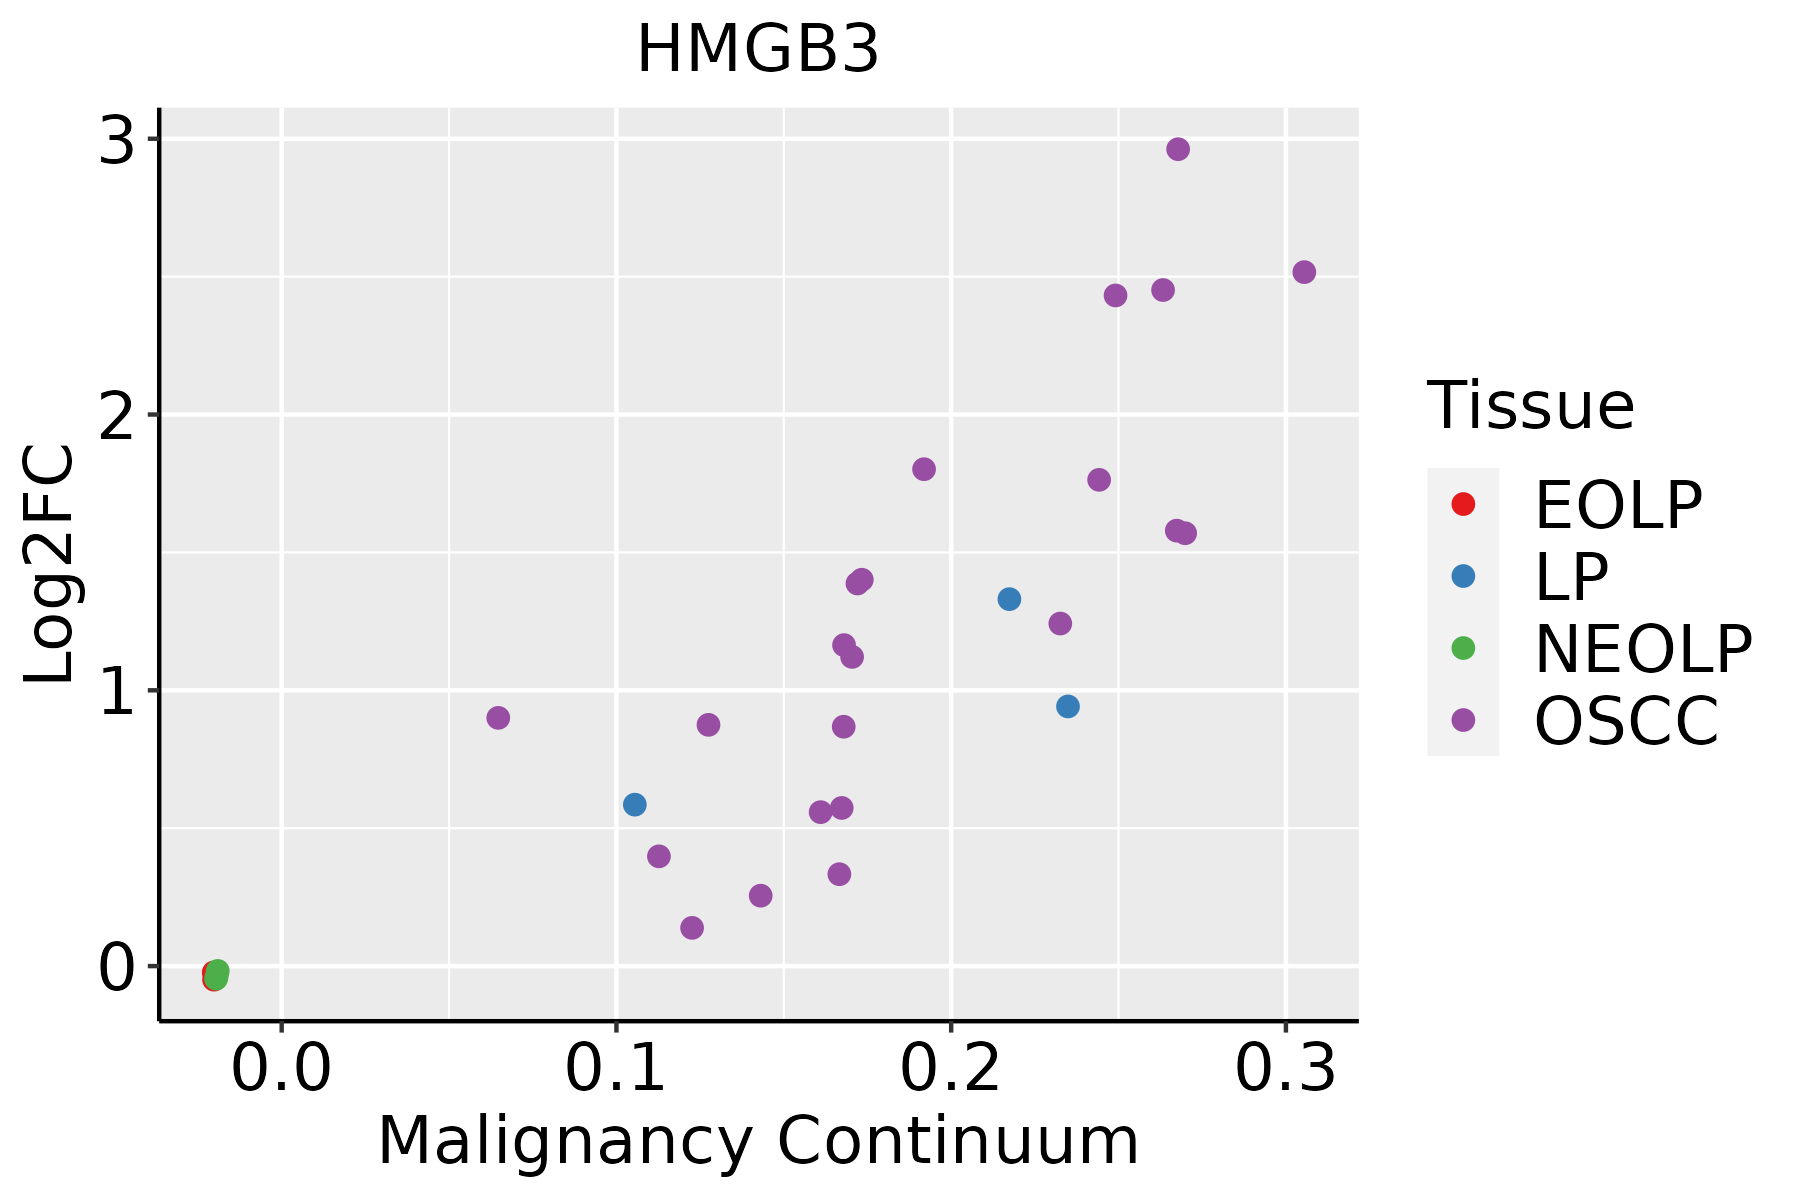 | EOLP: Erosive Oral lichen planus |
| LP: leukoplakia | ||
| NEOLP: Non-erosive oral lichen planus | ||
| OSCC: Oral squamous cell carcinoma | ||
| Skin |  | AK: Actinic keratosis |
| cSCC: Cutaneous squamous cell carcinoma | ||
| SCCIS:squamous cell carcinoma in situ | ||
| Thyroid |  | ATC: Anaplastic thyroid cancer |
| HT: Hashimoto's thyroiditis | ||
| PTC: Papillary thyroid cancer |
| ∗log2FC in expression of this searched gene in stem-like cells from each diseased tissue sample relative to stem-like cells in normal samples in each tissue plotted against the malignancy continuum. Samples are colored based on if they are from different disease stage. |
Top |
Malignant transformation related pathway analysis |
| Find out the enriched GO biological processes and KEGG pathways involved in transition from healthy to precancer to cancer |
| Tissue | Disease Stage | Enriched GO biological Processes |
| Colorectum | AD |  |
| Colorectum | SER |  |
| Colorectum | MSS |  |
| Colorectum | MSI-H |  |
| Colorectum | FAP |  |
| ∗Top 15 enriched GO BP terms are showed in the bar plot of each disease state in each tissue. Each row represents a significant GO biological process which is colored according to the -log10(p.adjust). |
| Page: 1 2 3 4 5 6 7 8 9 |
| GO ID | Tissue | Disease Stage | Description | Gene Ratio | Bg Ratio | pvalue | p.adjust | Count |
| GO:0032392 | Colorectum | AD | DNA geometric change | 31/3918 | 90/18723 | 2.02e-03 | 1.63e-02 | 31 |
| GO:00323921 | Colorectum | MSS | DNA geometric change | 29/3467 | 90/18723 | 1.26e-03 | 1.20e-02 | 29 |
| GO:00323926 | Esophagus | HGIN | DNA geometric change | 25/2587 | 90/18723 | 3.77e-04 | 5.85e-03 | 25 |
| GO:003239214 | Esophagus | ESCC | DNA geometric change | 62/8552 | 90/18723 | 7.02e-06 | 7.04e-05 | 62 |
| GO:00063101 | Esophagus | ESCC | DNA recombination | 168/8552 | 305/18723 | 5.58e-04 | 3.05e-03 | 168 |
| GO:003239211 | Liver | HCC | DNA geometric change | 54/7958 | 90/18723 | 6.04e-04 | 3.79e-03 | 54 |
| GO:00323925 | Oral cavity | OSCC | DNA geometric change | 59/7305 | 90/18723 | 3.03e-07 | 4.63e-06 | 59 |
| GO:0006310 | Oral cavity | OSCC | DNA recombination | 147/7305 | 305/18723 | 6.33e-04 | 3.56e-03 | 147 |
| GO:003239213 | Oral cavity | LP | DNA geometric change | 33/4623 | 90/18723 | 7.51e-03 | 4.15e-02 | 33 |
| GO:00323927 | Skin | AK | DNA geometric change | 23/1910 | 90/18723 | 2.53e-05 | 4.54e-04 | 23 |
| GO:0071103 | Skin | AK | DNA conformation change | 47/1910 | 290/18723 | 9.43e-04 | 7.61e-03 | 47 |
| GO:003239215 | Skin | cSCC | DNA geometric change | 44/4864 | 90/18723 | 2.53e-06 | 4.06e-05 | 44 |
| GO:00711031 | Skin | cSCC | DNA conformation change | 96/4864 | 290/18723 | 3.87e-03 | 2.07e-02 | 96 |
| GO:00323928 | Thyroid | PTC | DNA geometric change | 41/5968 | 90/18723 | 4.47e-03 | 2.11e-02 | 41 |
| GO:003239216 | Thyroid | ATC | DNA geometric change | 42/6293 | 90/18723 | 6.81e-03 | 2.70e-02 | 42 |
| Page: 1 |
| Pathway ID | Tissue | Disease Stage | Description | Gene Ratio | Bg Ratio | pvalue | p.adjust | qvalue | Count |
| Page: 1 |
Top |
Cell-cell communication analysis |
| Identification of potential cell-cell interactions between two cell types and their ligand-receptor pairs for different disease states |
| Ligand | Receptor | LRpair | Pathway | Tissue | Disease Stage |
| Page: 1 |
Top |
Single-cell gene regulatory network inference analysis |
| Find out the significant the regulons (TFs) and the target genes of each regulon across cell types for different disease states |
| TF | Cell Type | Tissue | Disease Stage | Target Gene | RSS | Regulon Activity |
| HMGB3 | MLUM | Breast | Healthy | NAMPT,CALM2,SERPINA1, etc. | 3.90e-01 |  |
| HMGB3 | CD8TEREX | Cervix | CC | HMGB2,UBE2C,PTTG1, etc. | 7.49e-02 |  |
| HMGB3 | CD8TEREX | Cervix | N_HPV | HMGB2,UBE2C,PTTG1, etc. | 4.43e-02 |  |
| HMGB3 | CD8TEX | Endometrium | ADJ | CCNB1,HMGB2,UBE2C, etc. | 2.14e-01 |  |
| HMGB3 | CD8TEX | Endometrium | AEH | CCNB1,HMGB2,UBE2C, etc. | 2.16e-01 |  |
| HMGB3 | TH1 | Endometrium | AEH | CCNB1,HMGB2,UBE2C, etc. | 1.28e-02 | |
| HMGB3 | CD8TEFF | Endometrium | AEH | CCNB1,HMGB2,UBE2C, etc. | 8.42e-03 | |
| HMGB3 | CD8TEX | Endometrium | EEC | CCNB1,HMGB2,UBE2C, etc. | 2.26e-01 |  |
| HMGB3 | CD8TEX | Endometrium | Healthy | CCNB1,HMGB2,UBE2C, etc. | 3.55e-01 |  |
| HMGB3 | INMON | Esophagus | ADJ | RAB20,JMJD1C-AS1,SERF2, etc. | 4.13e-02 |  |
| ∗The dot plots of a searched regulon are shown for all cell subpopulations in each disease state of each tissue based on the regulon specific score inferred using pySCENIC and by calculating the average expression. |
| Page: 1 2 3 4 |
Top |
Somatic mutation of malignant transformation related genes |
| Annotation of somatic variants for genes involved in malignant transformation |
| Hugo Symbol | Variant Class | Variant Classification | dbSNP RS | HGVSc | HGVSp | HGVSp Short | SWISSPROT | BIOTYPE | SIFT | PolyPhen | Tumor Sample Barcode | Tissue | Histology | Sex | Age | Stage | Therapy Types | Drugs | Outcome |
| HMGB3 | SNV | Missense_Mutation | c.465N>T | p.Lys155Asn | p.K155N | O15347 | protein_coding | deleterious(0.01) | benign(0.352) | TCGA-A7-A26E-01 | Breast | breast invasive carcinoma | Female | >=65 | III/IV | Chemotherapy | cytoxan | SD | |
| HMGB3 | SNV | Missense_Mutation | novel | c.598N>A | p.Glu200Lys | p.E200K | O15347 | protein_coding | deleterious_low_confidence(0.01) | benign(0.003) | TCGA-BH-A0B6-01 | Breast | breast invasive carcinoma | Female | <65 | I/II | Unknown | Unknown | SD |
| HMGB3 | SNV | Missense_Mutation | novel | c.111N>G | p.Asn37Lys | p.N37K | O15347 | protein_coding | deleterious(0.04) | probably_damaging(0.915) | TCGA-AG-3726-01 | Colorectum | rectum adenocarcinoma | Female | <65 | I/II | Unknown | Unknown | SD |
| HMGB3 | SNV | Missense_Mutation | c.316G>A | p.Glu106Lys | p.E106K | O15347 | protein_coding | deleterious(0.03) | benign(0.198) | TCGA-AG-A01W-01 | Colorectum | rectum adenocarcinoma | Female | >=65 | I/II | Chemotherapy | 5-fluorouracil | CR | |
| HMGB3 | SNV | Missense_Mutation | rs782427760 | c.530N>A | p.Arg177Gln | p.R177Q | O15347 | protein_coding | tolerated(0.46) | benign(0.001) | TCGA-A5-A2K5-01 | Endometrium | uterine corpus endometrioid carcinoma | Female | >=65 | I/II | Unknown | Unknown | SD |
| HMGB3 | SNV | Missense_Mutation | novel | c.54N>A | p.Phe18Leu | p.F18L | O15347 | protein_coding | deleterious(0.02) | benign(0.042) | TCGA-AJ-A5DW-01 | Endometrium | uterine corpus endometrioid carcinoma | Female | <65 | I/II | Unknown | Unknown | SD |
| HMGB3 | SNV | Missense_Mutation | novel | c.203N>C | p.Lys68Thr | p.K68T | O15347 | protein_coding | deleterious(0.01) | probably_damaging(0.976) | TCGA-AJ-A5DW-01 | Endometrium | uterine corpus endometrioid carcinoma | Female | <65 | I/II | Unknown | Unknown | SD |
| HMGB3 | SNV | Missense_Mutation | c.64N>G | p.Thr22Ala | p.T22A | O15347 | protein_coding | deleterious(0.03) | benign(0.166) | TCGA-AX-A05Z-01 | Endometrium | uterine corpus endometrioid carcinoma | Female | <65 | III/IV | Chemotherapy | adriamycin | SD | |
| HMGB3 | SNV | Missense_Mutation | c.199N>T | p.Asp67Tyr | p.D67Y | O15347 | protein_coding | deleterious(0.01) | possibly_damaging(0.764) | TCGA-B5-A0JY-01 | Endometrium | uterine corpus endometrioid carcinoma | Female | <65 | III/IV | Chemotherapy | doxorubicin | SD | |
| HMGB3 | SNV | Missense_Mutation | c.436N>A | p.Ala146Thr | p.A146T | O15347 | protein_coding | deleterious(0.03) | benign(0.198) | TCGA-B5-A11E-01 | Endometrium | uterine corpus endometrioid carcinoma | Female | <65 | I/II | Unknown | Unknown | SD |
| Page: 1 2 3 |
Top |
Related drugs of malignant transformation related genes |
| Identification of chemicals and drugs interact with genes involved in malignant transfromation |
| (DGIdb 4.0) |
| Entrez ID | Symbol | Category | Interaction Types | Drug Claim Name | Drug Name | PMIDs |
| Page: 1 |

Copyright 2023-Present -The University of Texas Health Science Center at Houston |