
|
|||||
|
 | |
| |
| |
| |
| |
| |
|
Gene: HMGB2 |
Gene summary for HMGB2 |
| Gene information | Species | Human | Gene symbol | HMGB2 | Gene ID | 3148 |
| Gene name | high mobility group box 2 | |
| Gene Alias | HMG2 | |
| Cytomap | 4q34.1 | |
| Gene Type | protein-coding | GO ID | GO:0000003 | UniProtAcc | P26583 |
Top |
Malignant transformation analysis |
| Identification of the aberrant gene expression in precancerous and cancerous lesions by comparing the gene expression of stem-like cells in diseased tissues with normal stem cells |
| Entrez ID | Symbol | Replicates | Species | Organ | Tissue | Adj P-value | Log2FC | Malignancy |
| 3148 | HMGB2 | GSM4909281 | Human | Breast | IDC | 1.18e-16 | 6.36e-01 | 0.21 |
| 3148 | HMGB2 | GSM4909282 | Human | Breast | IDC | 9.01e-55 | 1.01e+00 | -0.0288 |
| 3148 | HMGB2 | GSM4909285 | Human | Breast | IDC | 4.84e-05 | 4.14e-01 | 0.21 |
| 3148 | HMGB2 | GSM4909286 | Human | Breast | IDC | 1.22e-05 | 4.17e-01 | 0.1081 |
| 3148 | HMGB2 | GSM4909288 | Human | Breast | IDC | 9.78e-03 | -1.12e-01 | 0.0988 |
| 3148 | HMGB2 | GSM4909293 | Human | Breast | IDC | 2.36e-06 | -3.13e-01 | 0.1581 |
| 3148 | HMGB2 | GSM4909294 | Human | Breast | IDC | 5.56e-06 | -2.42e-01 | 0.2022 |
| 3148 | HMGB2 | GSM4909296 | Human | Breast | IDC | 1.31e-12 | -5.81e-02 | 0.1524 |
| 3148 | HMGB2 | GSM4909297 | Human | Breast | IDC | 2.63e-13 | -7.55e-02 | 0.1517 |
| 3148 | HMGB2 | GSM4909302 | Human | Breast | IDC | 2.74e-02 | -2.05e-01 | 0.1545 |
| 3148 | HMGB2 | GSM4909307 | Human | Breast | IDC | 1.77e-02 | -1.48e-01 | 0.1569 |
| 3148 | HMGB2 | GSM4909311 | Human | Breast | IDC | 9.15e-23 | -3.95e-01 | 0.1534 |
| 3148 | HMGB2 | GSM4909312 | Human | Breast | IDC | 9.47e-14 | -1.27e-01 | 0.1552 |
| 3148 | HMGB2 | GSM4909315 | Human | Breast | IDC | 1.00e-14 | -3.44e-01 | 0.21 |
| 3148 | HMGB2 | GSM4909318 | Human | Breast | IDC | 1.04e-05 | 4.24e-01 | 0.2031 |
| 3148 | HMGB2 | GSM4909319 | Human | Breast | IDC | 3.52e-41 | 1.68e-01 | 0.1563 |
| 3148 | HMGB2 | GSM4909320 | Human | Breast | IDC | 1.03e-06 | -4.86e-02 | 0.1575 |
| 3148 | HMGB2 | GSM4909321 | Human | Breast | IDC | 2.09e-10 | 4.69e-03 | 0.1559 |
| 3148 | HMGB2 | ctrl6 | Human | Breast | Precancer | 1.99e-03 | 4.19e-01 | -0.0061 |
| 3148 | HMGB2 | M2 | Human | Breast | IDC | 3.00e-13 | 6.30e-01 | 0.21 |
| Page: 1 2 3 4 5 6 7 8 |
| Tissue | Expression Dynamics | Abbreviation |
| Breast | 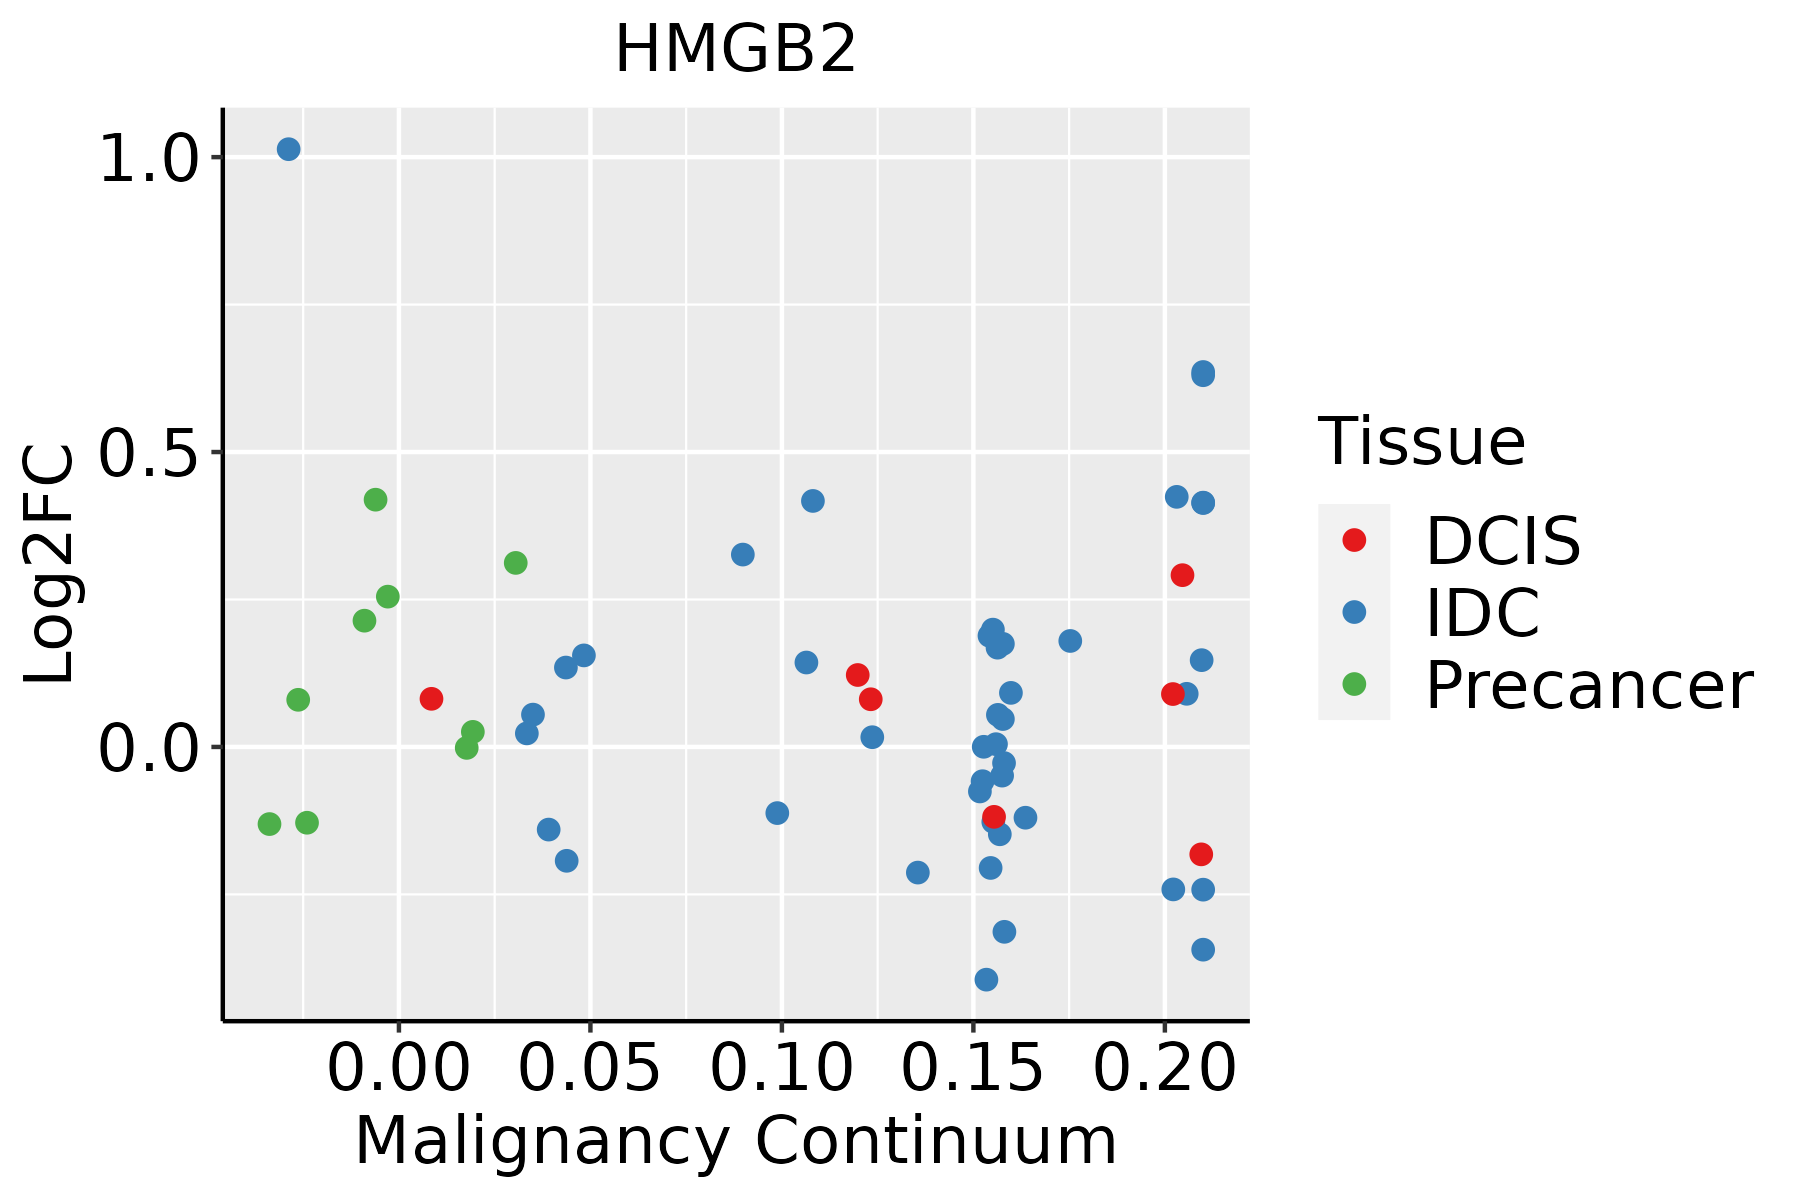 | IDC: Invasive ductal carcinoma |
| DCIS: Ductal carcinoma in situ | ||
| Precancer(BRCA1-mut): Precancerous lesion from BRCA1 mutation carriers | ||
| Cervix | 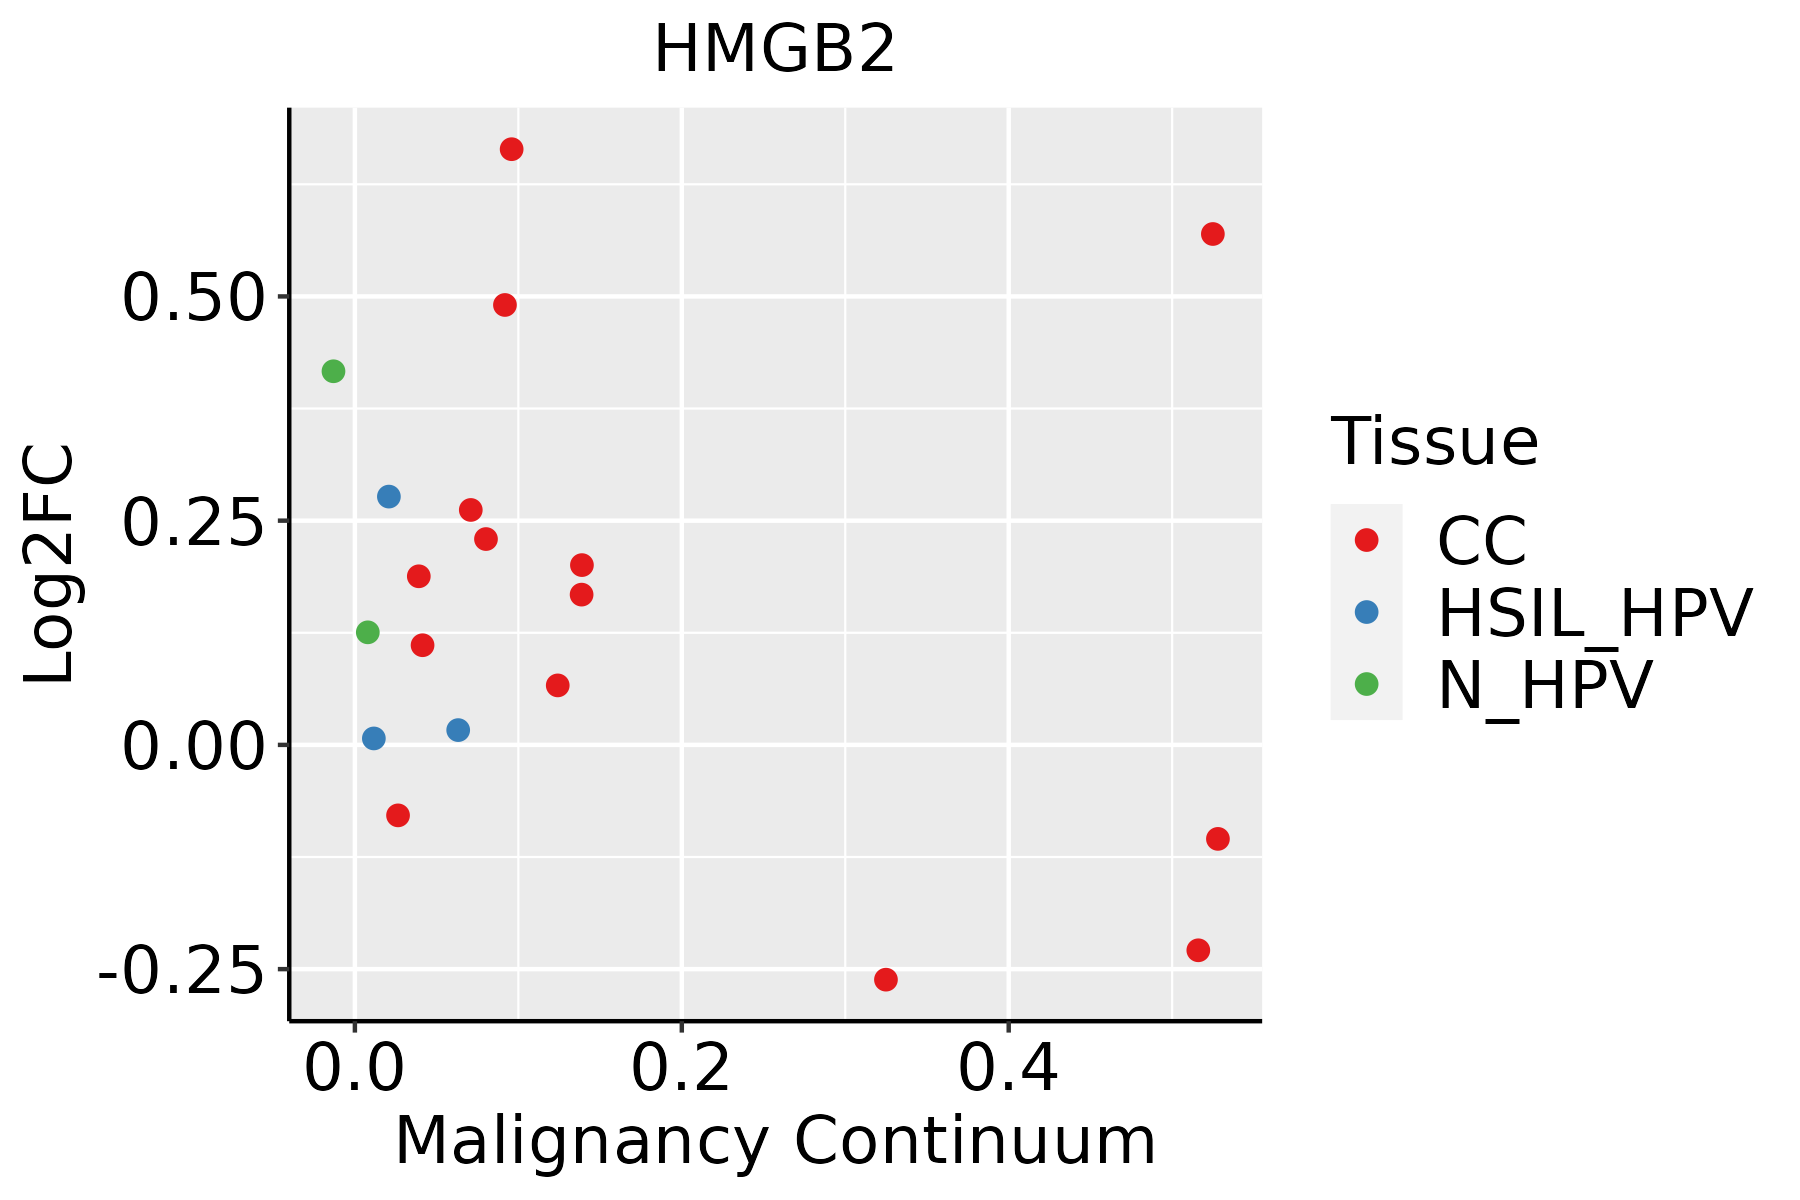 | CC: Cervix cancer |
| HSIL_HPV: HPV-infected high-grade squamous intraepithelial lesions | ||
| N_HPV: HPV-infected normal cervix | ||
| Colorectum (GSE201348) |  | FAP: Familial adenomatous polyposis |
| CRC: Colorectal cancer | ||
| Colorectum (HTA11) |  | AD: Adenomas |
| SER: Sessile serrated lesions | ||
| MSI-H: Microsatellite-high colorectal cancer | ||
| MSS: Microsatellite stable colorectal cancer | ||
| Esophagus |  | ESCC: Esophageal squamous cell carcinoma |
| HGIN: High-grade intraepithelial neoplasias | ||
| LGIN: Low-grade intraepithelial neoplasias | ||
| Liver | 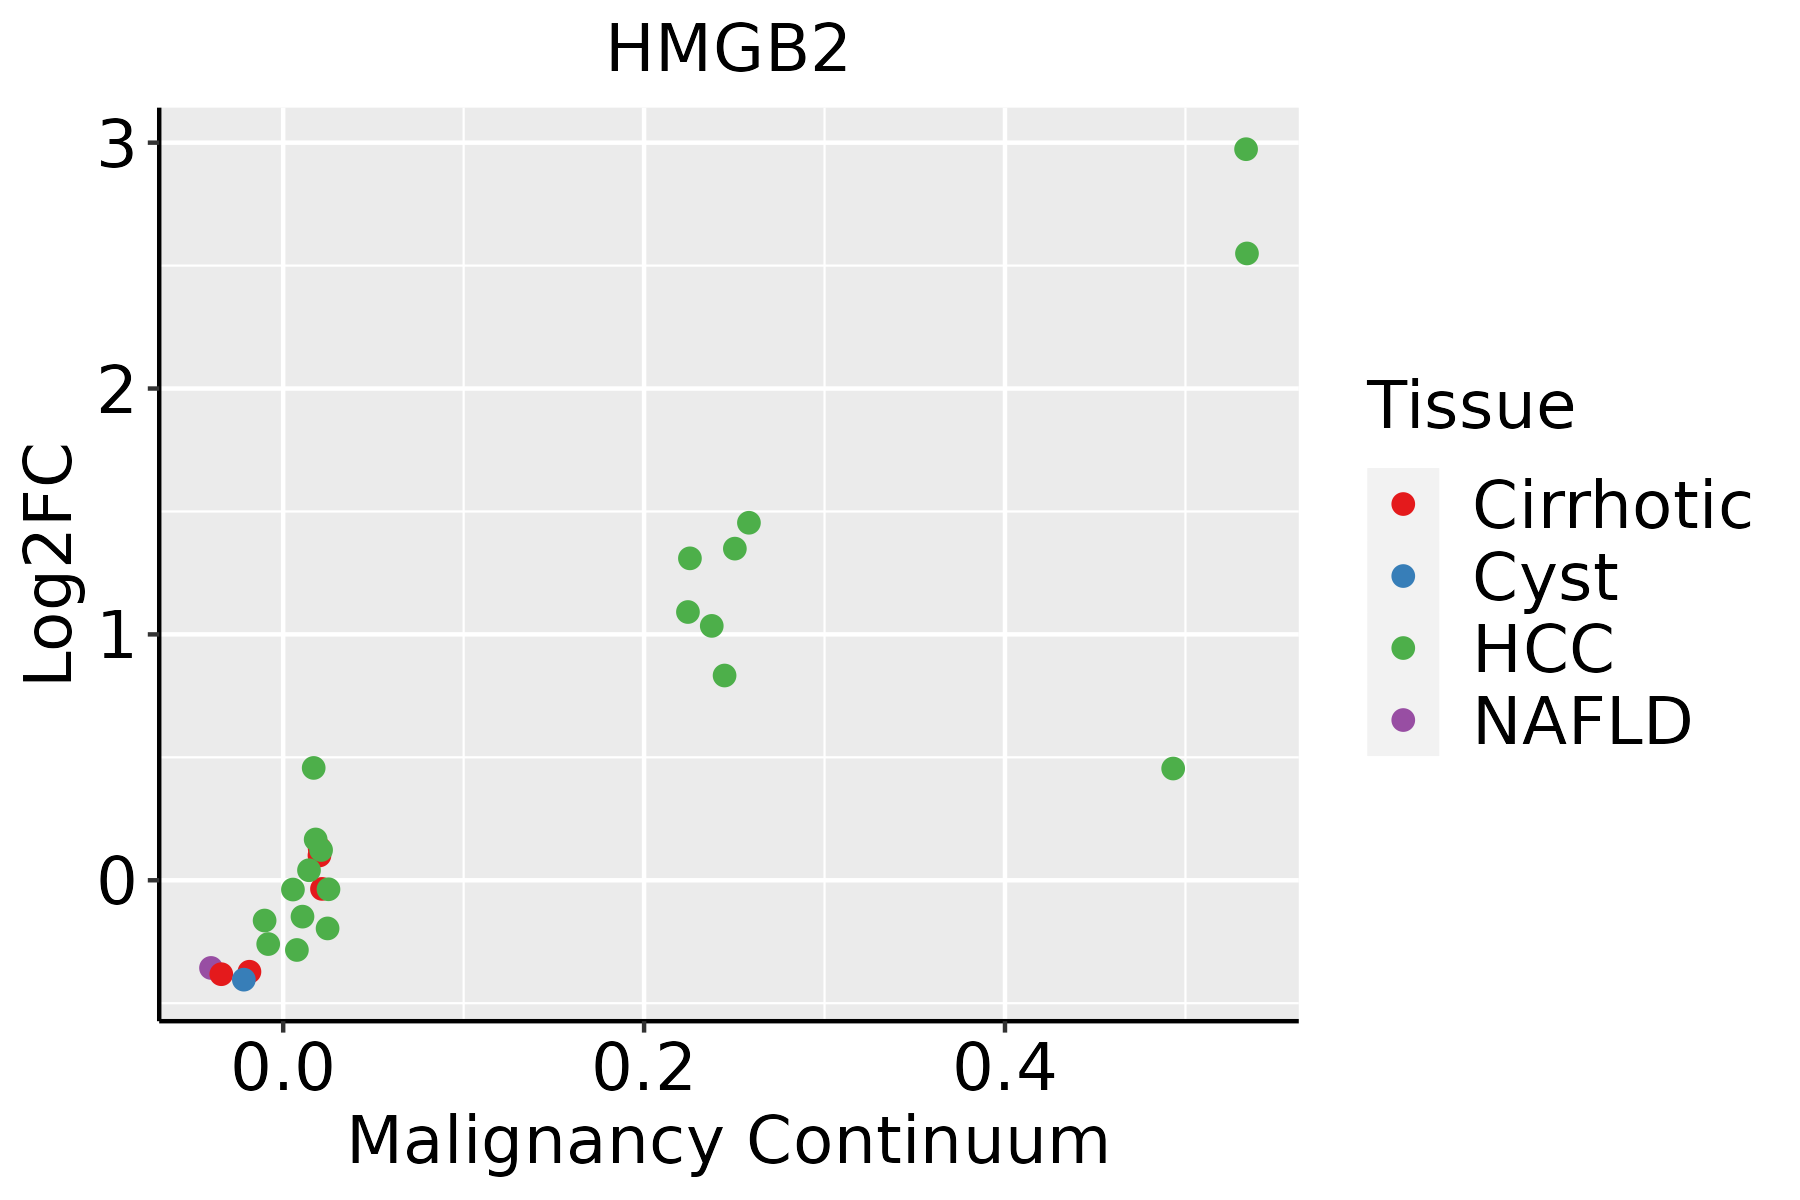 | HCC: Hepatocellular carcinoma |
| NAFLD: Non-alcoholic fatty liver disease | ||
| Oral Cavity | 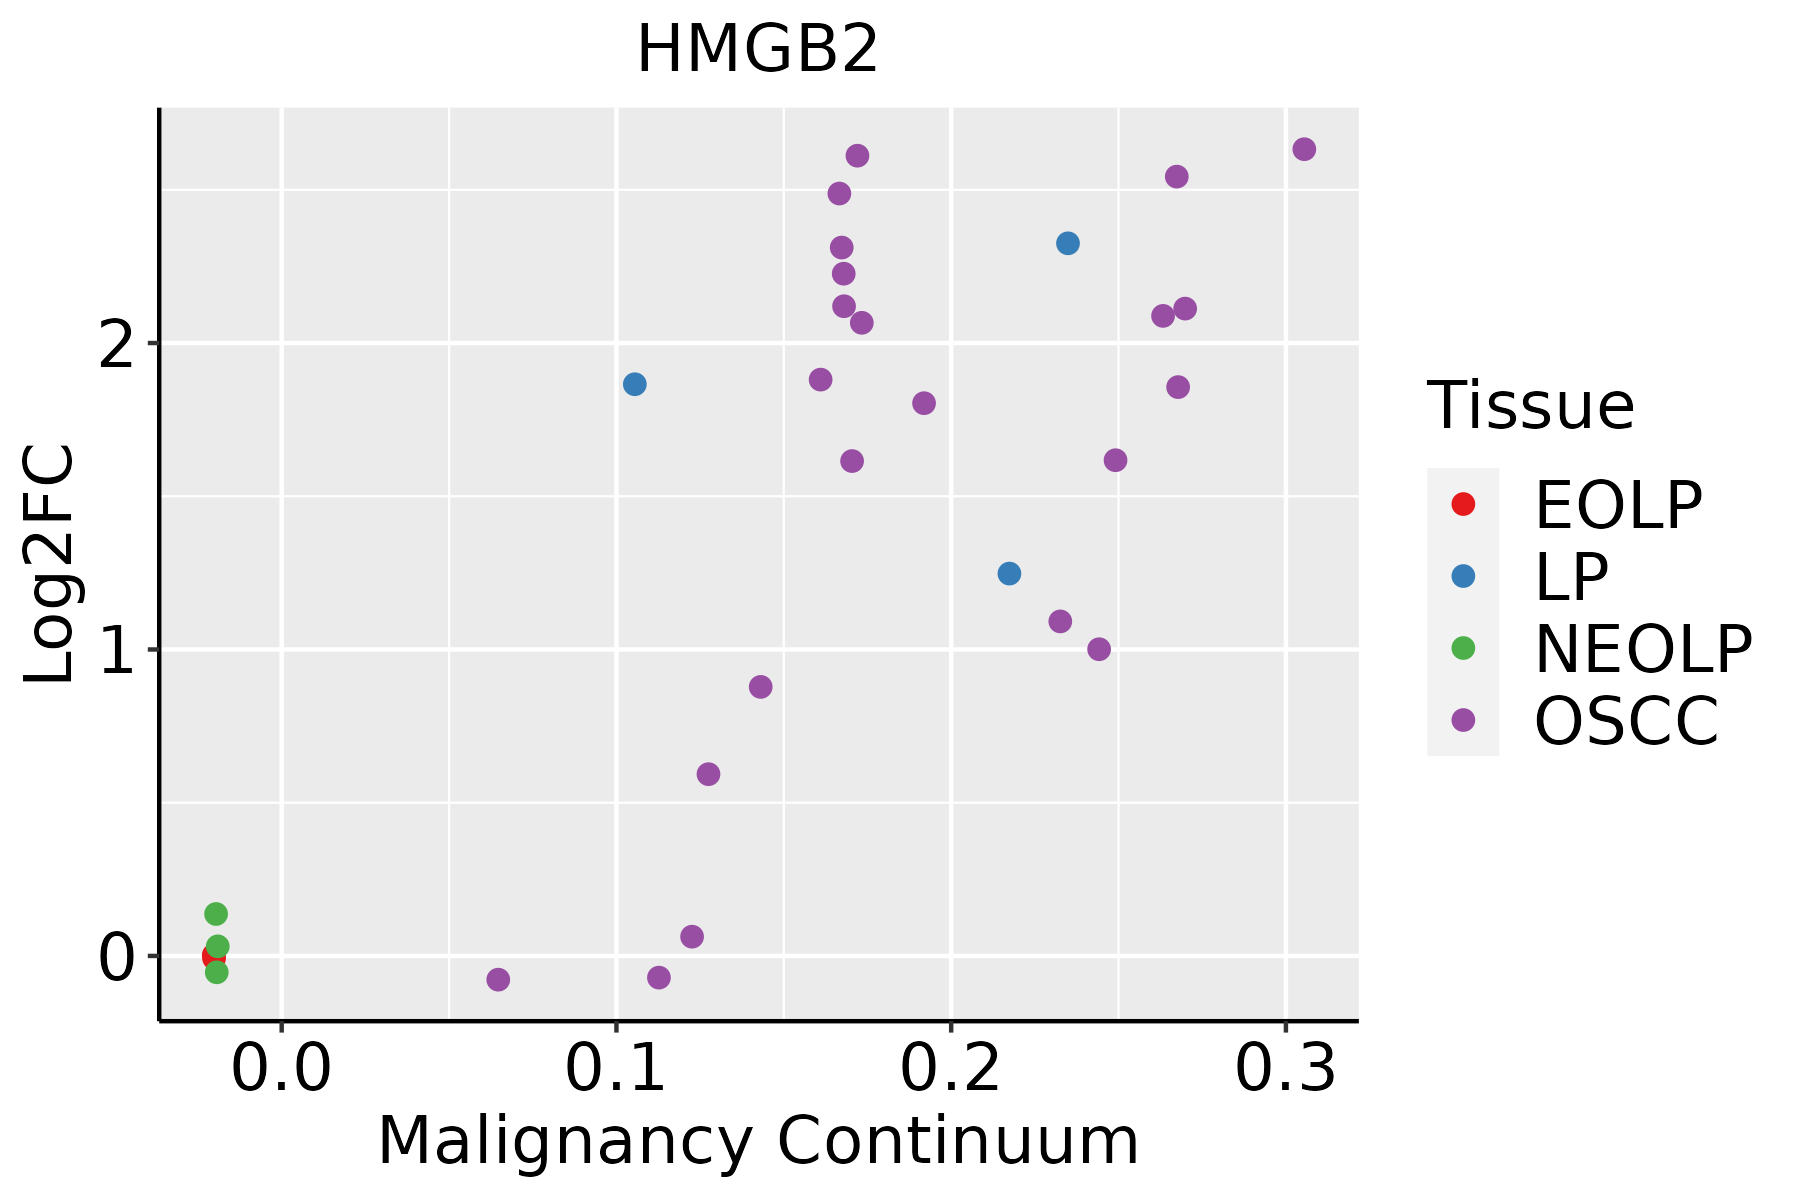 | EOLP: Erosive Oral lichen planus |
| LP: leukoplakia | ||
| NEOLP: Non-erosive oral lichen planus | ||
| OSCC: Oral squamous cell carcinoma | ||
| Skin | 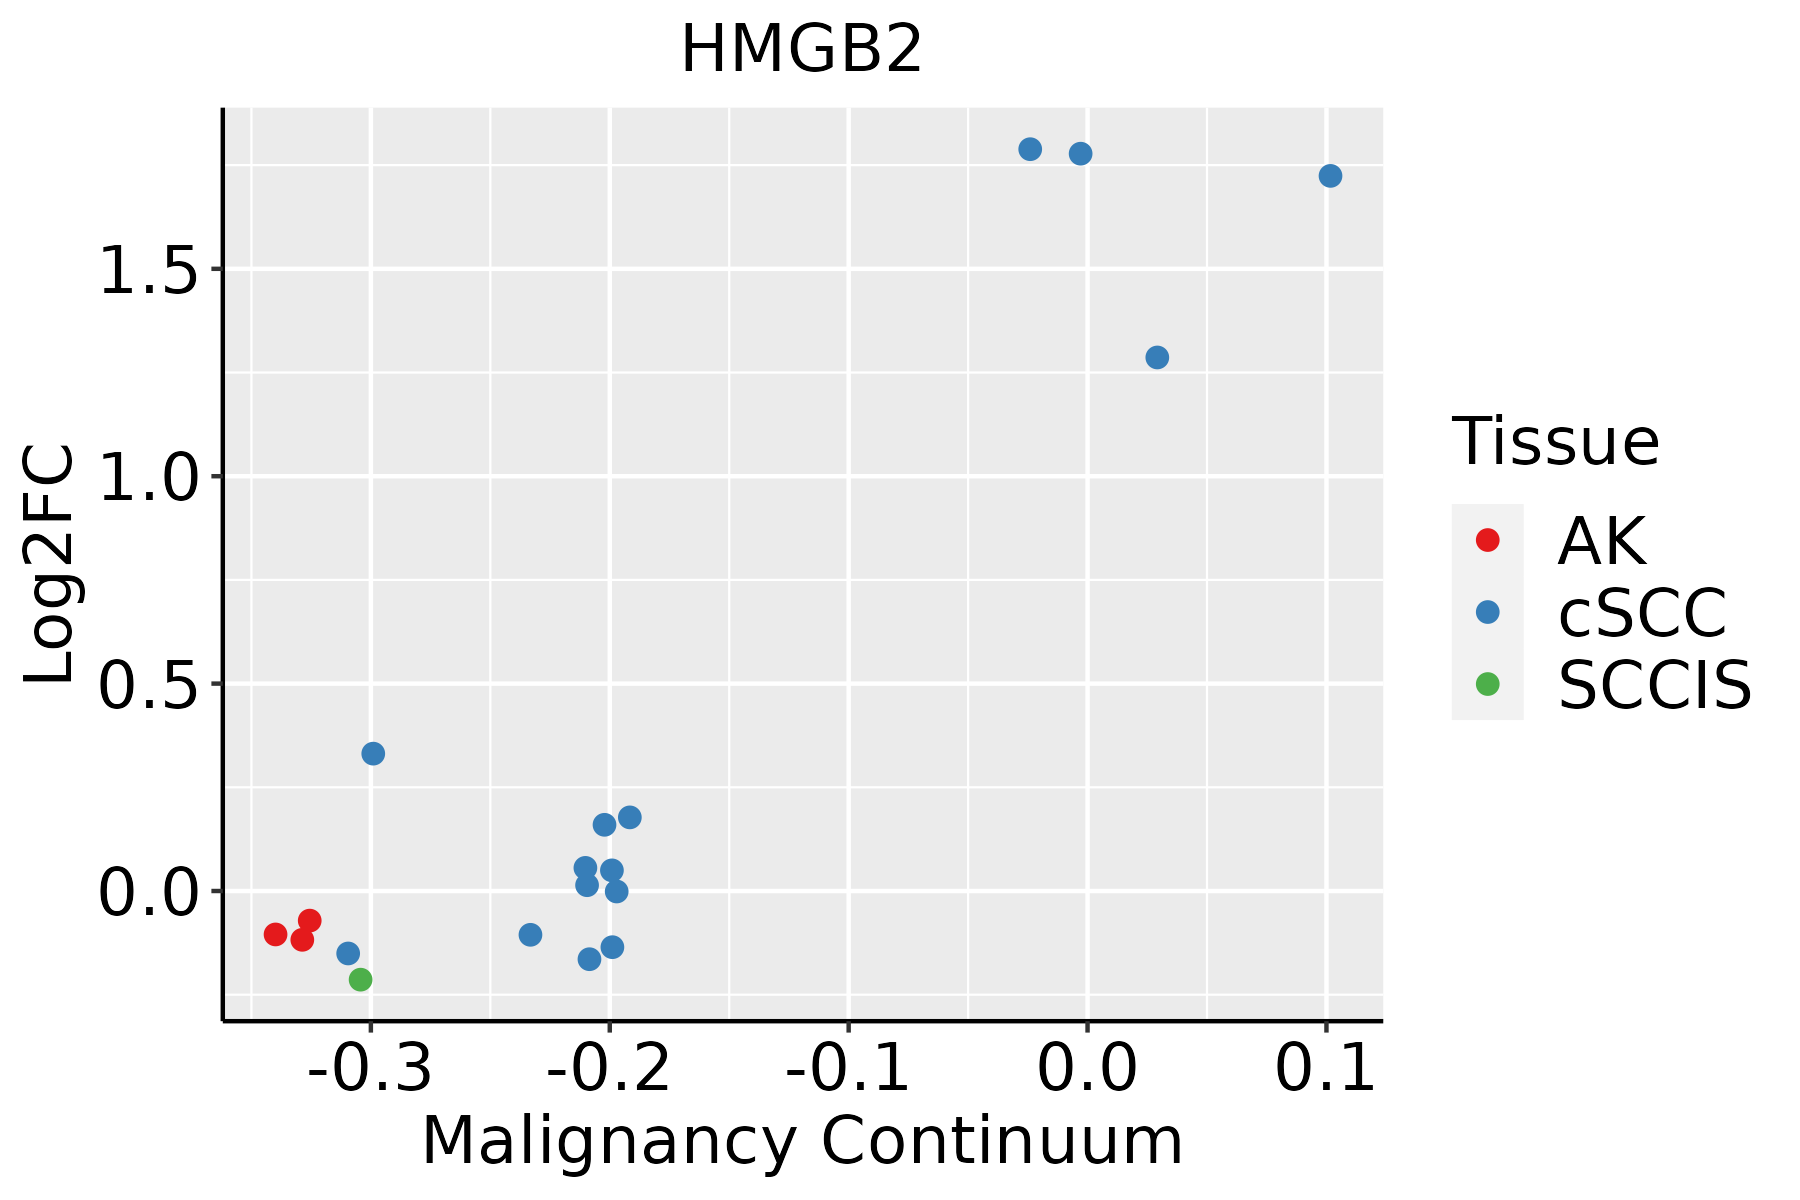 | AK: Actinic keratosis |
| cSCC: Cutaneous squamous cell carcinoma | ||
| SCCIS:squamous cell carcinoma in situ | ||
| Thyroid | 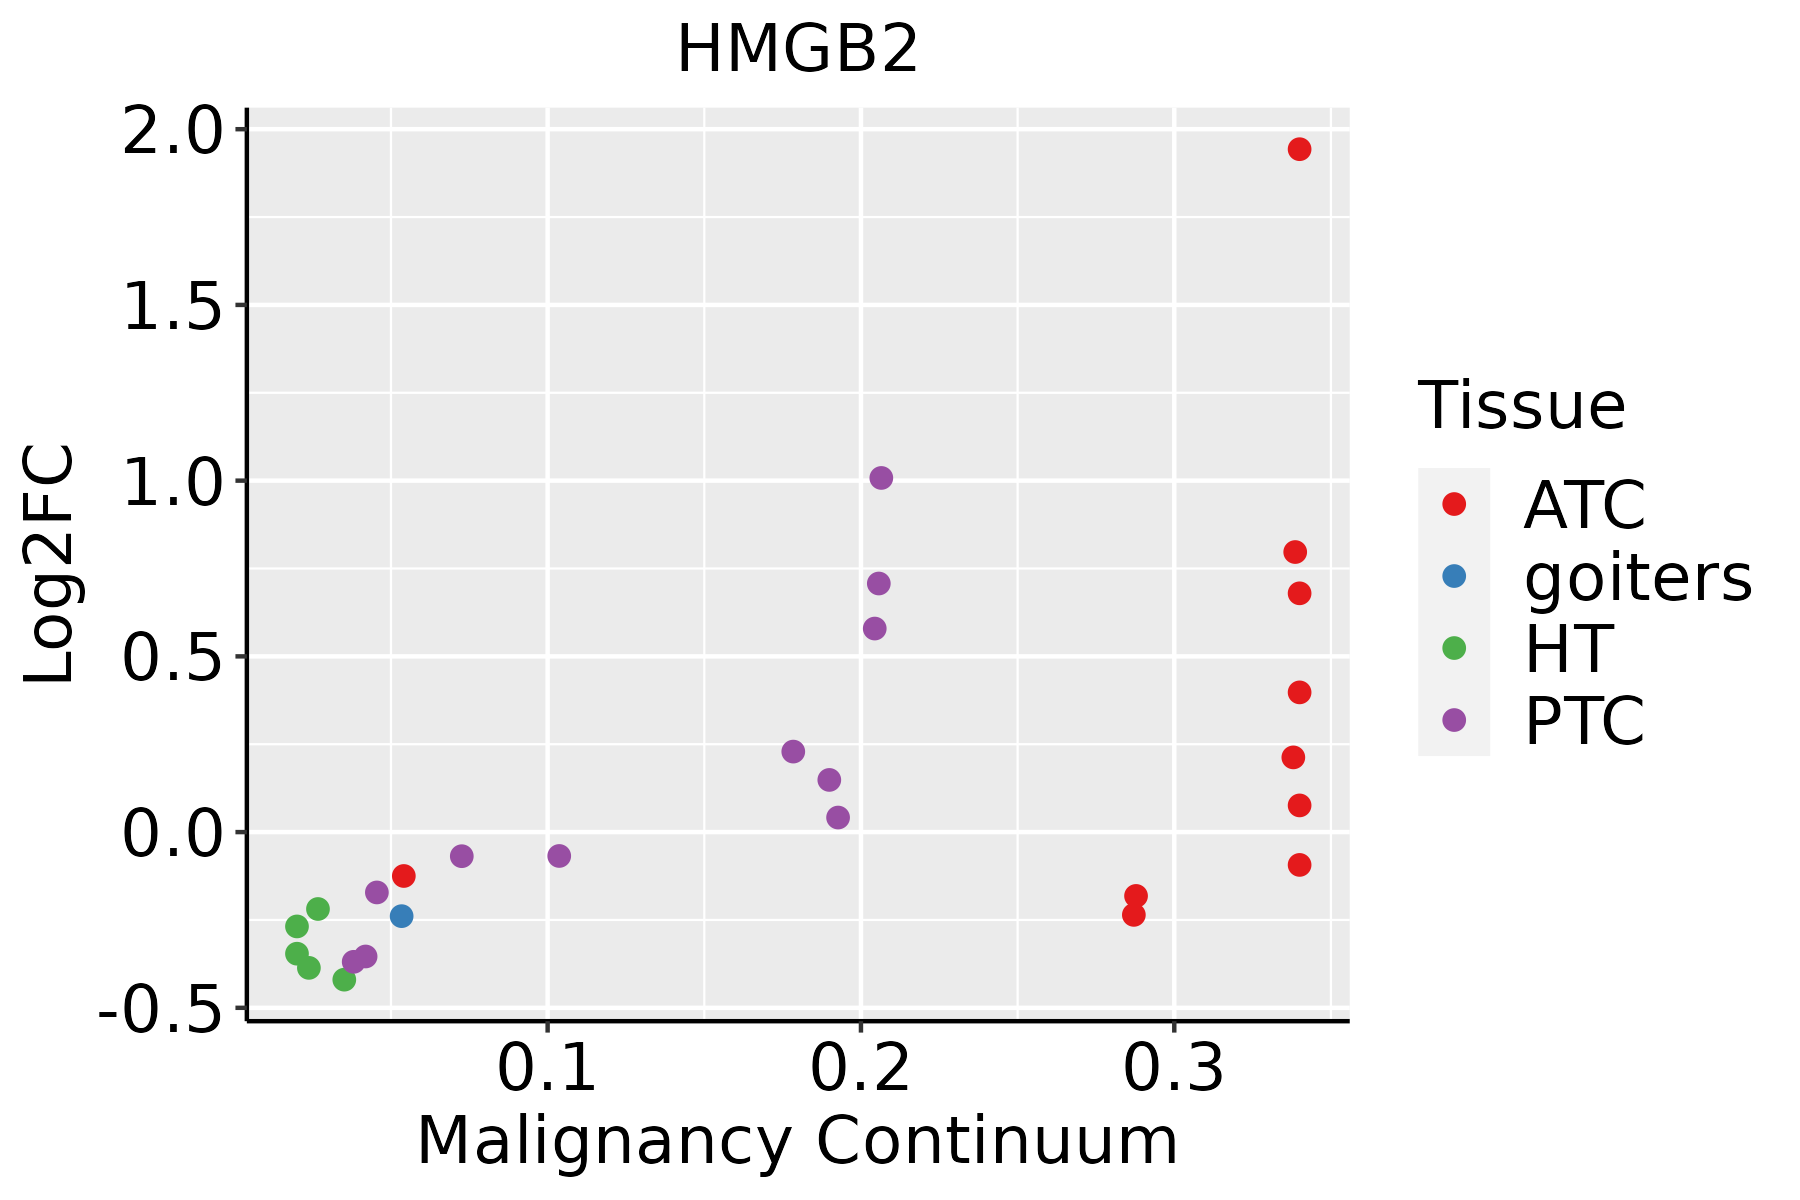 | ATC: Anaplastic thyroid cancer |
| HT: Hashimoto's thyroiditis | ||
| PTC: Papillary thyroid cancer |
| ∗log2FC in expression of this searched gene in stem-like cells from each diseased tissue sample relative to stem-like cells in normal samples in each tissue plotted against the malignancy continuum. Samples are colored based on if they are from different disease stage. |
Top |
Malignant transformation related pathway analysis |
| Find out the enriched GO biological processes and KEGG pathways involved in transition from healthy to precancer to cancer |
| Tissue | Disease Stage | Enriched GO biological Processes |
| Colorectum | AD |  |
| Colorectum | SER |  |
| Colorectum | MSS |  |
| Colorectum | MSI-H |  |
| Colorectum | FAP |  |
| ∗Top 15 enriched GO BP terms are showed in the bar plot of each disease state in each tissue. Each row represents a significant GO biological process which is colored according to the -log10(p.adjust). |
| Page: 1 2 3 4 5 6 7 8 9 |
| GO ID | Tissue | Disease Stage | Description | Gene Ratio | Bg Ratio | pvalue | p.adjust | Count |
| GO:20012339 | Breast | Precancer | regulation of apoptotic signaling pathway | 65/1080 | 356/18723 | 7.70e-17 | 3.17e-14 | 65 |
| GO:00485459 | Breast | Precancer | response to steroid hormone | 53/1080 | 339/18723 | 3.07e-11 | 3.66e-09 | 53 |
| GO:20012349 | Breast | Precancer | negative regulation of apoptotic signaling pathway | 39/1080 | 224/18723 | 5.35e-10 | 4.77e-08 | 39 |
| GO:00022629 | Breast | Precancer | myeloid cell homeostasis | 27/1080 | 157/18723 | 3.10e-07 | 1.49e-05 | 27 |
| GO:00603266 | Breast | Precancer | cell chemotaxis | 41/1080 | 310/18723 | 5.99e-07 | 2.55e-05 | 41 |
| GO:00511019 | Breast | Precancer | regulation of DNA binding | 22/1080 | 118/18723 | 9.28e-07 | 3.71e-05 | 22 |
| GO:00341019 | Breast | Precancer | erythrocyte homeostasis | 23/1080 | 129/18723 | 1.20e-06 | 4.60e-05 | 23 |
| GO:00433887 | Breast | Precancer | positive regulation of DNA binding | 14/1080 | 56/18723 | 2.46e-06 | 8.35e-05 | 14 |
| GO:00510989 | Breast | Precancer | regulation of binding | 44/1080 | 363/18723 | 2.59e-06 | 8.65e-05 | 44 |
| GO:00300999 | Breast | Precancer | myeloid cell differentiation | 45/1080 | 381/18723 | 4.00e-06 | 1.25e-04 | 45 |
| GO:00018196 | Breast | Precancer | positive regulation of cytokine production | 52/1080 | 467/18723 | 4.18e-06 | 1.29e-04 | 52 |
| GO:20012369 | Breast | Precancer | regulation of extrinsic apoptotic signaling pathway | 24/1080 | 151/18723 | 5.78e-06 | 1.70e-04 | 24 |
| GO:00022378 | Breast | Precancer | response to molecule of bacterial origin | 43/1080 | 363/18723 | 6.05e-06 | 1.72e-04 | 43 |
| GO:00324968 | Breast | Precancer | response to lipopolysaccharide | 41/1080 | 343/18723 | 7.94e-06 | 2.17e-04 | 41 |
| GO:00971919 | Breast | Precancer | extrinsic apoptotic signaling pathway | 30/1080 | 219/18723 | 9.42e-06 | 2.50e-04 | 30 |
| GO:00456379 | Breast | Precancer | regulation of myeloid cell differentiation | 28/1080 | 210/18723 | 3.05e-05 | 6.72e-04 | 28 |
| GO:00321034 | Breast | Precancer | positive regulation of response to external stimulus | 46/1080 | 427/18723 | 3.41e-05 | 7.40e-04 | 46 |
| GO:19037069 | Breast | Precancer | regulation of hemopoiesis | 41/1080 | 367/18723 | 3.95e-05 | 8.52e-04 | 41 |
| GO:00506736 | Breast | Precancer | epithelial cell proliferation | 46/1080 | 437/18723 | 6.02e-05 | 1.23e-03 | 46 |
| GO:00313493 | Breast | Precancer | positive regulation of defense response | 33/1080 | 278/18723 | 6.79e-05 | 1.36e-03 | 33 |
| Page: 1 2 3 4 5 6 7 8 9 10 11 12 13 14 15 16 17 18 19 20 21 22 23 24 25 26 27 28 29 30 31 32 33 34 |
| Pathway ID | Tissue | Disease Stage | Description | Gene Ratio | Bg Ratio | pvalue | p.adjust | qvalue | Count |
| Page: 1 |
Top |
Cell-cell communication analysis |
| Identification of potential cell-cell interactions between two cell types and their ligand-receptor pairs for different disease states |
| Ligand | Receptor | LRpair | Pathway | Tissue | Disease Stage |
| Page: 1 |
Top |
Single-cell gene regulatory network inference analysis |
| Find out the significant the regulons (TFs) and the target genes of each regulon across cell types for different disease states |
| TF | Cell Type | Tissue | Disease Stage | Target Gene | RSS | Regulon Activity |
| HMGB2 | MYOFIB | Breast | ADJ | C4orf3,PLIN2,PPDPF, etc. | 2.42e-01 |  |
| HMGB2 | MYOFIB | Breast | Healthy | C4orf3,PLIN2,PPDPF, etc. | 1.73e-01 |  |
| HMGB2 | MYOFIB | Breast | Precancer | C4orf3,PLIN2,PPDPF, etc. | 3.28e-01 |  |
| ∗The dot plots of a searched regulon are shown for all cell subpopulations in each disease state of each tissue based on the regulon specific score inferred using pySCENIC and by calculating the average expression. |
| Page: 1 |
Top |
Somatic mutation of malignant transformation related genes |
| Annotation of somatic variants for genes involved in malignant transformation |
| Hugo Symbol | Variant Class | Variant Classification | dbSNP RS | HGVSc | HGVSp | HGVSp Short | SWISSPROT | BIOTYPE | SIFT | PolyPhen | Tumor Sample Barcode | Tissue | Histology | Sex | Age | Stage | Therapy Types | Drugs | Outcome |
| HMGB2 | SNV | Missense_Mutation | c.97N>A | p.Asp33Asn | p.D33N | P26583 | protein_coding | tolerated(0.2) | benign(0.319) | TCGA-A1-A0SF-01 | Breast | breast invasive carcinoma | Female | <65 | I/II | Chemotherapy | tc | SD | |
| HMGB2 | SNV | Missense_Mutation | c.346N>A | p.Glu116Lys | p.E116K | P26583 | protein_coding | tolerated(0.07) | benign(0.199) | TCGA-C8-A274-01 | Breast | breast invasive carcinoma | Female | <65 | I/II | Hormone Therapy | tamoxiphen | SD | |
| HMGB2 | SNV | Missense_Mutation | c.36A>T | p.Lys12Asn | p.K12N | P26583 | protein_coding | tolerated(0.08) | probably_damaging(0.998) | TCGA-E2-A15O-01 | Breast | breast invasive carcinoma | Female | >=65 | I/II | Hormone Therapy | arimidex | PD | |
| HMGB2 | insertion | Frame_Shift_Ins | novel | c.214_215insCTCA | p.Asp72AlafsTer14 | p.D72Afs*14 | P26583 | protein_coding | TCGA-A8-A06P-01 | Breast | breast invasive carcinoma | Female | <65 | III/IV | Unspecific | SD | |||
| HMGB2 | insertion | Nonsense_Mutation | novel | c.213_214insCCCAGCACTTTGGGAGTGTGAGGTGGGAG | p.Asp72ProfsTer7 | p.D72Pfs*7 | P26583 | protein_coding | TCGA-A8-A06P-01 | Breast | breast invasive carcinoma | Female | <65 | III/IV | Unspecific | SD | |||
| HMGB2 | SNV | Missense_Mutation | c.346N>A | p.Glu116Lys | p.E116K | P26583 | protein_coding | tolerated(0.07) | benign(0.199) | TCGA-IR-A3LK-01 | Cervix | cervical & endocervical cancer | Female | >=65 | I/II | Chemotherapy | cisplatin | PD | |
| HMGB2 | SNV | Missense_Mutation | novel | c.263N>C | p.Lys88Thr | p.K88T | P26583 | protein_coding | deleterious(0.01) | benign(0.241) | TCGA-AA-3984-01 | Colorectum | colon adenocarcinoma | Female | <65 | I/II | Unknown | Unknown | SD |
| HMGB2 | SNV | Missense_Mutation | c.251N>T | p.Asp84Val | p.D84V | P26583 | protein_coding | deleterious(0.05) | benign(0) | TCGA-CM-6676-01 | Colorectum | colon adenocarcinoma | Male | >=65 | I/II | Unknown | Unknown | SD | |
| HMGB2 | SNV | Missense_Mutation | c.627A>T | p.Glu209Asp | p.E209D | P26583 | protein_coding | deleterious_low_confidence(0) | probably_damaging(0.935) | TCGA-F5-6814-01 | Colorectum | rectum adenocarcinoma | Male | <65 | I/II | Unknown | Unknown | SD | |
| HMGB2 | insertion | Nonsense_Mutation | novel | c.422_423insCTG | p.Lys141delinsAsnTer | p.K141delinsN* | P26583 | protein_coding | TCGA-AM-5820-01 | Colorectum | colon adenocarcinoma | Female | <65 | I/II | Unknown | Unknown | SD |
| Page: 1 2 3 4 |
Top |
Related drugs of malignant transformation related genes |
| Identification of chemicals and drugs interact with genes involved in malignant transfromation |
| (DGIdb 4.0) |
| Entrez ID | Symbol | Category | Interaction Types | Drug Claim Name | Drug Name | PMIDs |
| Page: 1 |

Copyright 2023-Present -The University of Texas Health Science Center at Houston |