
|
|||||
|
 | |
| |
| |
| |
| |
| |
|
Gene: HMGA1 |
Gene summary for HMGA1 |
| Gene information | Species | Human | Gene symbol | HMGA1 | Gene ID | 3159 |
| Gene name | high mobility group AT-hook 1 | |
| Gene Alias | HMG-R | |
| Cytomap | 6p21.31 | |
| Gene Type | protein-coding | GO ID | GO:0006139 | UniProtAcc | P17096 |
Top |
Malignant transformation analysis |
| Identification of the aberrant gene expression in precancerous and cancerous lesions by comparing the gene expression of stem-like cells in diseased tissues with normal stem cells |
| Entrez ID | Symbol | Replicates | Species | Organ | Tissue | Adj P-value | Log2FC | Malignancy |
| 3159 | HMGA1 | GSM4909281 | Human | Breast | IDC | 3.28e-03 | 1.53e-01 | 0.21 |
| 3159 | HMGA1 | GSM4909285 | Human | Breast | IDC | 1.05e-10 | 2.17e-01 | 0.21 |
| 3159 | HMGA1 | GSM4909286 | Human | Breast | IDC | 6.39e-20 | -4.48e-01 | 0.1081 |
| 3159 | HMGA1 | GSM4909288 | Human | Breast | IDC | 7.24e-06 | -6.44e-01 | 0.0988 |
| 3159 | HMGA1 | GSM4909293 | Human | Breast | IDC | 7.37e-18 | -4.37e-01 | 0.1581 |
| 3159 | HMGA1 | GSM4909294 | Human | Breast | IDC | 2.82e-13 | -4.80e-01 | 0.2022 |
| 3159 | HMGA1 | GSM4909296 | Human | Breast | IDC | 3.18e-16 | -5.38e-01 | 0.1524 |
| 3159 | HMGA1 | GSM4909297 | Human | Breast | IDC | 9.90e-29 | -6.94e-01 | 0.1517 |
| 3159 | HMGA1 | GSM4909298 | Human | Breast | IDC | 2.77e-23 | -5.67e-01 | 0.1551 |
| 3159 | HMGA1 | GSM4909299 | Human | Breast | IDC | 6.96e-22 | -6.27e-01 | 0.035 |
| 3159 | HMGA1 | GSM4909300 | Human | Breast | IDC | 1.79e-07 | -5.95e-01 | 0.0334 |
| 3159 | HMGA1 | GSM4909301 | Human | Breast | IDC | 4.72e-11 | -5.29e-01 | 0.1577 |
| 3159 | HMGA1 | GSM4909302 | Human | Breast | IDC | 4.68e-17 | -5.94e-01 | 0.1545 |
| 3159 | HMGA1 | GSM4909303 | Human | Breast | IDC | 1.64e-03 | -5.56e-01 | 0.0438 |
| 3159 | HMGA1 | GSM4909304 | Human | Breast | IDC | 9.13e-19 | -5.73e-01 | 0.1636 |
| 3159 | HMGA1 | GSM4909305 | Human | Breast | IDC | 1.43e-07 | -4.67e-01 | 0.0436 |
| 3159 | HMGA1 | GSM4909306 | Human | Breast | IDC | 1.05e-16 | -5.03e-01 | 0.1564 |
| 3159 | HMGA1 | GSM4909307 | Human | Breast | IDC | 3.57e-10 | -4.10e-01 | 0.1569 |
| 3159 | HMGA1 | GSM4909308 | Human | Breast | IDC | 9.48e-09 | -2.95e-01 | 0.158 |
| 3159 | HMGA1 | GSM4909309 | Human | Breast | IDC | 3.77e-13 | -5.58e-01 | 0.0483 |
| Page: 1 2 3 4 5 6 7 8 9 10 11 12 13 14 15 |
| Tissue | Expression Dynamics | Abbreviation |
| Breast | 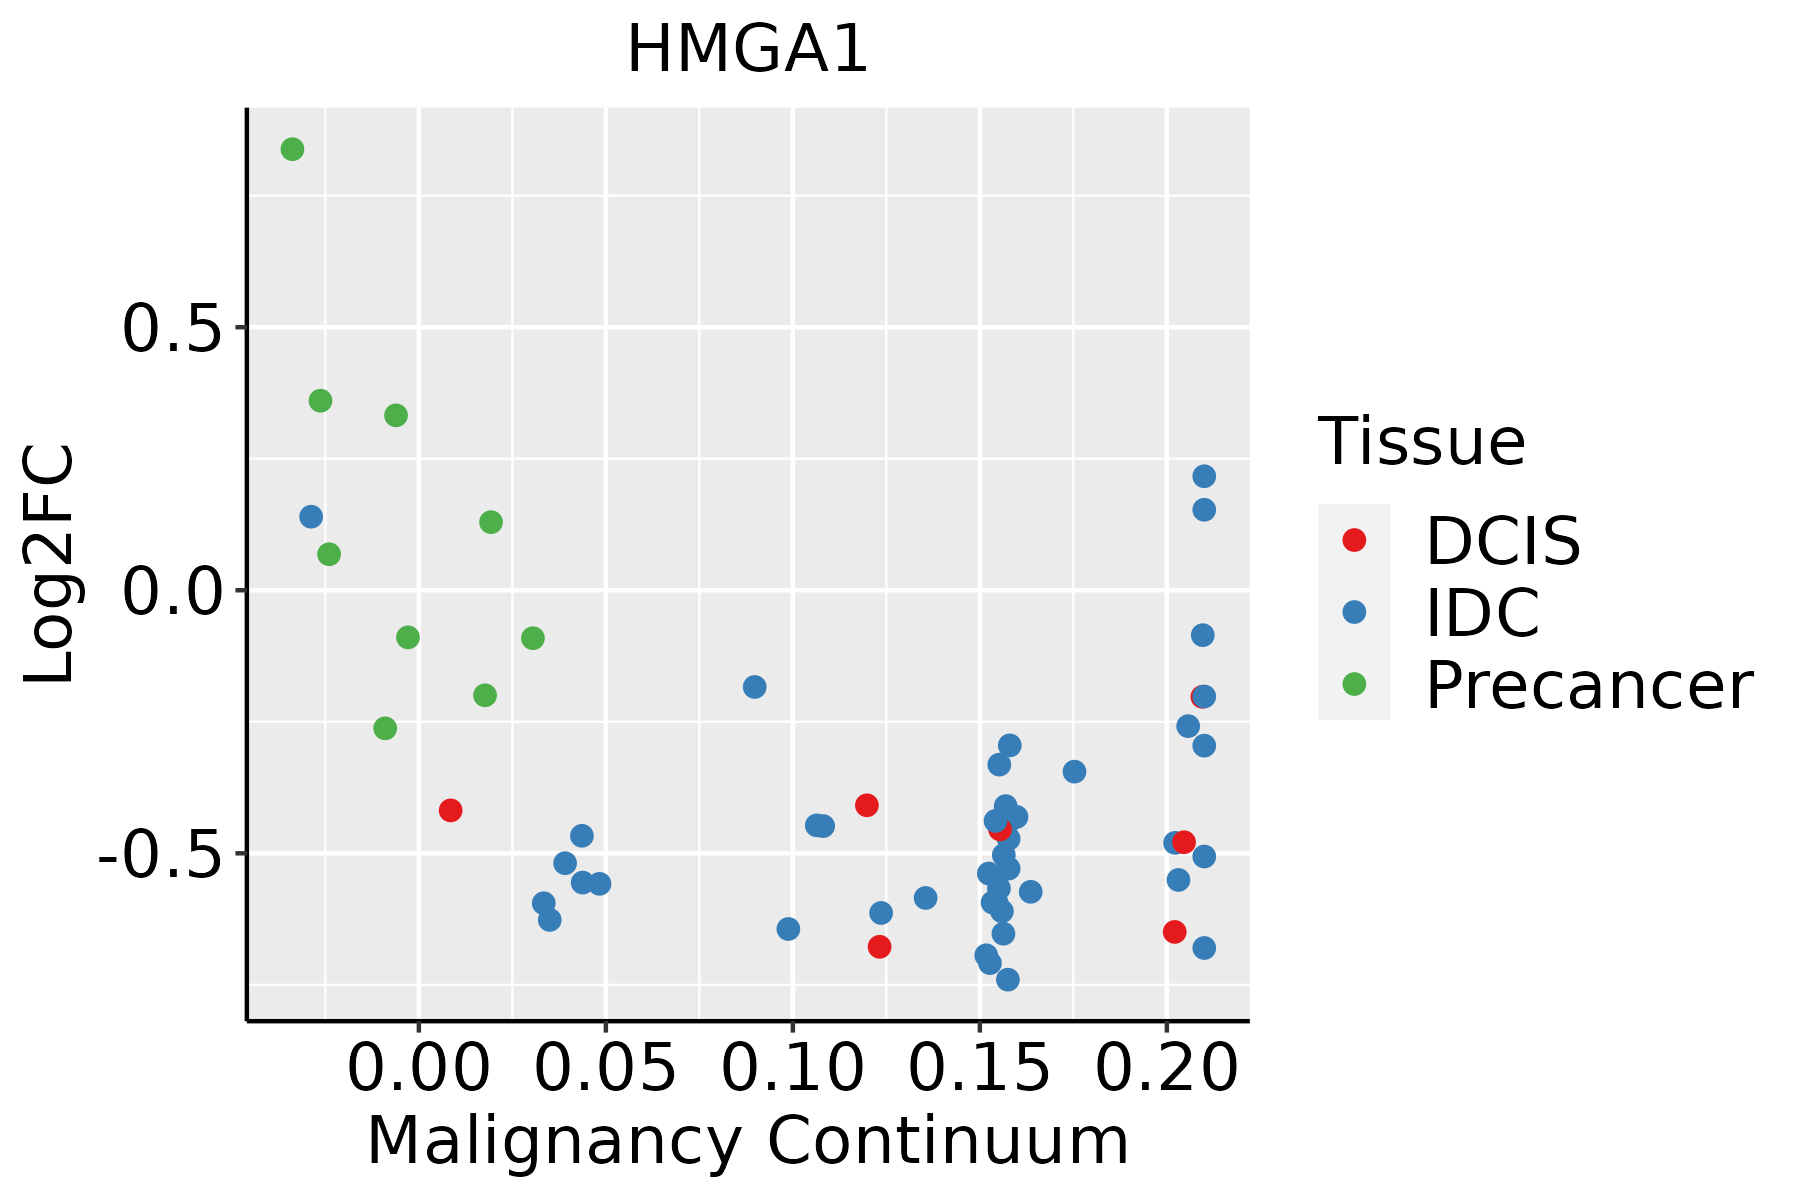 | IDC: Invasive ductal carcinoma |
| DCIS: Ductal carcinoma in situ | ||
| Precancer(BRCA1-mut): Precancerous lesion from BRCA1 mutation carriers | ||
| Colorectum (GSE201348) |  | FAP: Familial adenomatous polyposis |
| CRC: Colorectal cancer | ||
| Colorectum (HTA11) |  | AD: Adenomas |
| SER: Sessile serrated lesions | ||
| MSI-H: Microsatellite-high colorectal cancer | ||
| MSS: Microsatellite stable colorectal cancer | ||
| Endometrium | 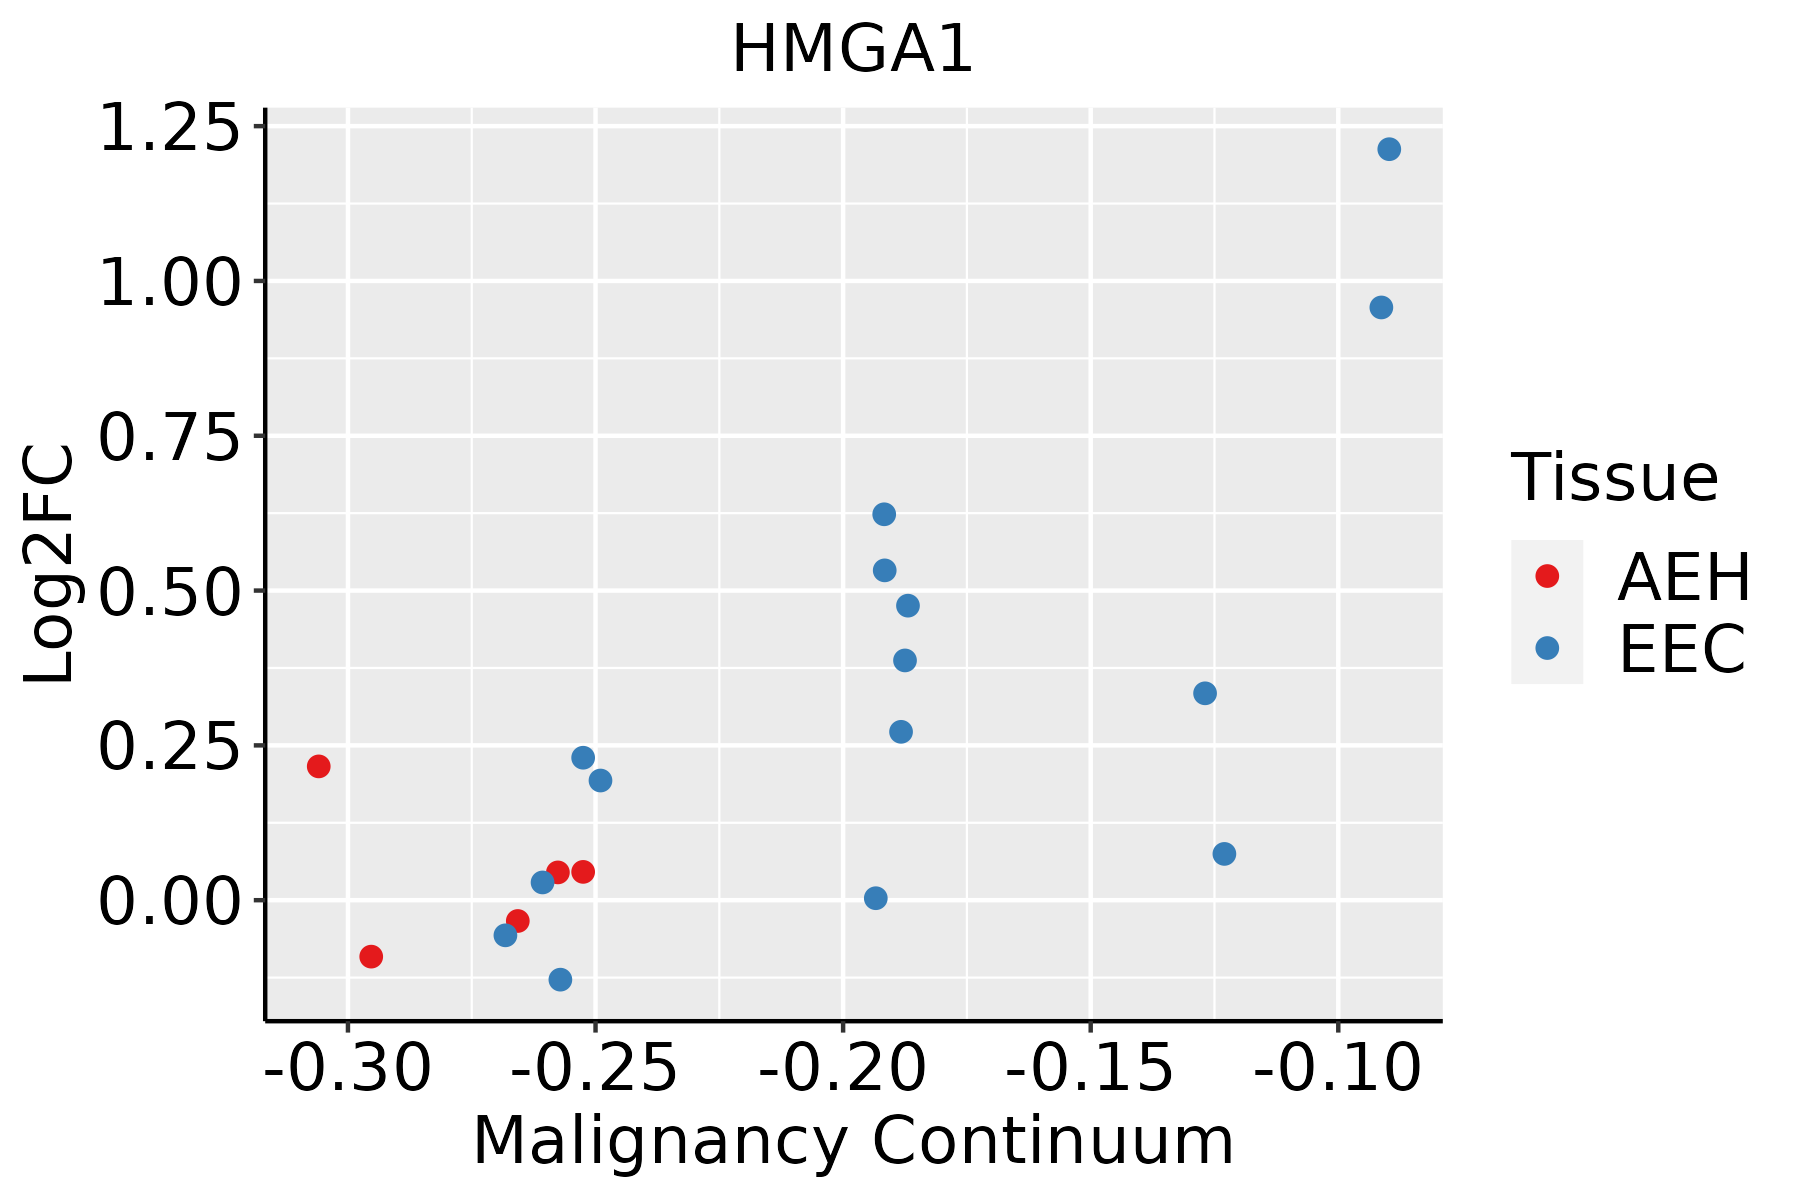 | AEH: Atypical endometrial hyperplasia |
| EEC: Endometrioid Cancer | ||
| Esophagus | 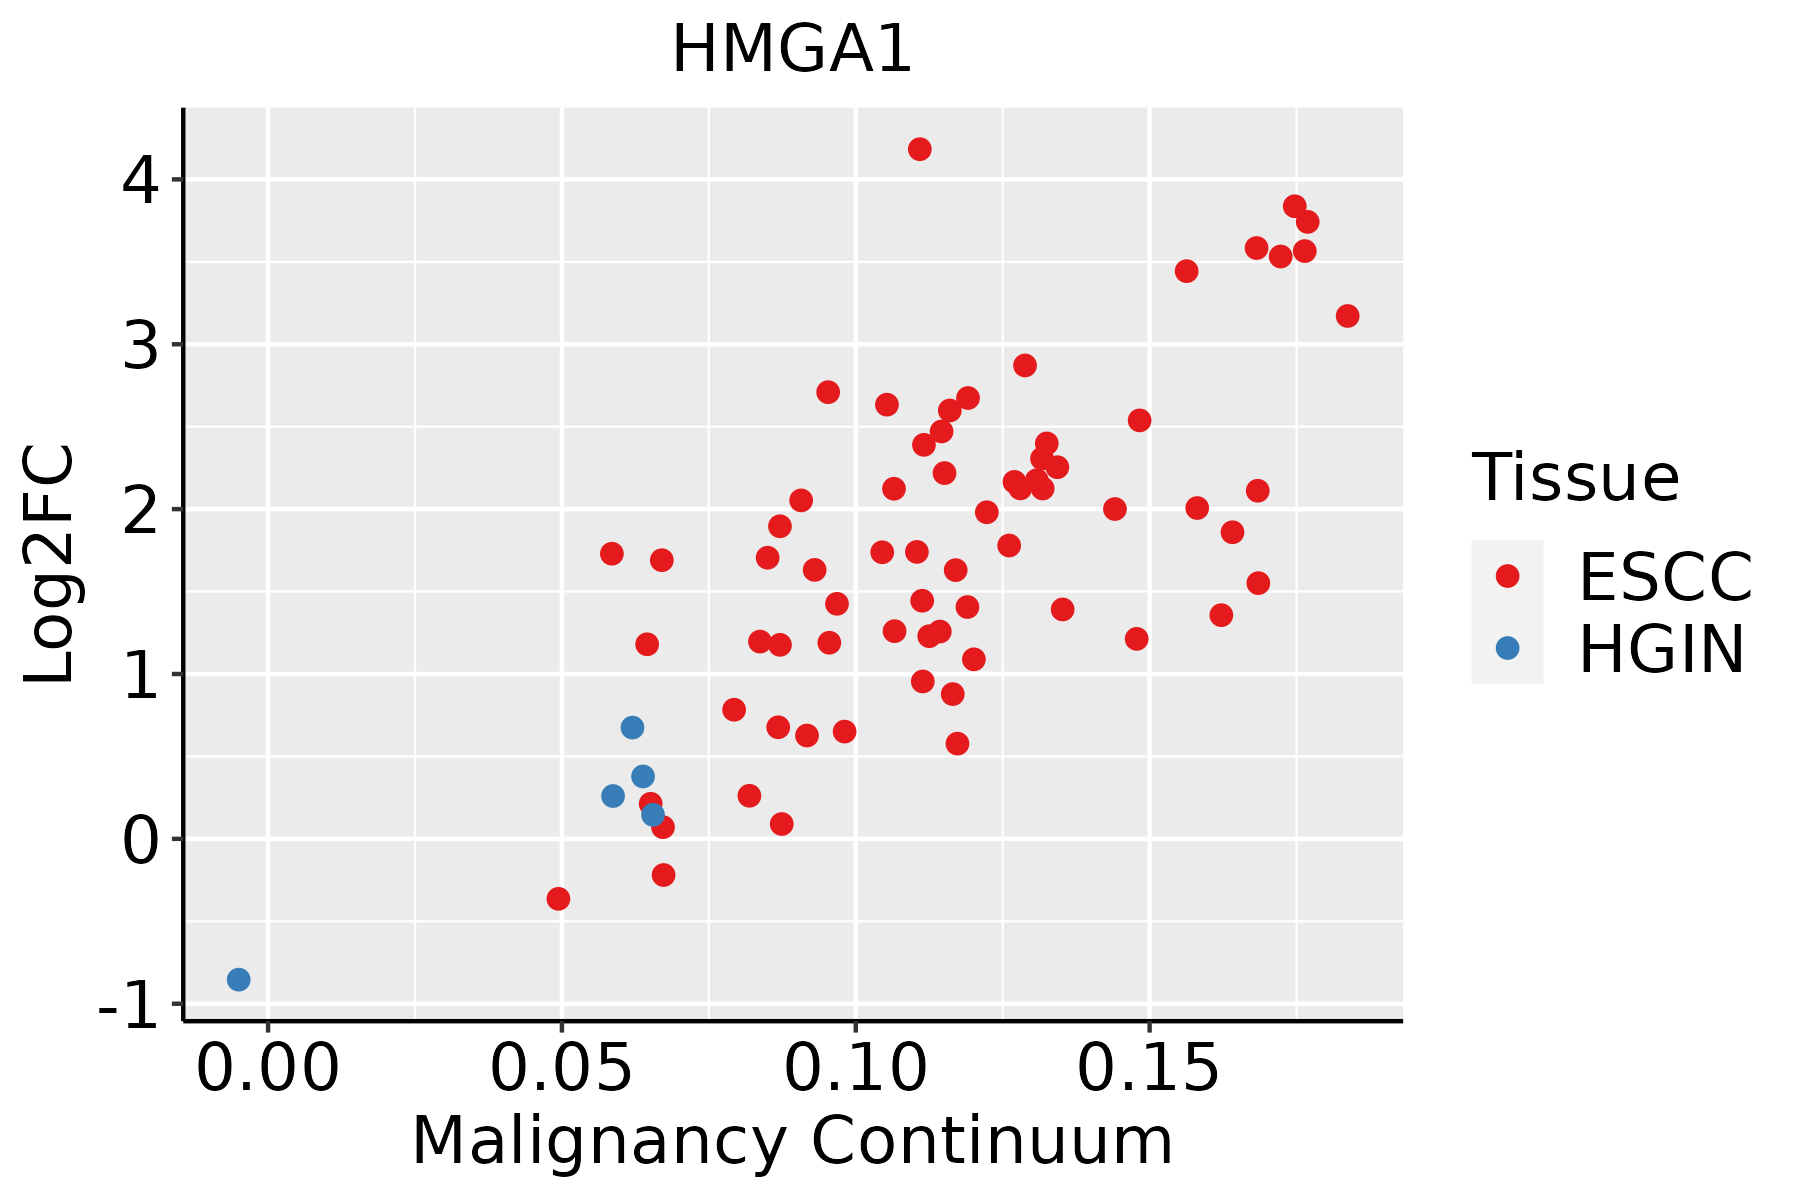 | ESCC: Esophageal squamous cell carcinoma |
| HGIN: High-grade intraepithelial neoplasias | ||
| LGIN: Low-grade intraepithelial neoplasias | ||
| GC |  | CAG: Chronic atrophic gastritis |
| CAG with IM: Chronic atrophic gastritis with intestinal metaplasia | ||
| CSG: Chronic superficial gastritis | ||
| GC: Gastric cancer | ||
| SIM: Severe intestinal metaplasia | ||
| WIM: Wild intestinal metaplasia | ||
| Liver | 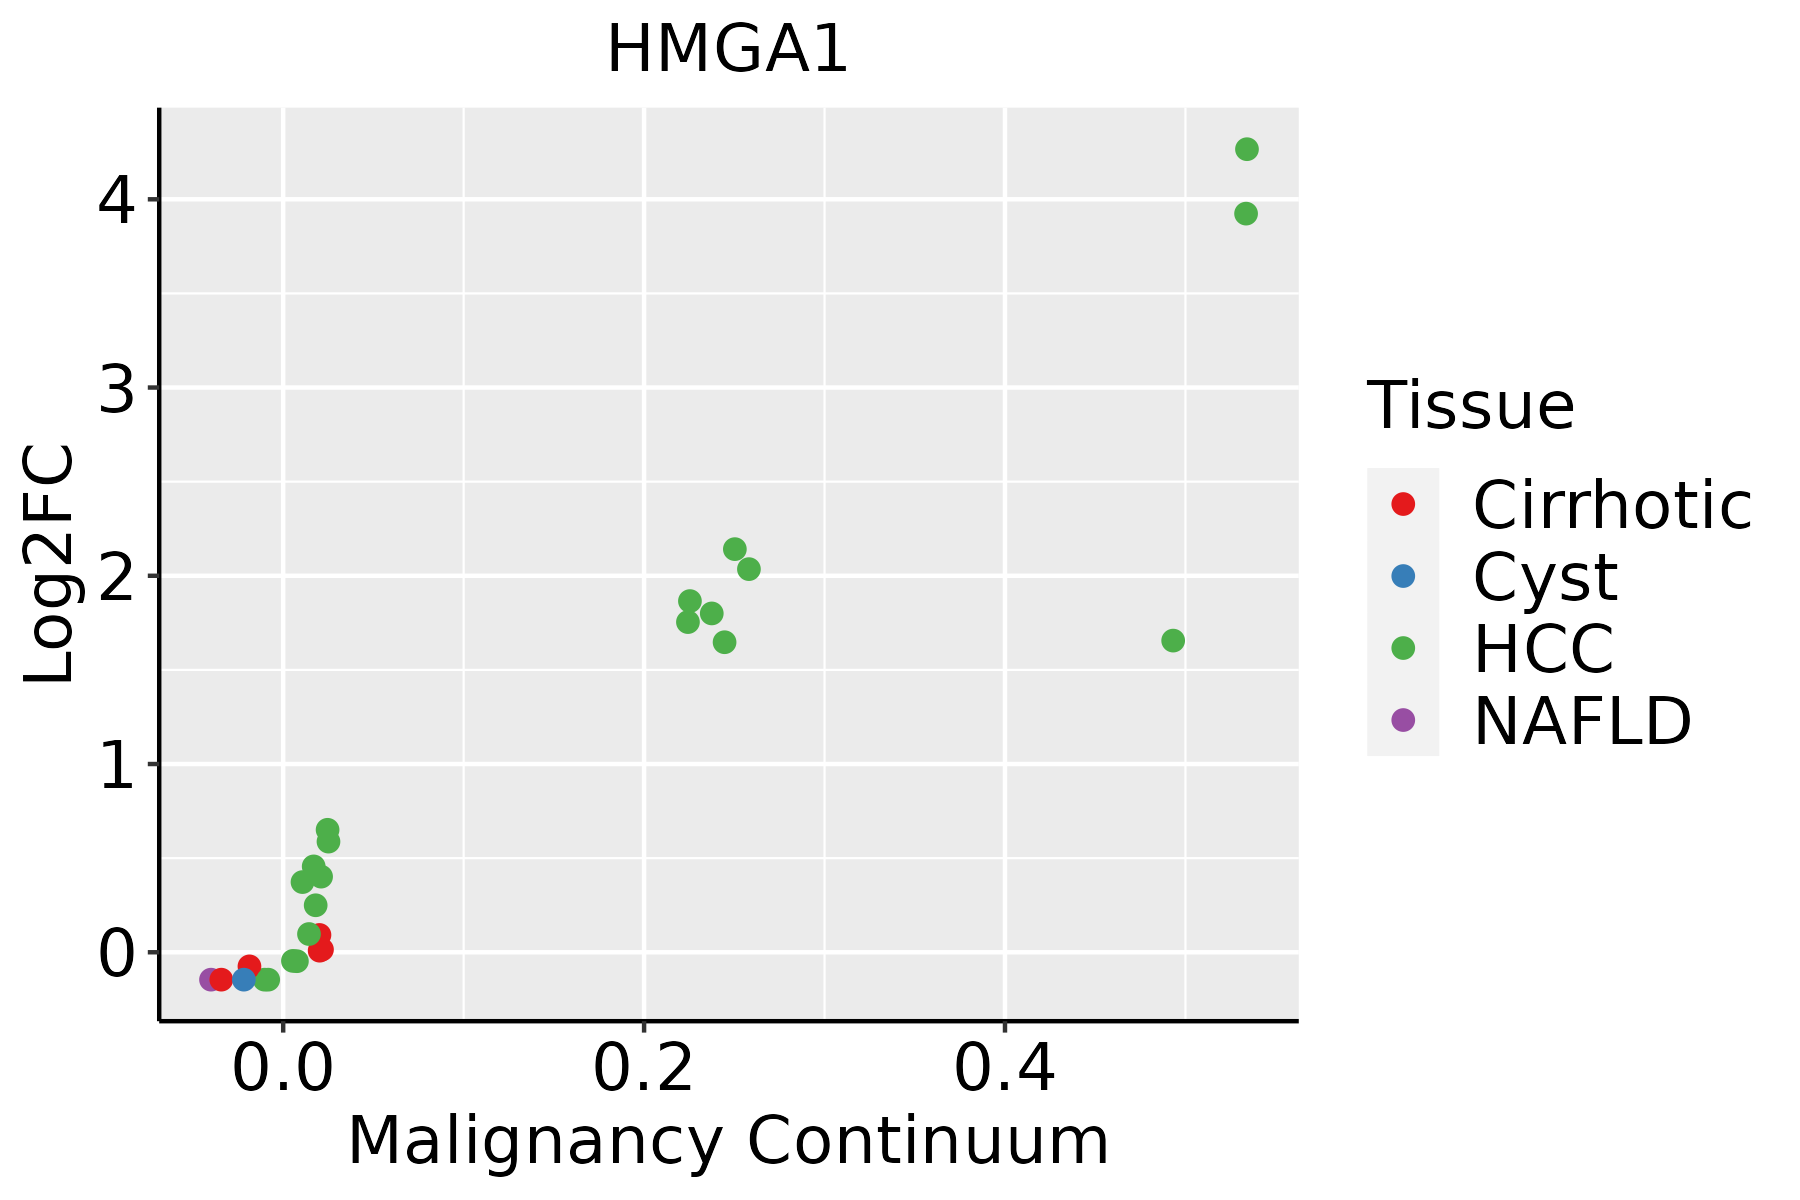 | HCC: Hepatocellular carcinoma |
| NAFLD: Non-alcoholic fatty liver disease | ||
| Oral Cavity |  | EOLP: Erosive Oral lichen planus |
| LP: leukoplakia | ||
| NEOLP: Non-erosive oral lichen planus | ||
| OSCC: Oral squamous cell carcinoma | ||
| Prostate |  | BPH: Benign Prostatic Hyperplasia |
| Skin | 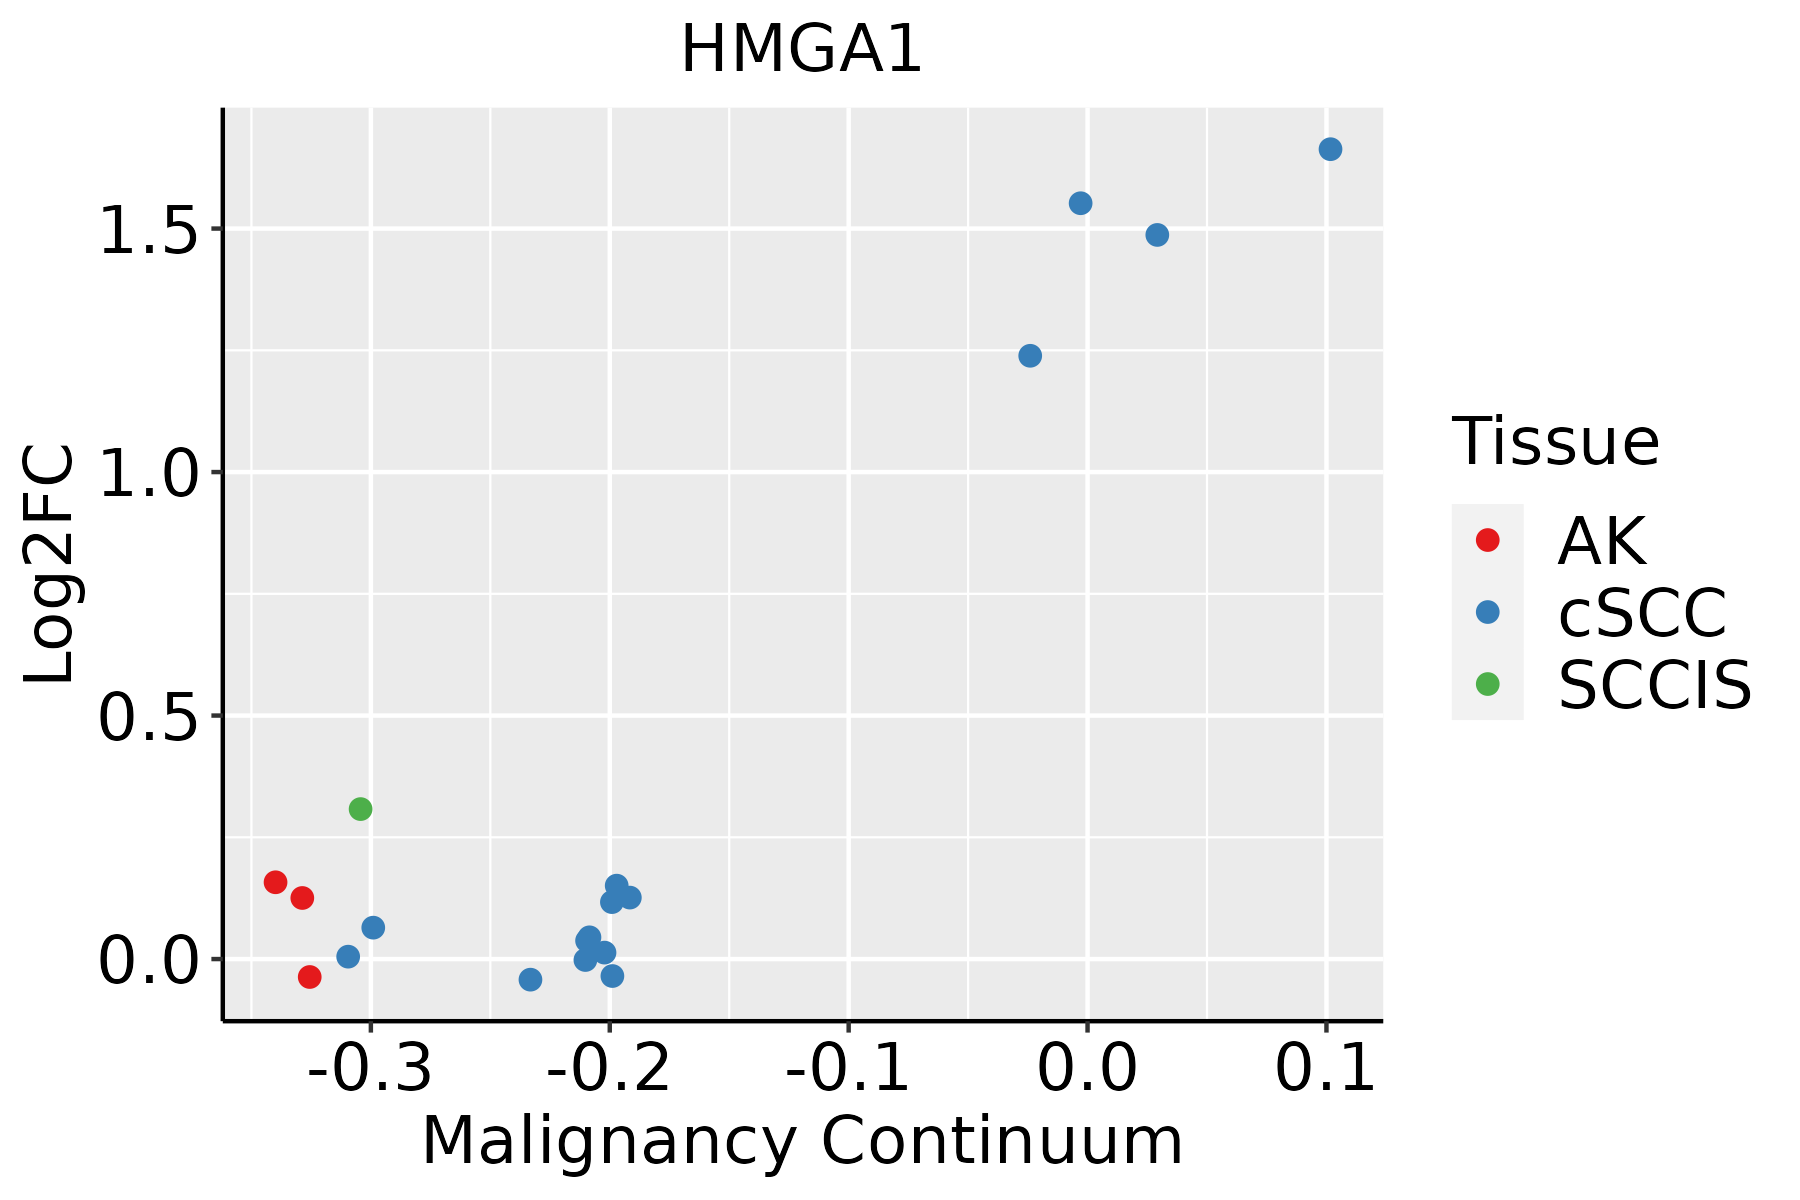 | AK: Actinic keratosis |
| cSCC: Cutaneous squamous cell carcinoma | ||
| SCCIS:squamous cell carcinoma in situ | ||
| Thyroid | 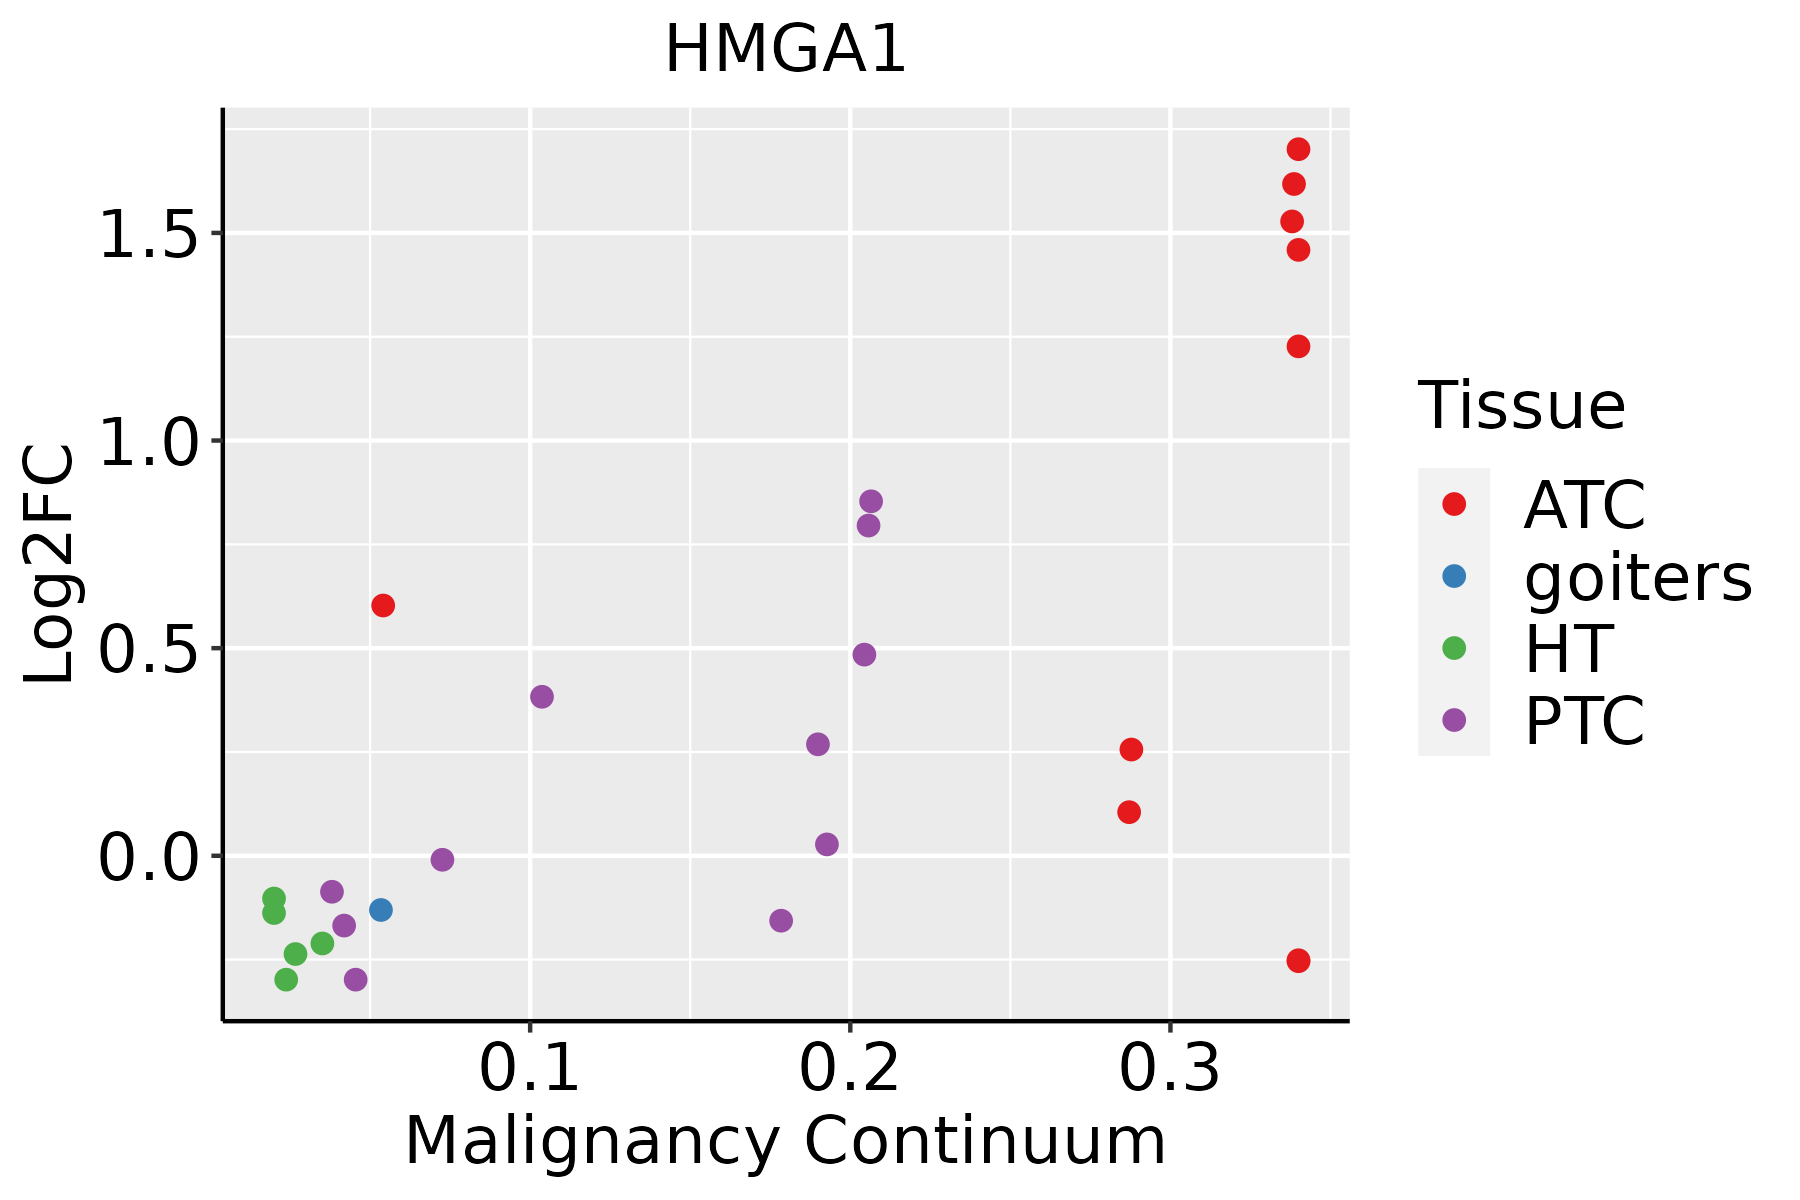 | ATC: Anaplastic thyroid cancer |
| HT: Hashimoto's thyroiditis | ||
| PTC: Papillary thyroid cancer |
| ∗log2FC in expression of this searched gene in stem-like cells from each diseased tissue sample relative to stem-like cells in normal samples in each tissue plotted against the malignancy continuum. Samples are colored based on if they are from different disease stage. |
Top |
Malignant transformation related pathway analysis |
| Find out the enriched GO biological processes and KEGG pathways involved in transition from healthy to precancer to cancer |
| Tissue | Disease Stage | Enriched GO biological Processes |
| Colorectum | AD |  |
| Colorectum | SER |  |
| Colorectum | MSS |  |
| Colorectum | MSI-H |  |
| Colorectum | FAP |  |
| ∗Top 15 enriched GO BP terms are showed in the bar plot of each disease state in each tissue. Each row represents a significant GO biological process which is colored according to the -log10(p.adjust). |
| Page: 1 2 3 4 5 6 7 8 9 |
| GO ID | Tissue | Disease Stage | Description | Gene Ratio | Bg Ratio | pvalue | p.adjust | Count |
| GO:00075688 | Breast | Precancer | aging | 41/1080 | 339/18723 | 5.95e-06 | 1.71e-04 | 41 |
| GO:00224119 | Breast | Precancer | cellular component disassembly | 44/1080 | 443/18723 | 3.17e-04 | 4.51e-03 | 44 |
| GO:00329865 | Breast | Precancer | protein-DNA complex disassembly | 6/1080 | 20/18723 | 6.99e-04 | 8.43e-03 | 6 |
| GO:00075694 | Breast | Precancer | cell aging | 17/1080 | 132/18723 | 1.55e-03 | 1.59e-02 | 17 |
| GO:00903423 | Breast | Precancer | regulation of cell aging | 10/1080 | 61/18723 | 2.40e-03 | 2.21e-02 | 10 |
| GO:000756813 | Breast | IDC | aging | 52/1434 | 339/18723 | 1.14e-06 | 5.10e-05 | 52 |
| GO:00096157 | Breast | IDC | response to virus | 47/1434 | 367/18723 | 3.53e-04 | 5.16e-03 | 47 |
| GO:003298612 | Breast | IDC | protein-DNA complex disassembly | 6/1434 | 20/18723 | 3.03e-03 | 2.60e-02 | 6 |
| GO:000756912 | Breast | IDC | cell aging | 19/1434 | 132/18723 | 5.63e-03 | 4.08e-02 | 19 |
| GO:00903421 | Breast | IDC | regulation of cell aging | 11/1434 | 61/18723 | 6.10e-03 | 4.36e-02 | 11 |
| GO:000756823 | Breast | DCIS | aging | 50/1390 | 339/18723 | 2.38e-06 | 8.46e-05 | 50 |
| GO:000961512 | Breast | DCIS | response to virus | 45/1390 | 367/18723 | 6.16e-04 | 7.82e-03 | 45 |
| GO:003298621 | Breast | DCIS | protein-DNA complex disassembly | 6/1390 | 20/18723 | 2.59e-03 | 2.30e-02 | 6 |
| GO:000756921 | Breast | DCIS | cell aging | 19/1390 | 132/18723 | 4.03e-03 | 3.20e-02 | 19 |
| GO:00903422 | Breast | DCIS | regulation of cell aging | 11/1390 | 61/18723 | 4.84e-03 | 3.67e-02 | 11 |
| GO:002241113 | Breast | DCIS | cellular component disassembly | 48/1390 | 443/18723 | 5.35e-03 | 3.92e-02 | 48 |
| GO:0022411 | Colorectum | AD | cellular component disassembly | 147/3918 | 443/18723 | 8.53e-10 | 6.76e-08 | 147 |
| GO:0032984 | Colorectum | AD | protein-containing complex disassembly | 81/3918 | 224/18723 | 9.41e-08 | 4.65e-06 | 81 |
| GO:0006325 | Colorectum | AD | chromatin organization | 119/3918 | 409/18723 | 4.85e-05 | 8.33e-04 | 119 |
| GO:0032986 | Colorectum | AD | protein-DNA complex disassembly | 12/3918 | 20/18723 | 1.60e-04 | 2.21e-03 | 12 |
| Page: 1 2 3 4 5 6 7 8 9 10 11 |
| Pathway ID | Tissue | Disease Stage | Description | Gene Ratio | Bg Ratio | pvalue | p.adjust | qvalue | Count |
| Page: 1 |
Top |
Cell-cell communication analysis |
| Identification of potential cell-cell interactions between two cell types and their ligand-receptor pairs for different disease states |
| Ligand | Receptor | LRpair | Pathway | Tissue | Disease Stage |
| Page: 1 |
Top |
Single-cell gene regulatory network inference analysis |
| Find out the significant the regulons (TFs) and the target genes of each regulon across cell types for different disease states |
| TF | Cell Type | Tissue | Disease Stage | Target Gene | RSS | Regulon Activity |
| HMGA1 | TH17 | Colorectum | ADJ | MYBL2,HMGN1,MARCKSL1, etc. | 8.23e-02 |  |
| HMGA1 | CD8TEXINT | Colorectum | ADJ | MYBL2,HMGN1,MARCKSL1, etc. | 1.21e-01 | |
| HMGA1 | CD8TEXP | Colorectum | ADJ | MYBL2,HMGN1,MARCKSL1, etc. | 5.77e-02 | |
| HMGA1 | CD8TEXP | Colorectum | MSS | MYBL2,HMGN1,MARCKSL1, etc. | 1.98e-01 |  |
| HMGA1 | ABP | Lung | Healthy | SMC2,HSPB1,ZWINT, etc. | 9.10e-02 |  |
| HMGA1 | GDT | Oral cavity | NEOLP | LIMD2,RPS18,RPL27A, etc. | 1.85e-01 |  |
| HMGA1 | CD8TEXINT | Oral cavity | NEOLP | LIMD2,RPS18,RPL27A, etc. | 1.67e-01 | |
| HMGA1 | TH17 | Oral cavity | NEOLP | LIMD2,RPS18,RPL27A, etc. | 4.37e-02 | |
| HMGA1 | DUCT2 | Pancreas | Healthy | CLDND1,IFNGR2,NCEH1, etc. | 9.54e-02 |  |
| HMGA1 | pDC | Prostate | Healthy | S100A6,S100A14,PDLIM4, etc. | 2.05e-01 |  |
| ∗The dot plots of a searched regulon are shown for all cell subpopulations in each disease state of each tissue based on the regulon specific score inferred using pySCENIC and by calculating the average expression. |
| Page: 1 2 |
Top |
Somatic mutation of malignant transformation related genes |
| Annotation of somatic variants for genes involved in malignant transformation |
| Hugo Symbol | Variant Class | Variant Classification | dbSNP RS | HGVSc | HGVSp | HGVSp Short | SWISSPROT | BIOTYPE | SIFT | PolyPhen | Tumor Sample Barcode | Tissue | Histology | Sex | Age | Stage | Therapy Types | Drugs | Outcome |
| HMGA1 | SNV | Missense_Mutation | c.165N>C | p.Lys55Asn | p.K55N | P17096 | protein_coding | deleterious(0) | benign(0) | TCGA-Q1-A73P-01 | Cervix | cervical & endocervical cancer | Female | <65 | I/II | Unknown | Unknown | SD | |
| HMGA1 | SNV | Missense_Mutation | c.118N>A | p.Ala40Thr | p.A40T | P17096 | protein_coding | tolerated_low_confidence(0.33) | benign(0.036) | TCGA-AD-5900-01 | Colorectum | colon adenocarcinoma | Male | >=65 | I/II | Unknown | Unknown | SD | |
| HMGA1 | SNV | Missense_Mutation | c.172C>T | p.Arg58Trp | p.R58W | P17096 | protein_coding | tolerated(0.09) | possibly_damaging(0.898) | TCGA-CG-4306-01 | Stomach | stomach adenocarcinoma | Male | >=65 | III/IV | Unknown | Unknown | SD |
| Page: 1 |
Top |
Related drugs of malignant transformation related genes |
| Identification of chemicals and drugs interact with genes involved in malignant transfromation |
| (DGIdb 4.0) |
| Entrez ID | Symbol | Category | Interaction Types | Drug Claim Name | Drug Name | PMIDs |
| Page: 1 |

Copyright 2023-Present -The University of Texas Health Science Center at Houston |