
|
|||||
|
 | |
| |
| |
| |
| |
| |
|
Gene: HMG20A |
Gene summary for HMG20A |
| Gene information | Species | Human | Gene symbol | HMG20A | Gene ID | 10363 |
| Gene name | high mobility group 20A | |
| Gene Alias | HMGX1 | |
| Cytomap | 15q24.3 | |
| Gene Type | protein-coding | GO ID | GO:0000122 | UniProtAcc | Q9NP66 |
Top |
Malignant transformation analysis |
| Identification of the aberrant gene expression in precancerous and cancerous lesions by comparing the gene expression of stem-like cells in diseased tissues with normal stem cells |
| Entrez ID | Symbol | Replicates | Species | Organ | Tissue | Adj P-value | Log2FC | Malignancy |
| 10363 | HMG20A | HTA11_3410_2000001011 | Human | Colorectum | AD | 7.67e-06 | -3.79e-01 | 0.0155 |
| 10363 | HMG20A | HTA11_866_3004761011 | Human | Colorectum | AD | 3.00e-05 | -4.17e-01 | 0.096 |
| 10363 | HMG20A | HTA11_10711_2000001011 | Human | Colorectum | AD | 1.77e-02 | -4.28e-01 | 0.0338 |
| 10363 | HMG20A | HTA11_7696_3000711011 | Human | Colorectum | AD | 5.01e-03 | -3.69e-01 | 0.0674 |
| 10363 | HMG20A | HTA11_99999970781_79442 | Human | Colorectum | MSS | 5.62e-06 | -3.82e-01 | 0.294 |
| 10363 | HMG20A | HTA11_99999971662_82457 | Human | Colorectum | MSS | 1.49e-05 | -3.97e-01 | 0.3859 |
| 10363 | HMG20A | HTA11_99999974143_84620 | Human | Colorectum | MSS | 5.32e-09 | -4.53e-01 | 0.3005 |
| 10363 | HMG20A | A015-C-203 | Human | Colorectum | FAP | 1.34e-12 | -3.29e-01 | -0.1294 |
| 10363 | HMG20A | A015-C-204 | Human | Colorectum | FAP | 1.74e-06 | -4.06e-01 | -0.0228 |
| 10363 | HMG20A | A002-C-201 | Human | Colorectum | FAP | 8.87e-14 | -4.25e-01 | 0.0324 |
| 10363 | HMG20A | A001-C-119 | Human | Colorectum | FAP | 7.53e-07 | -4.59e-01 | -0.1557 |
| 10363 | HMG20A | A001-C-108 | Human | Colorectum | FAP | 4.07e-11 | -3.71e-01 | -0.0272 |
| 10363 | HMG20A | A002-C-205 | Human | Colorectum | FAP | 9.25e-15 | -4.27e-01 | -0.1236 |
| 10363 | HMG20A | A015-C-005 | Human | Colorectum | FAP | 6.03e-05 | -3.49e-01 | -0.0336 |
| 10363 | HMG20A | A015-C-006 | Human | Colorectum | FAP | 1.53e-11 | -4.70e-01 | -0.0994 |
| 10363 | HMG20A | A015-C-106 | Human | Colorectum | FAP | 1.32e-07 | -3.59e-01 | -0.0511 |
| 10363 | HMG20A | A002-C-114 | Human | Colorectum | FAP | 1.19e-14 | -4.67e-01 | -0.1561 |
| 10363 | HMG20A | A015-C-104 | Human | Colorectum | FAP | 3.65e-17 | -4.57e-01 | -0.1899 |
| 10363 | HMG20A | A001-C-014 | Human | Colorectum | FAP | 1.01e-06 | -3.55e-01 | 0.0135 |
| 10363 | HMG20A | A002-C-016 | Human | Colorectum | FAP | 1.94e-15 | -4.10e-01 | 0.0521 |
| Page: 1 2 3 |
| Tissue | Expression Dynamics | Abbreviation |
| Colorectum (GSE201348) |  | FAP: Familial adenomatous polyposis |
| CRC: Colorectal cancer | ||
| Colorectum (HTA11) |  | AD: Adenomas |
| SER: Sessile serrated lesions | ||
| MSI-H: Microsatellite-high colorectal cancer | ||
| MSS: Microsatellite stable colorectal cancer | ||
| Thyroid | 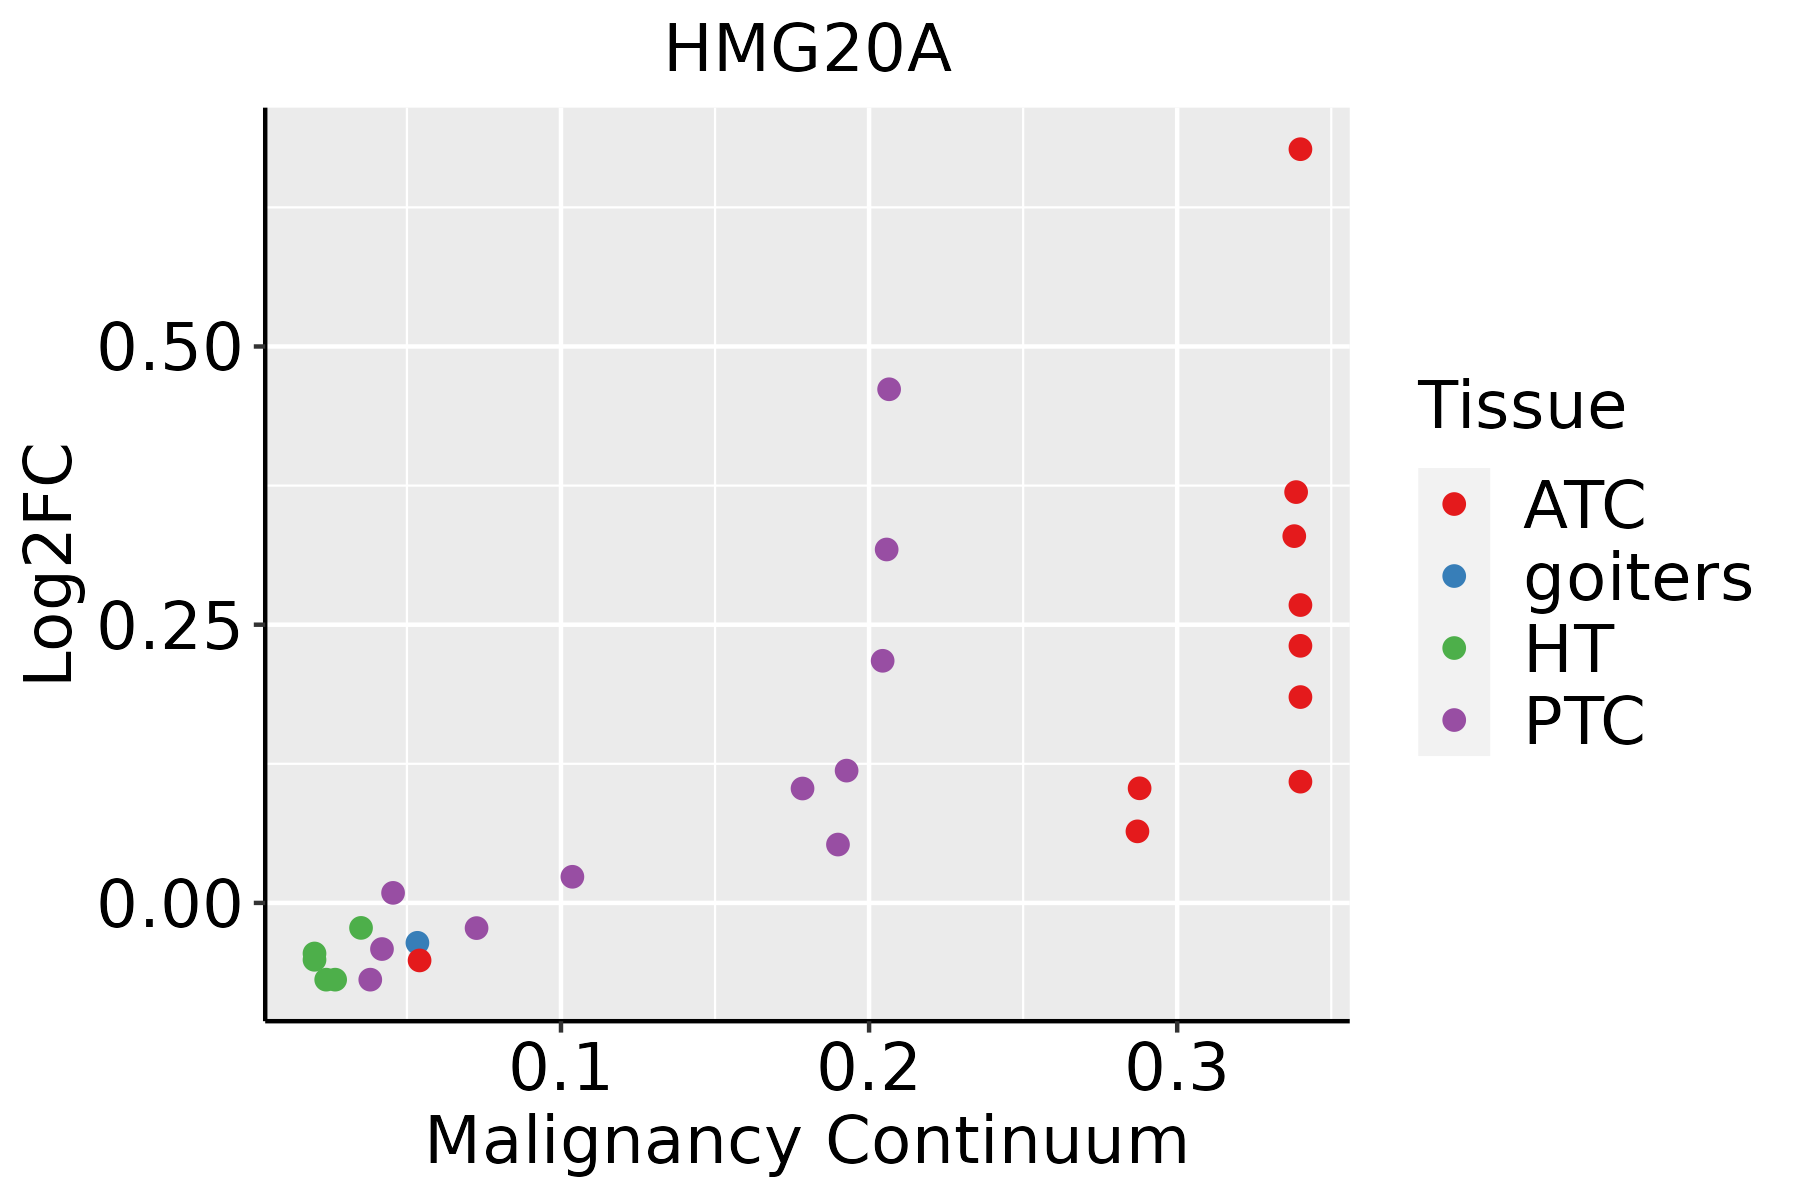 | ATC: Anaplastic thyroid cancer |
| HT: Hashimoto's thyroiditis | ||
| PTC: Papillary thyroid cancer |
| ∗log2FC in expression of this searched gene in stem-like cells from each diseased tissue sample relative to stem-like cells in normal samples in each tissue plotted against the malignancy continuum. Samples are colored based on if they are from different disease stage. |
Top |
Malignant transformation related pathway analysis |
| Find out the enriched GO biological processes and KEGG pathways involved in transition from healthy to precancer to cancer |
| Tissue | Disease Stage | Enriched GO biological Processes |
| Colorectum | AD |  |
| Colorectum | SER |  |
| Colorectum | MSS |  |
| Colorectum | MSI-H |  |
| Colorectum | FAP |  |
| ∗Top 15 enriched GO BP terms are showed in the bar plot of each disease state in each tissue. Each row represents a significant GO biological process which is colored according to the -log10(p.adjust). |
| Page: 1 2 3 4 5 6 7 8 9 |
| GO ID | Tissue | Disease Stage | Description | Gene Ratio | Bg Ratio | pvalue | p.adjust | Count |
| GO:1903320 | Colorectum | AD | regulation of protein modification by small protein conjugation or removal | 86/3918 | 242/18723 | 9.43e-08 | 4.65e-06 | 86 |
| GO:1903321 | Colorectum | AD | negative regulation of protein modification by small protein conjugation or removal | 37/3918 | 95/18723 | 4.49e-05 | 7.83e-04 | 37 |
| GO:0006325 | Colorectum | AD | chromatin organization | 119/3918 | 409/18723 | 4.85e-05 | 8.33e-04 | 119 |
| GO:19033202 | Colorectum | MSS | regulation of protein modification by small protein conjugation or removal | 82/3467 | 242/18723 | 7.49e-09 | 4.63e-07 | 82 |
| GO:19033212 | Colorectum | MSS | negative regulation of protein modification by small protein conjugation or removal | 36/3467 | 95/18723 | 7.10e-06 | 1.82e-04 | 36 |
| GO:00063252 | Colorectum | MSS | chromatin organization | 107/3467 | 409/18723 | 7.22e-05 | 1.21e-03 | 107 |
| GO:19033204 | Colorectum | FAP | regulation of protein modification by small protein conjugation or removal | 61/2622 | 242/18723 | 2.36e-06 | 9.21e-05 | 61 |
| GO:00063253 | Colorectum | FAP | chromatin organization | 84/2622 | 409/18723 | 1.62e-04 | 2.47e-03 | 84 |
| GO:19033214 | Colorectum | FAP | negative regulation of protein modification by small protein conjugation or removal | 25/2622 | 95/18723 | 1.10e-03 | 1.06e-02 | 25 |
| GO:19033205 | Colorectum | CRC | regulation of protein modification by small protein conjugation or removal | 51/2078 | 242/18723 | 4.55e-06 | 1.87e-04 | 51 |
| GO:19033215 | Colorectum | CRC | negative regulation of protein modification by small protein conjugation or removal | 26/2078 | 95/18723 | 9.16e-06 | 3.19e-04 | 26 |
| GO:00063254 | Colorectum | CRC | chromatin organization | 74/2078 | 409/18723 | 1.48e-05 | 4.61e-04 | 74 |
| GO:1903320113 | Thyroid | PTC | regulation of protein modification by small protein conjugation or removal | 148/5968 | 242/18723 | 4.49e-21 | 8.10e-19 | 148 |
| GO:00182059 | Thyroid | PTC | peptidyl-lysine modification | 188/5968 | 376/18723 | 1.34e-13 | 7.09e-12 | 188 |
| GO:1903321113 | Thyroid | PTC | negative regulation of protein modification by small protein conjugation or removal | 59/5968 | 95/18723 | 1.26e-09 | 3.63e-08 | 59 |
| GO:000632520 | Thyroid | PTC | chromatin organization | 183/5968 | 409/18723 | 2.55e-08 | 5.70e-07 | 183 |
| GO:00169256 | Thyroid | PTC | protein sumoylation | 30/5968 | 53/18723 | 1.71e-04 | 1.31e-03 | 30 |
| GO:190332034 | Thyroid | ATC | regulation of protein modification by small protein conjugation or removal | 152/6293 | 242/18723 | 9.76e-21 | 1.71e-18 | 152 |
| GO:001820516 | Thyroid | ATC | peptidyl-lysine modification | 193/6293 | 376/18723 | 6.92e-13 | 3.06e-11 | 193 |
| GO:190332135 | Thyroid | ATC | negative regulation of protein modification by small protein conjugation or removal | 60/6293 | 95/18723 | 3.53e-09 | 8.14e-08 | 60 |
| Page: 1 2 |
| Pathway ID | Tissue | Disease Stage | Description | Gene Ratio | Bg Ratio | pvalue | p.adjust | qvalue | Count |
| Page: 1 |
Top |
Cell-cell communication analysis |
| Identification of potential cell-cell interactions between two cell types and their ligand-receptor pairs for different disease states |
| Ligand | Receptor | LRpair | Pathway | Tissue | Disease Stage |
| Page: 1 |
Top |
Single-cell gene regulatory network inference analysis |
| Find out the significant the regulons (TFs) and the target genes of each regulon across cell types for different disease states |
| TF | Cell Type | Tissue | Disease Stage | Target Gene | RSS | Regulon Activity |
| ∗The dot plots of a searched regulon are shown for all cell subpopulations in each disease state of each tissue based on the regulon specific score inferred using pySCENIC and by calculating the average expression. |
| Page: 1 |
Top |
Somatic mutation of malignant transformation related genes |
| Annotation of somatic variants for genes involved in malignant transformation |
| Hugo Symbol | Variant Class | Variant Classification | dbSNP RS | HGVSc | HGVSp | HGVSp Short | SWISSPROT | BIOTYPE | SIFT | PolyPhen | Tumor Sample Barcode | Tissue | Histology | Sex | Age | Stage | Therapy Types | Drugs | Outcome |
| HMG20A | SNV | Missense_Mutation | novel | c.293G>C | p.Arg98Pro | p.R98P | Q9NP66 | protein_coding | deleterious(0.01) | possibly_damaging(0.899) | TCGA-AC-A5XS-01 | Breast | breast invasive carcinoma | Female | >=65 | I/II | Hormone Therapy | femara | SD |
| HMG20A | SNV | Missense_Mutation | novel | c.851N>G | p.His284Arg | p.H284R | Q9NP66 | protein_coding | deleterious(0.01) | possibly_damaging(0.852) | TCGA-BH-A18G-01 | Breast | breast invasive carcinoma | Female | >=65 | I/II | Unknown | Unknown | SD |
| HMG20A | insertion | Nonsense_Mutation | novel | c.817_818insTTTATTTTTCCTGTGTCTAAAGAA | p.Gln273delinsLeuTyrPheSerCysValTerArgLys | p.Q273delinsLYFSCV*RK | Q9NP66 | protein_coding | TCGA-AO-A0J9-01 | Breast | breast invasive carcinoma | Female | <65 | III/IV | Chemotherapy | cyclophosphamide | PD | ||
| HMG20A | insertion | In_Frame_Ins | novel | c.185_186insTGTTTTAGCTCT | p.Gln62delinsHisValLeuAlaLeu | p.Q62delinsHVLAL | Q9NP66 | protein_coding | TCGA-BH-A0GY-01 | Breast | breast invasive carcinoma | Female | >=65 | I/II | Chemotherapy | cyotxan | SD | ||
| HMG20A | deletion | Frame_Shift_Del | novel | c.1024delN | p.Val342Ter | p.V342* | Q9NP66 | protein_coding | TCGA-D8-A27V-01 | Breast | breast invasive carcinoma | Female | <65 | I/II | Hormone Therapy | tamoxiphen | SD | ||
| HMG20A | SNV | Missense_Mutation | c.956G>C | p.Arg319Thr | p.R319T | Q9NP66 | protein_coding | deleterious(0.01) | possibly_damaging(0.552) | TCGA-C5-A1BQ-01 | Cervix | cervical & endocervical cancer | Female | >=65 | III/IV | Chemotherapy | cisplatin | CR | |
| HMG20A | SNV | Missense_Mutation | c.744N>T | p.Glu248Asp | p.E248D | Q9NP66 | protein_coding | deleterious(0.01) | possibly_damaging(0.857) | TCGA-AA-3845-01 | Colorectum | colon adenocarcinoma | Female | >=65 | I/II | Unknown | Unknown | PD | |
| HMG20A | SNV | Missense_Mutation | c.1036G>A | p.Asp346Asn | p.D346N | Q9NP66 | protein_coding | tolerated(0.26) | benign(0.027) | TCGA-AA-3968-01 | Colorectum | colon adenocarcinoma | Female | <65 | I/II | Unknown | Unknown | SD | |
| HMG20A | SNV | Missense_Mutation | c.480N>T | p.Lys160Asn | p.K160N | Q9NP66 | protein_coding | deleterious(0) | probably_damaging(0.998) | TCGA-AM-5821-01 | Colorectum | colon adenocarcinoma | Female | >=65 | I/II | Unknown | Unknown | SD | |
| HMG20A | SNV | Missense_Mutation | c.619G>C | p.Glu207Gln | p.E207Q | Q9NP66 | protein_coding | tolerated(0.42) | benign(0.046) | TCGA-DM-A1D8-01 | Colorectum | colon adenocarcinoma | Female | <65 | III/IV | Unknown | Unknown | SD |
| Page: 1 2 3 4 5 |
Top |
Related drugs of malignant transformation related genes |
| Identification of chemicals and drugs interact with genes involved in malignant transfromation |
| (DGIdb 4.0) |
| Entrez ID | Symbol | Category | Interaction Types | Drug Claim Name | Drug Name | PMIDs |
| Page: 1 |

Copyright 2023-Present -The University of Texas Health Science Center at Houston |