Schematic overview of the cellular and molecular mechanisms involved in the cancer progression, including the proposed cellular and molecular mechanisms in cancer cells trajectory. AT1: alveolar type 1 cells; AT2: alveolar type 2 cells; AAH: atypical adenomatous hyperplasia; AIS: adenocarcinoma in situ; MIA: minimally invasive adenocarcinoma; IA: invasive adenocarcinoma; EMT: epithelial-mesenchymal transition

Home

Download

Statistics

Help

Contact

Center for Computational Systems Medicine
leaf

Gene summary

leaf

Malignant transformation analysis

leaf

Malignant transformation related pathway analysis

leaf

Cell-cell communication analysis

leaf

Single-cell gene regulatory network inference analysis

leaf

Somatic mutation of malignant transformation related genes

leaf

Related drugs of malignant transformation related genes

Gene: HMCES

Gene summary for HMCES

check button Gene summary.

Gene informationSpeciesHuman
Gene symbol

HMCES

Gene ID

56941

Gene name5-hydroxymethylcytosine binding, ES cell specific
Gene AliasC3orf37
Cytomap3q21.3
Gene Typeprotein-coding
GO ID

GO:0000018

UniProtAcc

Q96FZ2


Top

Malignant transformation analysis

check button Identification of the aberrant gene expression in precancerous and cancerous lesions by comparing the gene expression of stem-like cells in diseased tissues with normal stem cells
check button Malignant transformation involving gene list.
Entrez IDSymbolReplicatesSpeciesOrganTissueAdj P-valueLog2FCMalignancy
56941HMCESHTA11_2487_2000001011HumanColorectumSER3.84e-042.28e-01-0.1808
56941HMCESHTA11_347_2000001011HumanColorectumAD6.73e-073.10e-01-0.1954
56941HMCESHTA11_83_2000001011HumanColorectumSER5.49e-052.83e-01-0.1526
56941HMCESHTA11_866_2000001011HumanColorectumAD3.27e-022.14e-01-0.1001
56941HMCESHTA11_866_3004761011HumanColorectumAD1.09e-053.17e-010.096
56941HMCESHTA11_7696_3000711011HumanColorectumAD1.44e-042.52e-010.0674
56941HMCESHTA11_99999971662_82457HumanColorectumMSS3.78e-083.85e-010.3859
56941HMCESA015-C-203HumanColorectumFAP1.71e-02-1.02e-01-0.1294
56941HMCESA015-C-104HumanColorectumFAP1.71e-02-1.12e-01-0.1899
56941HMCESLZE2THumanEsophagusESCC4.33e-027.86e-010.082
56941HMCESLZE4THumanEsophagusESCC1.93e-095.71e-010.0811
56941HMCESLZE7THumanEsophagusESCC2.04e-141.20e+000.0667
56941HMCESLZE8THumanEsophagusESCC1.53e-082.92e-010.067
56941HMCESLZE22THumanEsophagusESCC9.45e-063.11e-010.068
56941HMCESLZE24THumanEsophagusESCC9.33e-154.60e-010.0596
56941HMCESLZE6THumanEsophagusESCC1.46e-082.59e-010.0845
56941HMCESP1T-EHumanEsophagusESCC2.92e-105.97e-010.0875
56941HMCESP2T-EHumanEsophagusESCC2.68e-621.13e+000.1177
56941HMCESP4T-EHumanEsophagusESCC3.66e-381.22e+000.1323
56941HMCESP5T-EHumanEsophagusESCC1.09e-489.43e-010.1327
Page: 1 2 3 4 5 6 

check button Transcriptomic changes along malignancy continuum.
TissueExpression DynamicsAbbreviation
Colorectum (GSE201348)The image shows the transcriptomic changes along malignancy continuum.log2FC in expression of this searched gene in stem-like cells from each diseased tissue sample relative to stem-like cells in normal samples in each tissue plotted against the malignancy continuum. Samples are colored based on if they are from different disease stage.FAP: Familial adenomatous polyposis
CRC: Colorectal cancer
Colorectum (HTA11)The image shows the transcriptomic changes along malignancy continuum.log2FC in expression of this searched gene in stem-like cells from each diseased tissue sample relative to stem-like cells in normal samples in each tissue plotted against the malignancy continuum. Samples are colored based on if they are from different disease stage.AD: Adenomas
SER: Sessile serrated lesions
MSI-H: Microsatellite-high colorectal cancer
MSS: Microsatellite stable colorectal cancer
EsophagusThe image shows the transcriptomic changes along malignancy continuum.log2FC in expression of this searched gene in stem-like cells from each diseased tissue sample relative to stem-like cells in normal samples in each tissue plotted against the malignancy continuum. Samples are colored based on if they are from different disease stage.
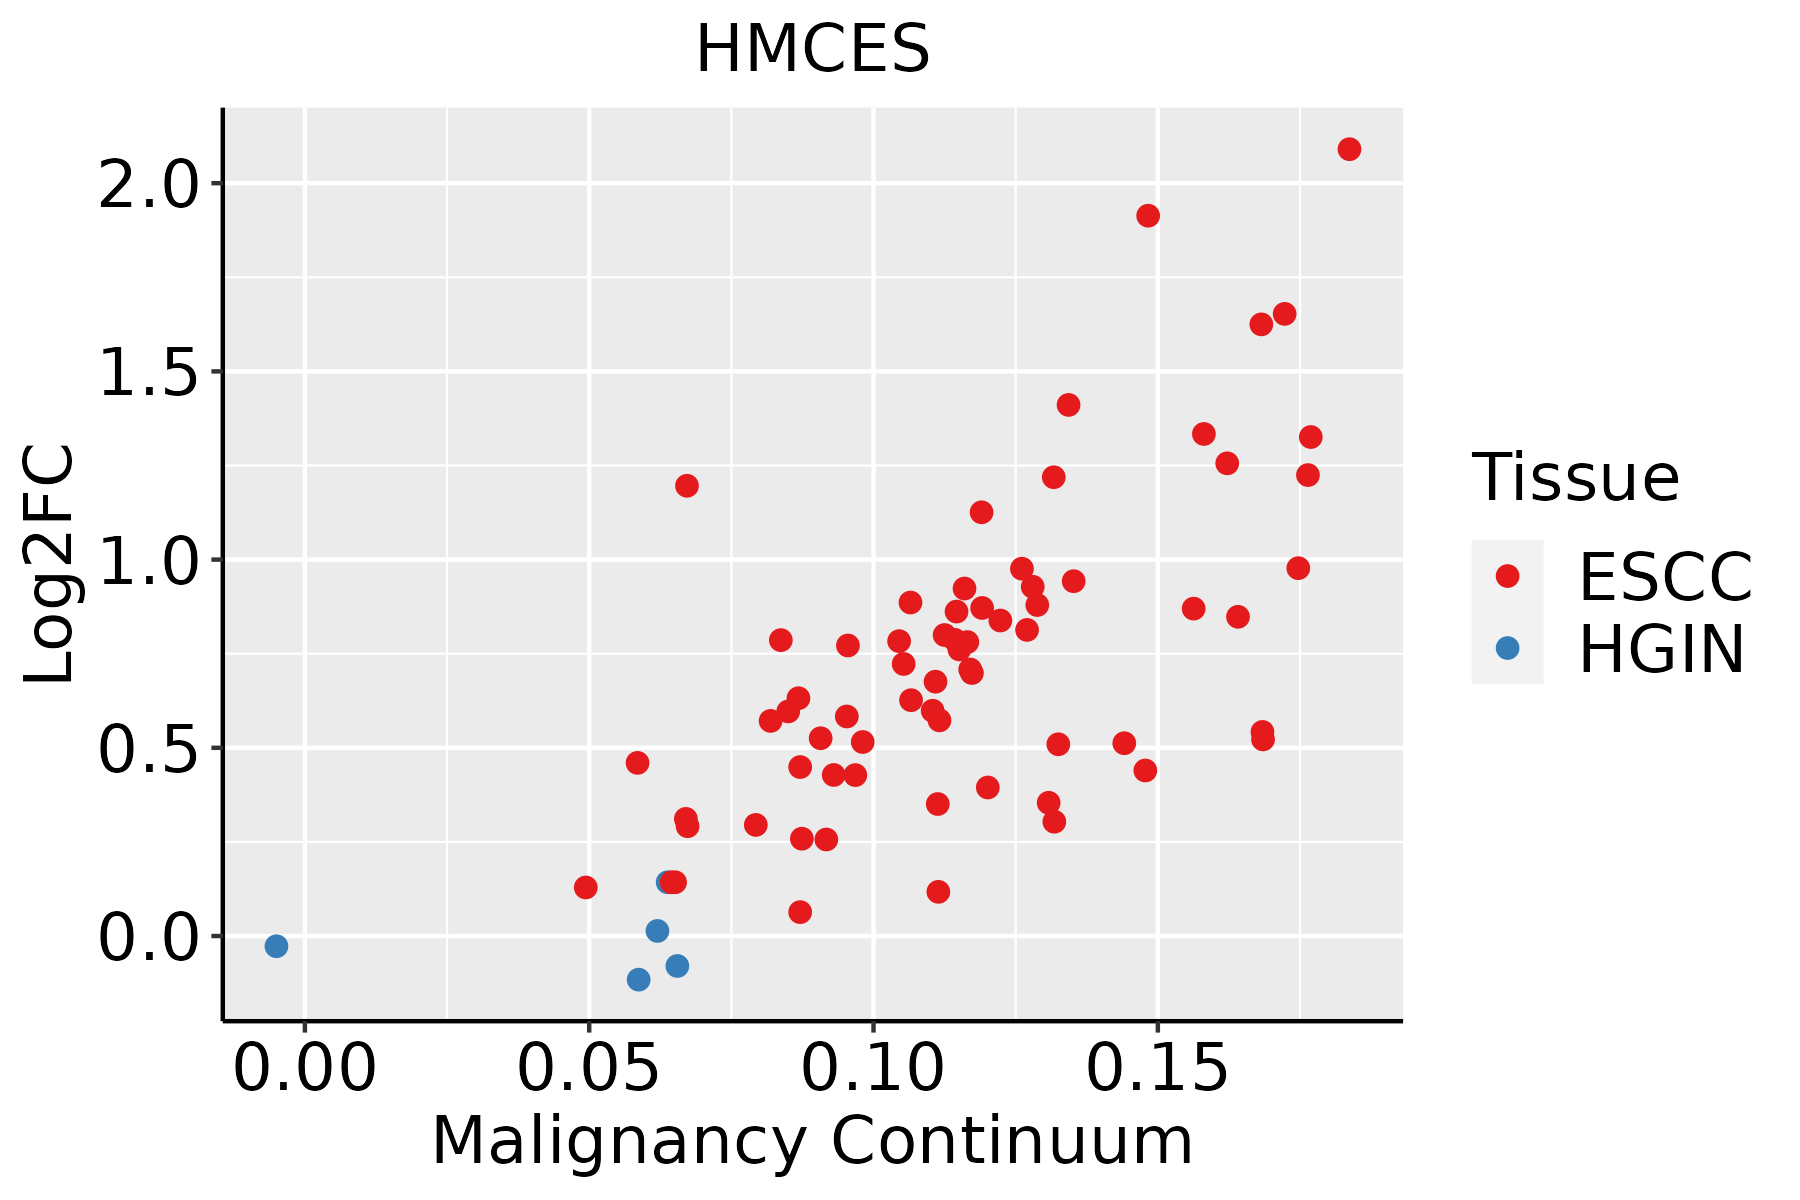
ESCC: Esophageal squamous cell carcinoma
HGIN: High-grade intraepithelial neoplasias
LGIN: Low-grade intraepithelial neoplasias
LiverThe image shows the transcriptomic changes along malignancy continuum.log2FC in expression of this searched gene in stem-like cells from each diseased tissue sample relative to stem-like cells in normal samples in each tissue plotted against the malignancy continuum. Samples are colored based on if they are from different disease stage.
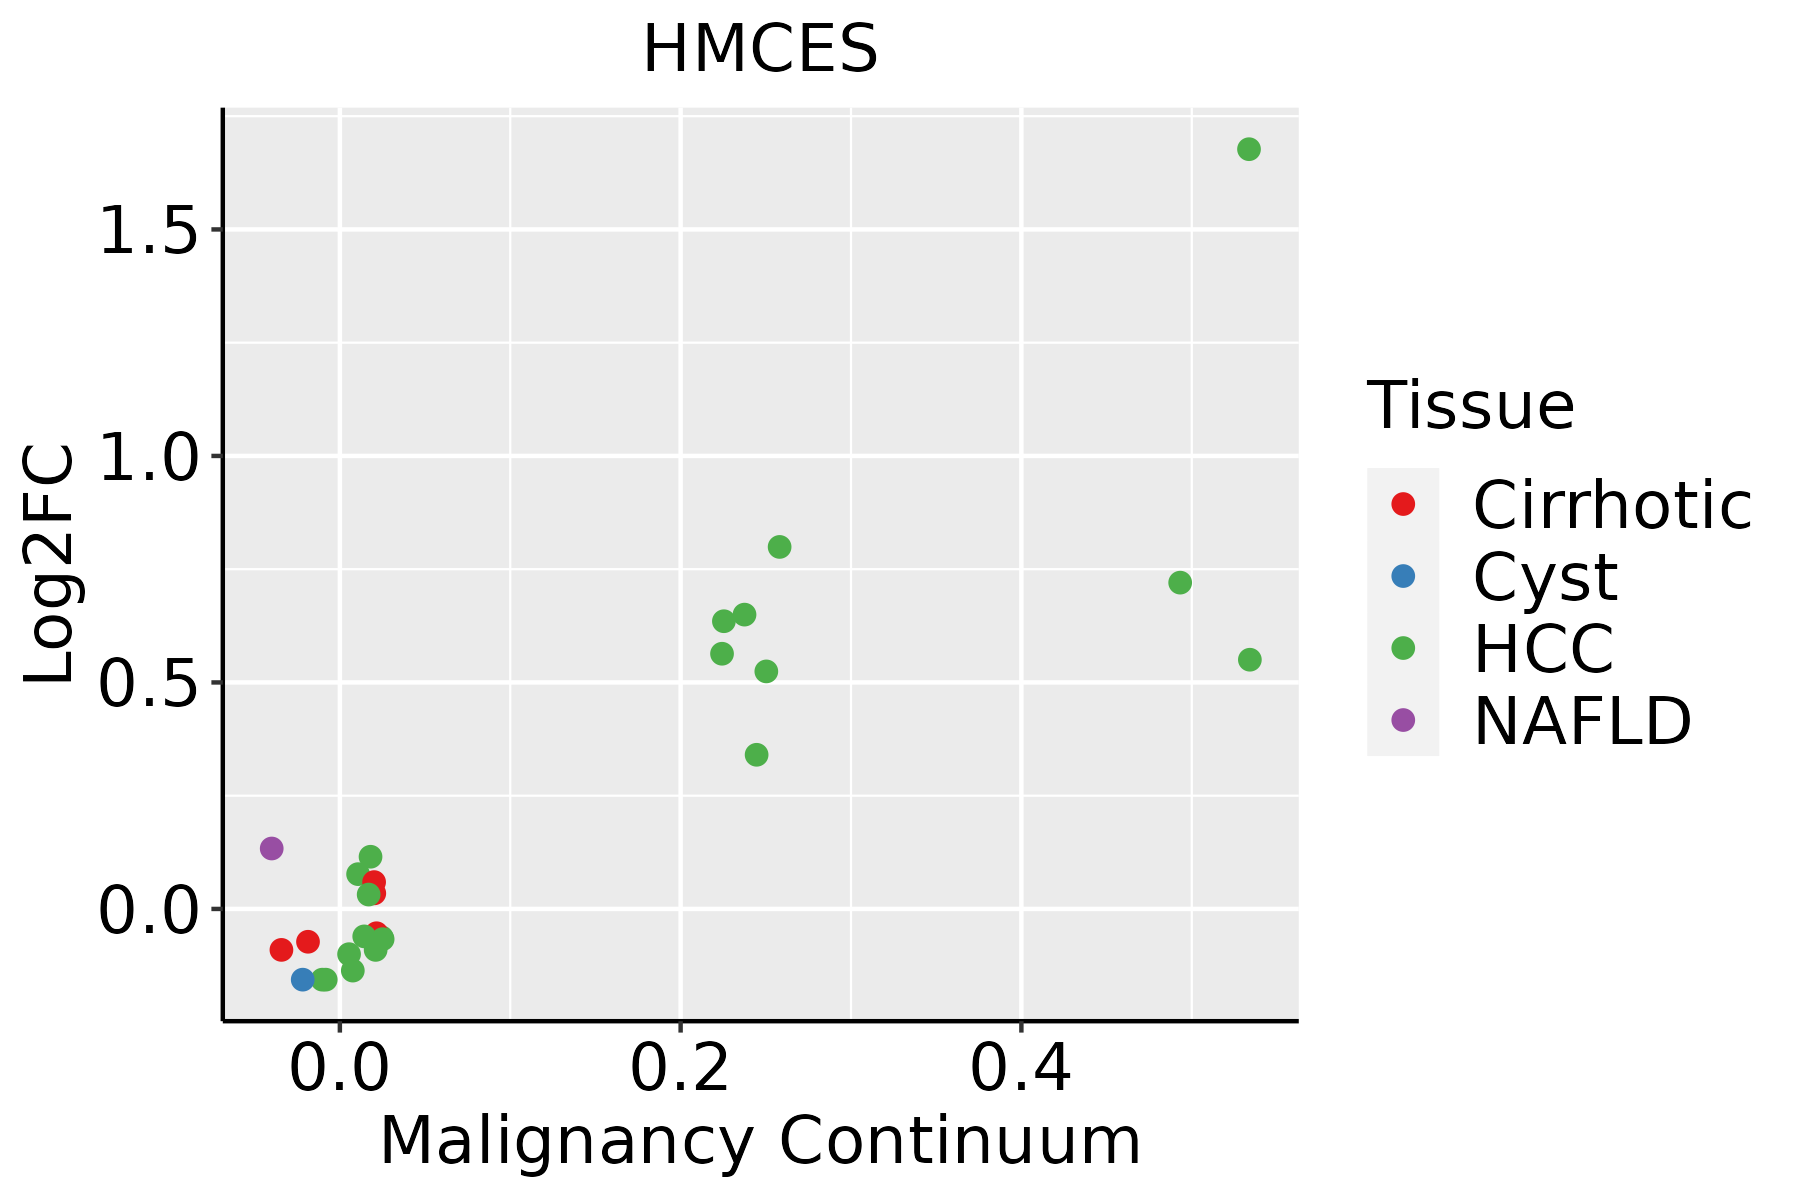
HCC: Hepatocellular carcinoma
NAFLD: Non-alcoholic fatty liver disease
Oral CavityThe image shows the transcriptomic changes along malignancy continuum.log2FC in expression of this searched gene in stem-like cells from each diseased tissue sample relative to stem-like cells in normal samples in each tissue plotted against the malignancy continuum. Samples are colored based on if they are from different disease stage.
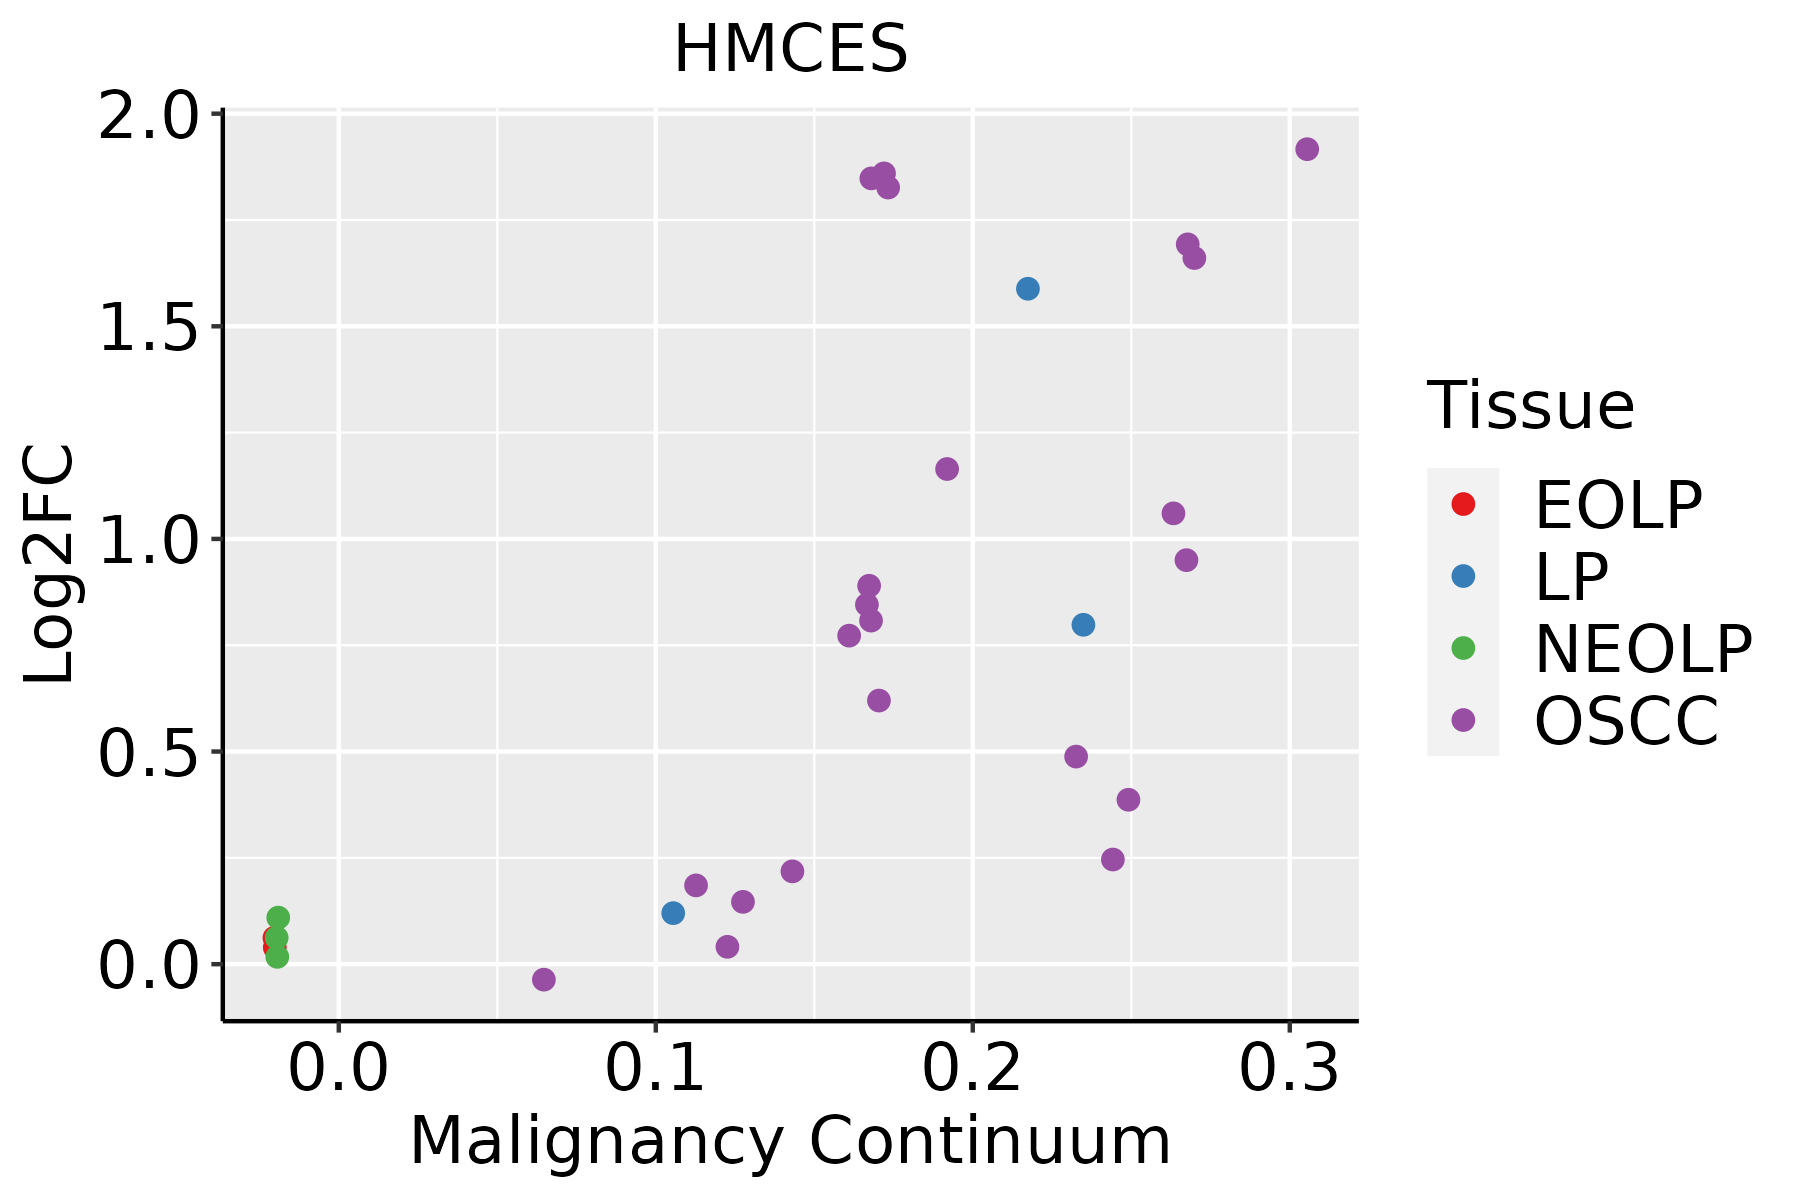
EOLP: Erosive Oral lichen planus
LP: leukoplakia
NEOLP: Non-erosive oral lichen planus
OSCC: Oral squamous cell carcinoma
SkinThe image shows the transcriptomic changes along malignancy continuum.log2FC in expression of this searched gene in stem-like cells from each diseased tissue sample relative to stem-like cells in normal samples in each tissue plotted against the malignancy continuum. Samples are colored based on if they are from different disease stage.
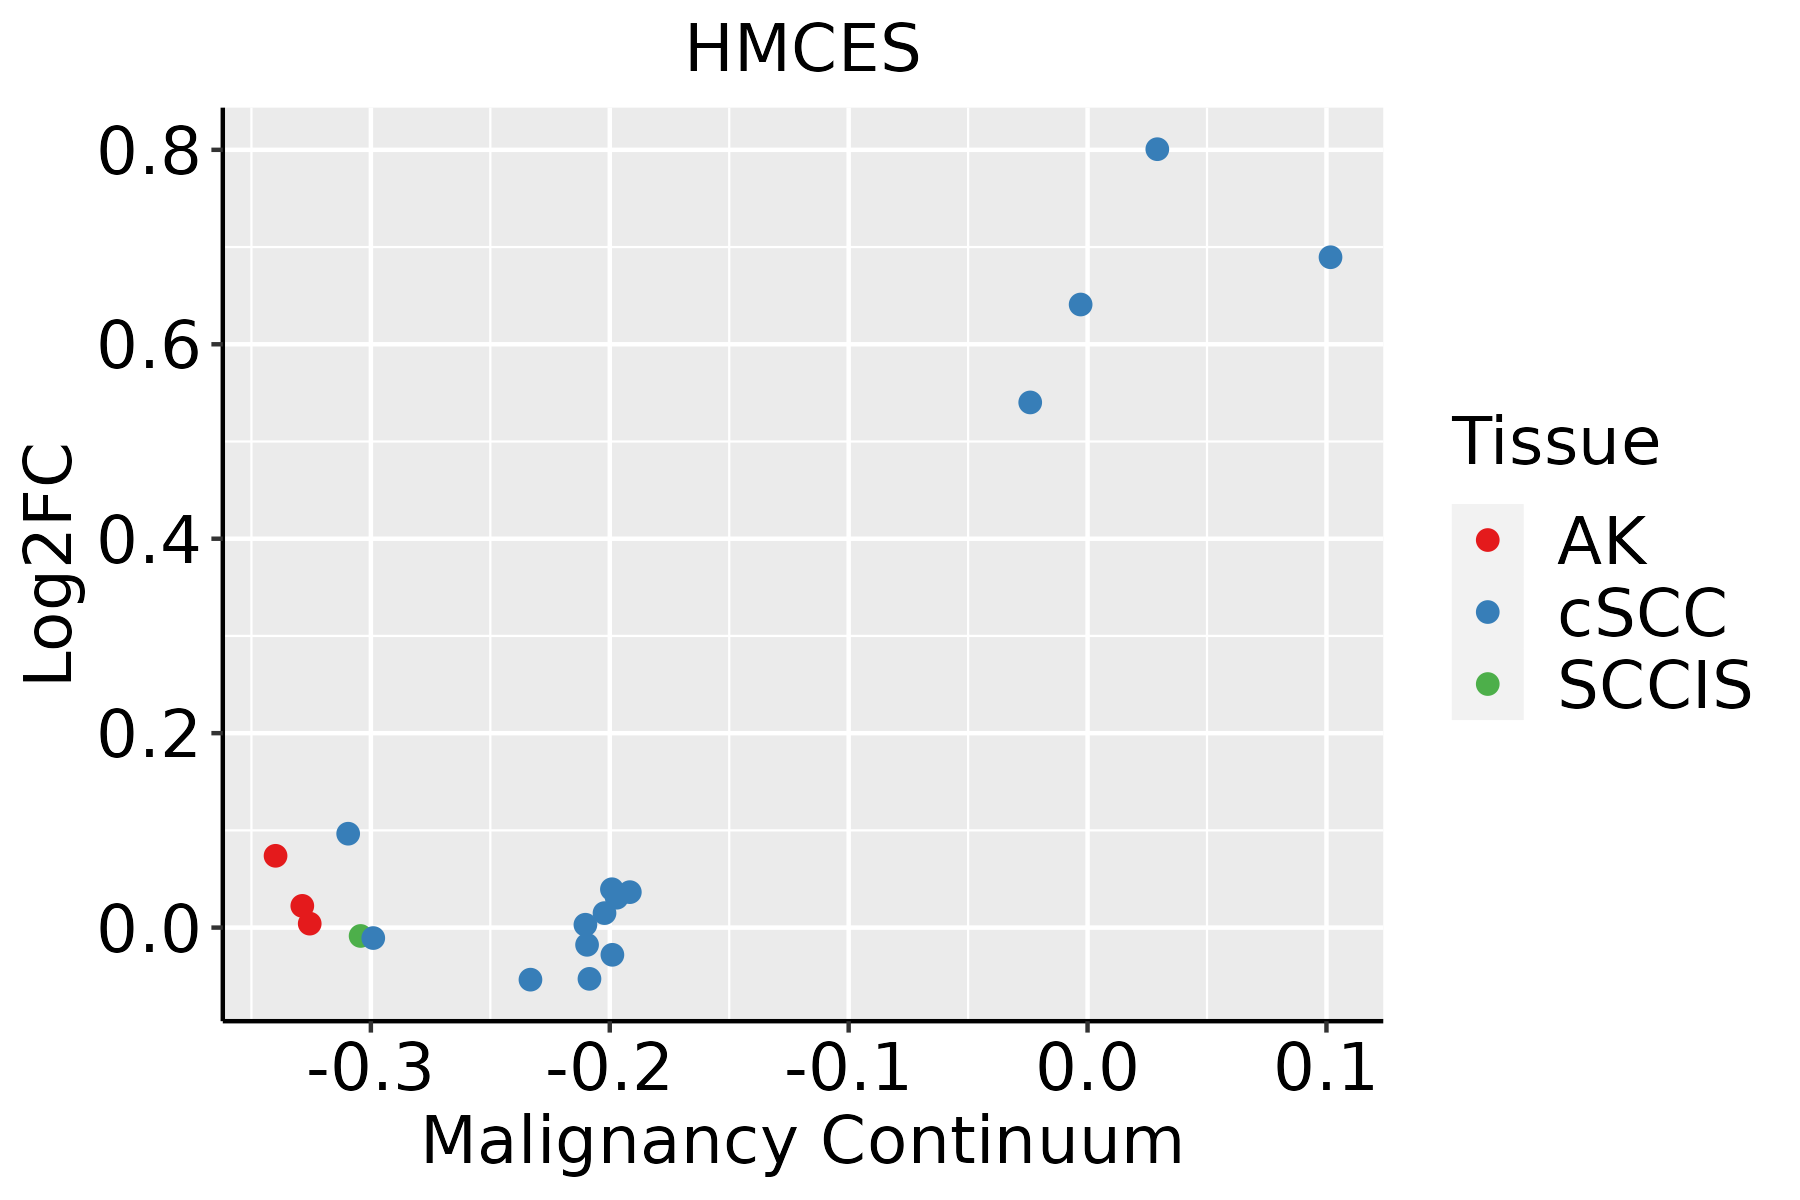
AK: Actinic keratosis
cSCC: Cutaneous squamous cell carcinoma
SCCIS:squamous cell carcinoma in situ
∗log2FC in expression of this searched gene in stem-like cells from each diseased tissue sample relative to stem-like cells in normal samples in each tissue plotted against the malignancy continuum. Samples are colored based on if they are from different disease stage.

Top

Malignant transformation related pathway analysis

check buttonFind out the enriched GO biological processes and KEGG pathways involved in transition from healthy to precancer to cancer
check button Figure of enriched GO biological processes.
TissueDisease StageEnriched GO biological Processes
ColorectumADGO analysis - Figure of enriched GO biological processes: Top 15 enriched GO BP terms are showed in the bar plot of each disease state in each tissue. Each row represents a significant GO biological process which is colored according to the -log10(p.adjust).
ColorectumSERGO analysis - Figure of enriched GO biological processes: Top 15 enriched GO BP terms are showed in the bar plot of each disease state in each tissue. Each row represents a significant GO biological process which is colored according to the -log10(p.adjust).
ColorectumMSSGO analysis - Figure of enriched GO biological processes: Top 15 enriched GO BP terms are showed in the bar plot of each disease state in each tissue. Each row represents a significant GO biological process which is colored according to the -log10(p.adjust).
ColorectumMSI-HGO analysis - Figure of enriched GO biological processes: Top 15 enriched GO BP terms are showed in the bar plot of each disease state in each tissue. Each row represents a significant GO biological process which is colored according to the -log10(p.adjust).
ColorectumFAPGO analysis - Figure of enriched GO biological processes: Top 15 enriched GO BP terms are showed in the bar plot of each disease state in each tissue. Each row represents a significant GO biological process which is colored according to the -log10(p.adjust).
∗Top 15 enriched GO BP terms are showed in the bar plot of each disease state in each tissue. Each row represents a significant GO biological process which is colored according to the -log10(p.adjust).
Page: 1 2 3 4 5 6 7 8 9 

check button Enriched GO biological processes.
GO IDTissueDisease StageDescriptionGene RatioBg Ratiopvaluep.adjustCount
GO:0051052ColorectumADregulation of DNA metabolic process116/3918359/187232.47e-071.00e-05116
GO:0051054ColorectumADpositive regulation of DNA metabolic process73/3918201/187233.27e-071.29e-0573
GO:00510541ColorectumSERpositive regulation of DNA metabolic process53/2897201/187234.51e-051.13e-0353
GO:00510521ColorectumSERregulation of DNA metabolic process83/2897359/187238.03e-051.77e-0383
GO:00510522ColorectumMSSregulation of DNA metabolic process108/3467359/187235.86e-083.10e-06108
GO:00510542ColorectumMSSpositive regulation of DNA metabolic process69/3467201/187236.33e-083.26e-0669
GO:0006302ColorectumMSSdouble-strand break repair64/3467251/187233.58e-032.65e-0264
GO:00510524ColorectumFAPregulation of DNA metabolic process84/2622359/187239.80e-074.38e-0584
GO:00510544ColorectumFAPpositive regulation of DNA metabolic process53/2622201/187232.55e-069.82e-0553
GO:005105215EsophagusESCCregulation of DNA metabolic process232/8552359/187232.40e-131.13e-11232
GO:005105417EsophagusESCCpositive regulation of DNA metabolic process139/8552201/187231.20e-114.33e-10139
GO:00063024EsophagusESCCdouble-strand break repair152/8552251/187231.33e-061.62e-05152
GO:00063101EsophagusESCCDNA recombination168/8552305/187235.58e-043.05e-03168
GO:00025622EsophagusESCCsomatic diversification of immune receptors via germline recombination within a single locus43/855266/187231.10e-035.53e-0343
GO:0006303EsophagusESCCdouble-strand break repair via nonhomologous end joining43/855266/187231.10e-035.53e-0343
GO:00164442EsophagusESCCsomatic cell DNA recombination43/855266/187231.10e-035.53e-0343
GO:00164472EsophagusESCCsomatic recombination of immunoglobulin gene segments38/855257/187231.11e-035.56e-0338
GO:00022003EsophagusESCCsomatic diversification of immune receptors49/855277/187231.12e-035.60e-0349
GO:00164452EsophagusESCCsomatic diversification of immunoglobulins43/855267/187231.73e-037.97e-0343
GO:00023815EsophagusESCCimmunoglobulin production involved in immunoglobulin-mediated immune response44/855270/187232.80e-031.19e-0244
Page: 1 2 3 

check button Enriched KEGG pathways.
Pathway IDTissueDisease StageDescriptionGene RatioBg Ratiopvaluep.adjustqvalueCount
Page: 1 

Top

Cell-cell communication analysis

check buttonIdentification of potential cell-cell interactions between two cell types and their ligand-receptor pairs for different disease states
LigandReceptorLRpairPathwayTissueDisease Stage
Page: 1 

Top

Single-cell gene regulatory network inference analysis

check buttonFind out the significant the regulons (TFs) and the target genes of each regulon across cell types for different disease states
TFCell TypeTissueDisease StageTarget GeneRSSRegulon Activity
∗The dot plots of a searched regulon are shown for all cell subpopulations in each disease state of each tissue based on the regulon specific score inferred using pySCENIC and by calculating the average expression.
Page: 1 

Top

Somatic mutation of malignant transformation related genes

check buttonAnnotation of somatic variants for genes involved in malignant transformation
Hugo SymbolVariant ClassVariant ClassificationdbSNP RSHGVScHGVSpHGVSp ShortSWISSPROTBIOTYPESIFTPolyPhenTumor Sample BarcodeTissueHistologySexAgeStageTherapy TypesDrugsOutcome
HMCESSNVMissense_Mutationc.91G>Cp.Glu31Glnp.E31QQ96FZ2protein_codingtolerated(0.17)benign(0.026)TCGA-D8-A1J9-01Breastbreast invasive carcinomaFemale<65I/IIUnknownUnknownSD
HMCESSNVMissense_Mutationc.298G>Ap.Asp100Asnp.D100NQ96FZ2protein_codingdeleterious(0)probably_damaging(0.961)TCGA-D8-A1J9-01Breastbreast invasive carcinomaFemale<65I/IIUnknownUnknownSD
HMCESSNVMissense_Mutationc.199N>Cp.Glu67Glnp.E67QQ96FZ2protein_codingdeleterious(0.01)possibly_damaging(0.875)TCGA-D8-A1JA-01Breastbreast invasive carcinomaFemale<65III/IVChemotherapyadriamycinPD
HMCESdeletionFrame_Shift_Delnovelc.158delNp.Leu54CysfsTer49p.L54Cfs*49Q96FZ2protein_codingTCGA-D8-A27V-01Breastbreast invasive carcinomaFemale<65I/IIHormone TherapytamoxiphenSD
HMCESSNVMissense_Mutationrs369963919c.1048N>Tp.Arg350Cysp.R350CQ96FZ2protein_codingdeleterious_low_confidence(0)possibly_damaging(0.53)TCGA-A6-3809-01Colorectumcolon adenocarcinomaFemale>=65I/IIUnknownUnknownSD
HMCESSNVMissense_Mutationrs367763626c.779N>Ap.Arg260Glnp.R260QQ96FZ2protein_codingdeleterious(0.01)possibly_damaging(0.847)TCGA-EI-6917-01Colorectumrectum adenocarcinomaMale<65III/IVChemotherapy5fluorouracil+oxaciplatina+l-folinianSD
HMCESinsertionFrame_Shift_Insnovelc.700_701insGp.Thr234SerfsTer32p.T234Sfs*32Q96FZ2protein_codingTCGA-AY-4070-01Colorectumcolon adenocarcinomaFemale<65III/IVChemotherapy5-fuPD
HMCESSNVMissense_Mutationnovelc.934N>Tp.Pro312Serp.P312SQ96FZ2protein_codingdeleterious(0.01)probably_damaging(0.998)TCGA-A5-A0G2-01Endometriumuterine corpus endometrioid carcinomaFemale<65III/IVUnknownUnknownSD
HMCESSNVMissense_Mutationnovelc.944C>Ap.Ser315Tyrp.S315YQ96FZ2protein_codingdeleterious(0)possibly_damaging(0.862)TCGA-AJ-A3EK-01Endometriumuterine corpus endometrioid carcinomaFemale<65I/IIChemotherapycarboplatinCR
HMCESSNVMissense_Mutationc.574N>Ap.Leu192Metp.L192MQ96FZ2protein_codingdeleterious(0.03)probably_damaging(1)TCGA-AP-A059-01Endometriumuterine corpus endometrioid carcinomaFemale>=65I/IIUnknownUnknownSD
Page: 1 2 3 

Top

Related drugs of malignant transformation related genes

check buttonIdentification of chemicals and drugs interact with genes involved in malignant transfromation
(DGIdb 4.0)
Entrez IDSymbolCategoryInteraction TypesDrug Claim NameDrug NamePMIDs
Page: 1