
|
|||||
|
 | |
| |
| |
| |
| |
| |
|
Gene: HMBS |
Gene summary for HMBS |
| Gene information | Species | Human | Gene symbol | HMBS | Gene ID | 3145 |
| Gene name | hydroxymethylbilane synthase | |
| Gene Alias | PBG-D | |
| Cytomap | 11q23.3 | |
| Gene Type | protein-coding | GO ID | GO:0006464 | UniProtAcc | P08397 |
Top |
Malignant transformation analysis |
| Identification of the aberrant gene expression in precancerous and cancerous lesions by comparing the gene expression of stem-like cells in diseased tissues with normal stem cells |
| Entrez ID | Symbol | Replicates | Species | Organ | Tissue | Adj P-value | Log2FC | Malignancy |
| 3145 | HMBS | LZE4T | Human | Esophagus | ESCC | 3.74e-02 | 1.03e-01 | 0.0811 |
| 3145 | HMBS | LZE7T | Human | Esophagus | ESCC | 3.42e-08 | 3.71e-01 | 0.0667 |
| 3145 | HMBS | LZE8T | Human | Esophagus | ESCC | 5.58e-03 | 1.28e-01 | 0.067 |
| 3145 | HMBS | LZE22D1 | Human | Esophagus | HGIN | 1.30e-14 | 6.34e-01 | 0.0595 |
| 3145 | HMBS | LZE22T | Human | Esophagus | ESCC | 1.85e-20 | 1.49e+00 | 0.068 |
| 3145 | HMBS | LZE24T | Human | Esophagus | ESCC | 7.81e-12 | 4.79e-01 | 0.0596 |
| 3145 | HMBS | LZE22D3 | Human | Esophagus | HGIN | 1.48e-02 | 7.50e-01 | 0.0653 |
| 3145 | HMBS | LZE21T | Human | Esophagus | ESCC | 2.77e-02 | 2.02e-01 | 0.0655 |
| 3145 | HMBS | LZE6T | Human | Esophagus | ESCC | 4.19e-06 | 2.23e-01 | 0.0845 |
| 3145 | HMBS | P1T-E | Human | Esophagus | ESCC | 3.61e-04 | 2.67e-01 | 0.0875 |
| 3145 | HMBS | P2T-E | Human | Esophagus | ESCC | 9.23e-07 | 1.94e-01 | 0.1177 |
| 3145 | HMBS | P4T-E | Human | Esophagus | ESCC | 3.34e-36 | 8.79e-01 | 0.1323 |
| 3145 | HMBS | P5T-E | Human | Esophagus | ESCC | 1.19e-08 | 2.36e-01 | 0.1327 |
| 3145 | HMBS | P8T-E | Human | Esophagus | ESCC | 3.88e-09 | 2.45e-01 | 0.0889 |
| 3145 | HMBS | P9T-E | Human | Esophagus | ESCC | 4.49e-17 | 4.78e-01 | 0.1131 |
| 3145 | HMBS | P10T-E | Human | Esophagus | ESCC | 4.50e-12 | 1.91e-01 | 0.116 |
| 3145 | HMBS | P11T-E | Human | Esophagus | ESCC | 9.35e-10 | 4.50e-01 | 0.1426 |
| 3145 | HMBS | P12T-E | Human | Esophagus | ESCC | 5.48e-16 | 3.74e-01 | 0.1122 |
| 3145 | HMBS | P15T-E | Human | Esophagus | ESCC | 2.80e-09 | 2.40e-01 | 0.1149 |
| 3145 | HMBS | P16T-E | Human | Esophagus | ESCC | 4.87e-16 | 3.68e-01 | 0.1153 |
| Page: 1 2 3 4 5 |
| Tissue | Expression Dynamics | Abbreviation |
| Esophagus |  | ESCC: Esophageal squamous cell carcinoma |
| HGIN: High-grade intraepithelial neoplasias | ||
| LGIN: Low-grade intraepithelial neoplasias | ||
| Liver | 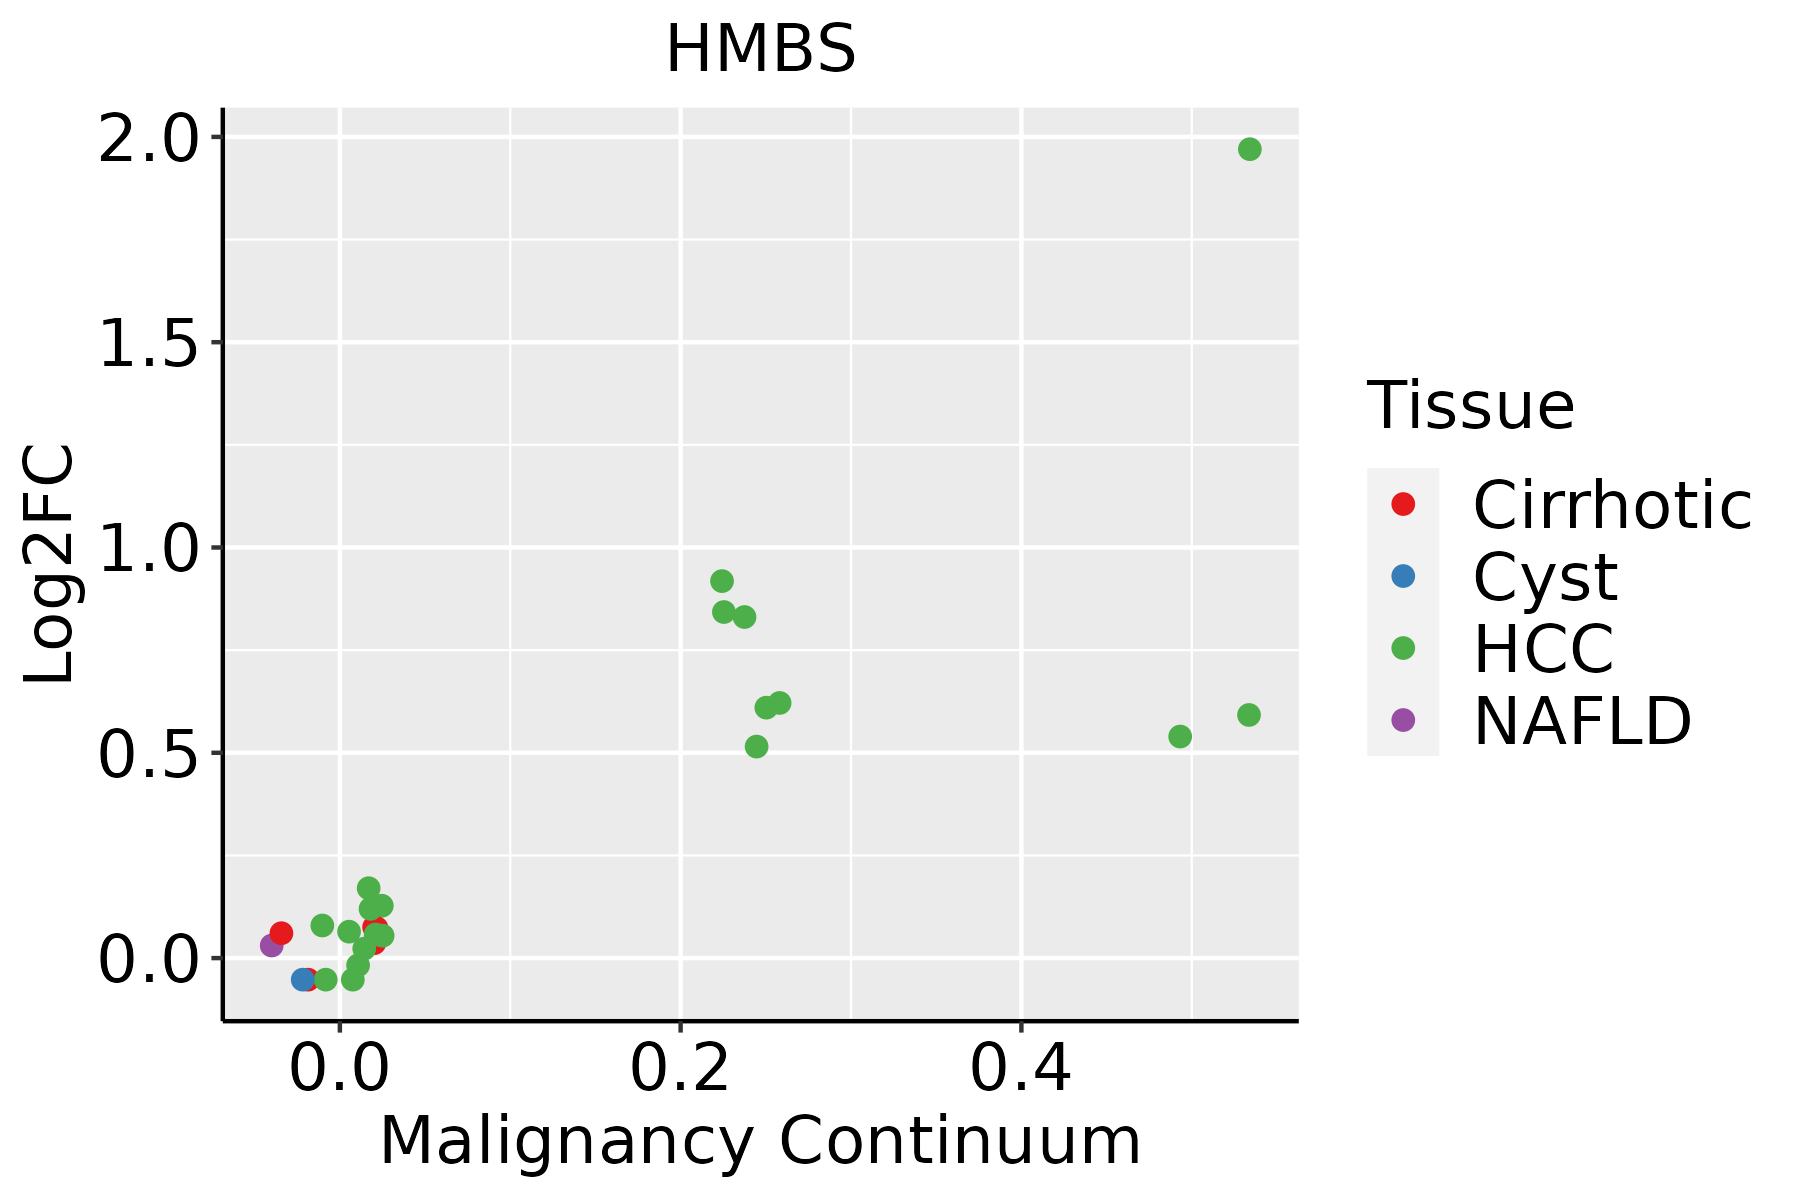 | HCC: Hepatocellular carcinoma |
| NAFLD: Non-alcoholic fatty liver disease | ||
| Oral Cavity |  | EOLP: Erosive Oral lichen planus |
| LP: leukoplakia | ||
| NEOLP: Non-erosive oral lichen planus | ||
| OSCC: Oral squamous cell carcinoma | ||
| Skin | 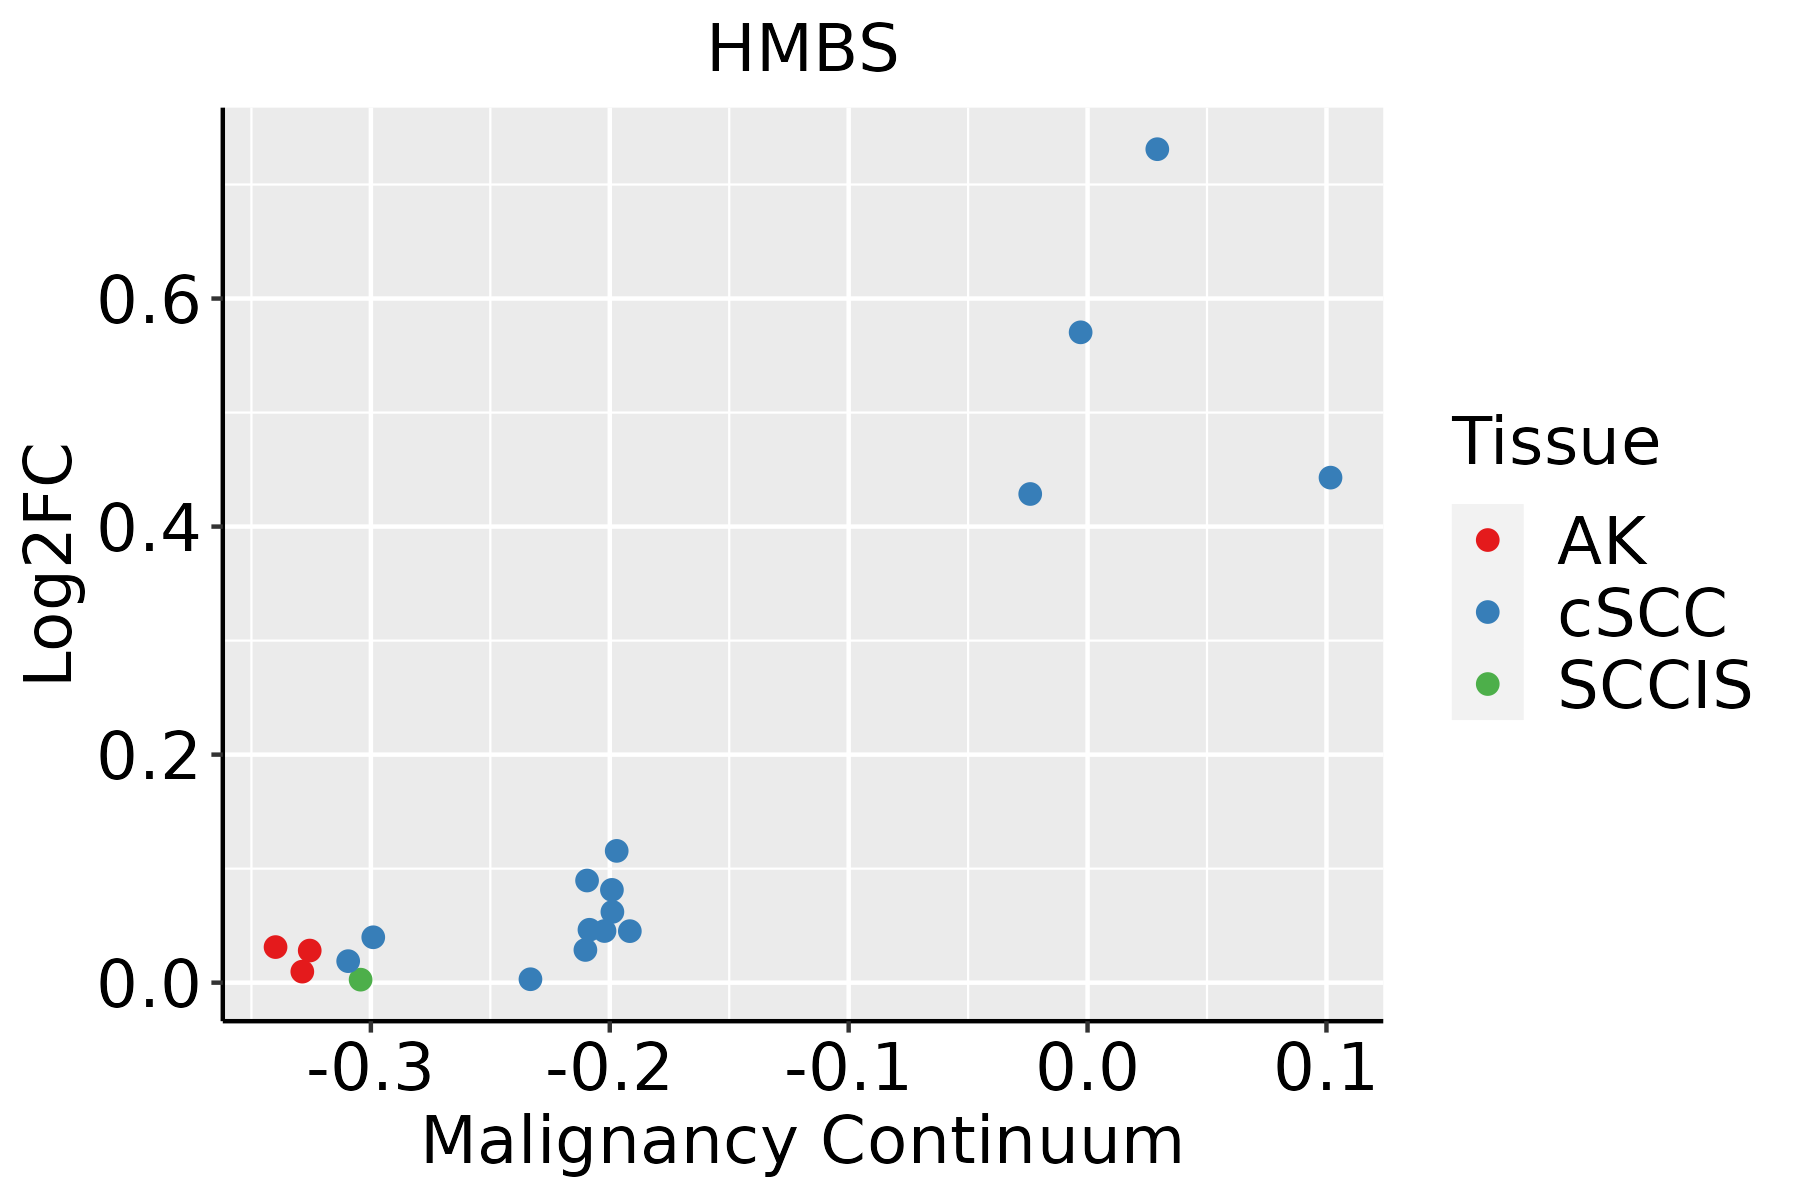 | AK: Actinic keratosis |
| cSCC: Cutaneous squamous cell carcinoma | ||
| SCCIS:squamous cell carcinoma in situ |
| ∗log2FC in expression of this searched gene in stem-like cells from each diseased tissue sample relative to stem-like cells in normal samples in each tissue plotted against the malignancy continuum. Samples are colored based on if they are from different disease stage. |
Top |
Malignant transformation related pathway analysis |
| Find out the enriched GO biological processes and KEGG pathways involved in transition from healthy to precancer to cancer |
| Tissue | Disease Stage | Enriched GO biological Processes |
| Colorectum | AD |  |
| Colorectum | SER |  |
| Colorectum | MSS |  |
| Colorectum | MSI-H |  |
| Colorectum | FAP |  |
| ∗Top 15 enriched GO BP terms are showed in the bar plot of each disease state in each tissue. Each row represents a significant GO biological process which is colored according to the -log10(p.adjust). |
| Page: 1 2 3 4 5 6 7 8 9 |
| GO ID | Tissue | Disease Stage | Description | Gene Ratio | Bg Ratio | pvalue | p.adjust | Count |
| GO:00067791 | Esophagus | ESCC | porphyrin-containing compound biosynthetic process | 23/8552 | 31/18723 | 1.20e-03 | 5.88e-03 | 23 |
| GO:00330141 | Esophagus | ESCC | tetrapyrrole biosynthetic process | 23/8552 | 31/18723 | 1.20e-03 | 5.88e-03 | 23 |
| GO:00461482 | Esophagus | ESCC | pigment biosynthetic process | 40/8552 | 62/18723 | 2.14e-03 | 9.54e-03 | 40 |
| GO:00067832 | Esophagus | ESCC | heme biosynthetic process | 20/8552 | 27/18723 | 2.61e-03 | 1.11e-02 | 20 |
| GO:00330132 | Esophagus | ESCC | tetrapyrrole metabolic process | 37/8552 | 59/18723 | 6.23e-03 | 2.29e-02 | 37 |
| GO:00424401 | Esophagus | ESCC | pigment metabolic process | 50/8552 | 84/18723 | 7.34e-03 | 2.64e-02 | 50 |
| GO:00421681 | Esophagus | ESCC | heme metabolic process | 27/8552 | 42/18723 | 1.16e-02 | 3.90e-02 | 27 |
| GO:0042168 | Liver | HCC | heme metabolic process | 30/7958 | 42/18723 | 1.40e-04 | 1.13e-03 | 30 |
| GO:00330131 | Liver | HCC | tetrapyrrole metabolic process | 39/7958 | 59/18723 | 2.14e-04 | 1.63e-03 | 39 |
| GO:00067781 | Liver | HCC | porphyrin-containing compound metabolic process | 33/7958 | 49/18723 | 3.86e-04 | 2.62e-03 | 33 |
| GO:0042440 | Liver | HCC | pigment metabolic process | 51/7958 | 84/18723 | 5.74e-04 | 3.65e-03 | 51 |
| GO:0006783 | Liver | HCC | heme biosynthetic process | 19/7958 | 27/18723 | 3.18e-03 | 1.47e-02 | 19 |
| GO:0006779 | Liver | HCC | porphyrin-containing compound biosynthetic process | 21/7958 | 31/18723 | 4.01e-03 | 1.76e-02 | 21 |
| GO:0033014 | Liver | HCC | tetrapyrrole biosynthetic process | 21/7958 | 31/18723 | 4.01e-03 | 1.76e-02 | 21 |
| GO:0046148 | Liver | HCC | pigment biosynthetic process | 37/7958 | 62/18723 | 4.73e-03 | 2.02e-02 | 37 |
| GO:00461481 | Oral cavity | OSCC | pigment biosynthetic process | 36/7305 | 62/18723 | 1.82e-03 | 8.57e-03 | 36 |
| GO:00067831 | Oral cavity | OSCC | heme biosynthetic process | 17/7305 | 27/18723 | 1.01e-02 | 3.49e-02 | 17 |
| GO:0018198 | Oral cavity | LP | peptidyl-cysteine modification | 20/4623 | 49/18723 | 9.35e-03 | 4.98e-02 | 20 |
| Page: 1 |
| Pathway ID | Tissue | Disease Stage | Description | Gene Ratio | Bg Ratio | pvalue | p.adjust | qvalue | Count |
| hsa012405 | Esophagus | ESCC | Biosynthesis of cofactors | 97/4205 | 153/8465 | 3.88e-04 | 1.35e-03 | 6.94e-04 | 97 |
| hsa0124012 | Esophagus | ESCC | Biosynthesis of cofactors | 97/4205 | 153/8465 | 3.88e-04 | 1.35e-03 | 6.94e-04 | 97 |
| hsa012402 | Liver | HCC | Biosynthesis of cofactors | 103/4020 | 153/8465 | 4.67e-07 | 5.05e-06 | 2.81e-06 | 103 |
| hsa012403 | Liver | HCC | Biosynthesis of cofactors | 103/4020 | 153/8465 | 4.67e-07 | 5.05e-06 | 2.81e-06 | 103 |
| hsa012404 | Oral cavity | OSCC | Biosynthesis of cofactors | 88/3704 | 153/8465 | 3.84e-04 | 1.20e-03 | 6.12e-04 | 88 |
| hsa0124011 | Oral cavity | OSCC | Biosynthesis of cofactors | 88/3704 | 153/8465 | 3.84e-04 | 1.20e-03 | 6.12e-04 | 88 |
| hsa0124021 | Oral cavity | LP | Biosynthesis of cofactors | 57/2418 | 153/8465 | 1.17e-02 | 3.91e-02 | 2.52e-02 | 57 |
| hsa0124031 | Oral cavity | LP | Biosynthesis of cofactors | 57/2418 | 153/8465 | 1.17e-02 | 3.91e-02 | 2.52e-02 | 57 |
| Page: 1 |
Top |
Cell-cell communication analysis |
| Identification of potential cell-cell interactions between two cell types and their ligand-receptor pairs for different disease states |
| Ligand | Receptor | LRpair | Pathway | Tissue | Disease Stage |
| Page: 1 |
Top |
Single-cell gene regulatory network inference analysis |
| Find out the significant the regulons (TFs) and the target genes of each regulon across cell types for different disease states |
| TF | Cell Type | Tissue | Disease Stage | Target Gene | RSS | Regulon Activity |
| ∗The dot plots of a searched regulon are shown for all cell subpopulations in each disease state of each tissue based on the regulon specific score inferred using pySCENIC and by calculating the average expression. |
| Page: 1 |
Top |
Somatic mutation of malignant transformation related genes |
| Annotation of somatic variants for genes involved in malignant transformation |
| Hugo Symbol | Variant Class | Variant Classification | dbSNP RS | HGVSc | HGVSp | HGVSp Short | SWISSPROT | BIOTYPE | SIFT | PolyPhen | Tumor Sample Barcode | Tissue | Histology | Sex | Age | Stage | Therapy Types | Drugs | Outcome |
| HMBS | SNV | Missense_Mutation | c.41A>G | p.Asn14Ser | p.N14S | P08397 | protein_coding | tolerated(0.12) | benign(0) | TCGA-C8-A3M7-01 | Breast | breast invasive carcinoma | Female | <65 | III/IV | Unknown | Unknown | PD | |
| HMBS | SNV | Missense_Mutation | rs757873631 | c.961N>T | p.Arg321Cys | p.R321C | P08397 | protein_coding | tolerated(0.06) | benign(0.007) | TCGA-D8-A13Y-01 | Breast | breast invasive carcinoma | Female | <65 | I/II | Chemotherapy | doxorubicin | SD |
| HMBS | insertion | In_Frame_Ins | novel | c.492_493insCTCAGCCTGAACCAGACAAACACCCTGGACTTTTCAGTTCCA | p.Arg164_Ser165insLeuSerLeuAsnGlnThrAsnThrLeuAspPheSerValPro | p.R164_S165insLSLNQTNTLDFSVP | P08397 | protein_coding | TCGA-A2-A0CP-01 | Breast | breast invasive carcinoma | Female | <65 | I/II | Chemotherapy | cytoxan | SD | ||
| HMBS | insertion | In_Frame_Ins | novel | c.631_632insTGGACGAGCAGCAGGAGTTCA | p.Cys211delinsLeuAspGluGlnGlnGluPheSer | p.C211delinsLDEQQEFS | P08397 | protein_coding | TCGA-BH-A0AY-01 | Breast | breast invasive carcinoma | Female | <65 | I/II | Chemotherapy | SD | |||
| HMBS | insertion | Nonsense_Mutation | novel | c.869_870insATAGA | p.Ser290ArgfsTer2 | p.S290Rfs*2 | P08397 | protein_coding | TCGA-BH-A0HL-01 | Breast | breast invasive carcinoma | Female | <65 | I/II | Chemotherapy | cyclophosphamide | SD | ||
| HMBS | insertion | Frame_Shift_Ins | novel | c.870_871insGAAAAAGAAAATAATG | p.Ile291GlufsTer21 | p.I291Efs*21 | P08397 | protein_coding | TCGA-BH-A0HL-01 | Breast | breast invasive carcinoma | Female | <65 | I/II | Chemotherapy | cyclophosphamide | SD | ||
| HMBS | insertion | Frame_Shift_Ins | novel | c.962_963dupGT | p.Asn322ValfsTer23 | p.N322Vfs*23 | P08397 | protein_coding | TCGA-GM-A2DB-01 | Breast | breast invasive carcinoma | Female | <65 | I/II | Chemotherapy | taxol | CR | ||
| HMBS | SNV | Missense_Mutation | novel | c.959N>T | p.Ala320Val | p.A320V | P08397 | protein_coding | deleterious(0.04) | probably_damaging(0.999) | TCGA-2W-A8YY-01 | Cervix | cervical & endocervical cancer | Female | <65 | I/II | Chemotherapy | cisplatin | CR |
| HMBS | SNV | Missense_Mutation | c.799N>A | p.Val267Met | p.V267M | P08397 | protein_coding | deleterious(0) | probably_damaging(1) | TCGA-AA-3715-01 | Colorectum | colon adenocarcinoma | Male | >=65 | I/II | Unknown | Unknown | PD | |
| HMBS | SNV | Missense_Mutation | rs201909197 | c.737G>A | p.Arg246His | p.R246H | P08397 | protein_coding | deleterious(0.02) | possibly_damaging(0.863) | TCGA-AA-3977-01 | Colorectum | colon adenocarcinoma | Male | >=65 | I/II | Unknown | Unknown | SD |
| Page: 1 2 3 4 5 |
Top |
Related drugs of malignant transformation related genes |
| Identification of chemicals and drugs interact with genes involved in malignant transfromation |
| (DGIdb 4.0) |
| Entrez ID | Symbol | Category | Interaction Types | Drug Claim Name | Drug Name | PMIDs |
| 3145 | HMBS | ENZYME | P-9808 | |||
| 3145 | HMBS | ENZYME | RAAV5-PBGD | |||
| 3145 | HMBS | ENZYME | givosiran | GIVOSIRAN | ||
| 3145 | HMBS | ENZYME | Givosiran | GIVOSIRAN |
| Page: 1 |

Copyright 2023-Present -The University of Texas Health Science Center at Houston |