
|
|||||
|
 | |
| |
| |
| |
| |
| |
|
Gene: HLF |
Gene summary for HLF |
| Gene information | Species | Human | Gene symbol | HLF | Gene ID | 3131 |
| Gene name | HLF transcription factor, PAR bZIP family member | |
| Gene Alias | HLF | |
| Cytomap | 17q22 | |
| Gene Type | protein-coding | GO ID | GO:0006139 | UniProtAcc | Q16534 |
Top |
Malignant transformation analysis |
| Identification of the aberrant gene expression in precancerous and cancerous lesions by comparing the gene expression of stem-like cells in diseased tissues with normal stem cells |
| Entrez ID | Symbol | Replicates | Species | Organ | Tissue | Adj P-value | Log2FC | Malignancy |
| 3131 | HLF | NAFLD1 | Human | Liver | NAFLD | 7.33e-16 | 1.29e+00 | -0.04 |
| 3131 | HLF | S43 | Human | Liver | Cirrhotic | 4.65e-06 | -1.37e-01 | -0.0187 |
| 3131 | HLF | HCC1_Meng | Human | Liver | HCC | 9.82e-59 | -1.53e-01 | 0.0246 |
| 3131 | HLF | HCC2_Meng | Human | Liver | HCC | 1.75e-07 | -2.90e-01 | 0.0107 |
| 3131 | HLF | cirrhotic1 | Human | Liver | Cirrhotic | 4.81e-06 | -2.44e-01 | 0.0202 |
| 3131 | HLF | cirrhotic2 | Human | Liver | Cirrhotic | 5.20e-04 | -2.41e-01 | 0.0201 |
| 3131 | HLF | HCC1 | Human | Liver | HCC | 9.11e-15 | 4.22e+00 | 0.5336 |
| 3131 | HLF | HCC2 | Human | Liver | HCC | 5.56e-09 | 2.81e+00 | 0.5341 |
| 3131 | HLF | Pt13.a | Human | Liver | HCC | 2.64e-03 | -2.14e-01 | 0.021 |
| 3131 | HLF | Pt13.b | Human | Liver | HCC | 1.04e-02 | -1.92e-01 | 0.0251 |
| 3131 | HLF | Pt14.b | Human | Liver | HCC | 7.55e-04 | 4.50e-02 | 0.018 |
| 3131 | HLF | Pt14.d | Human | Liver | HCC | 2.97e-02 | -1.71e-01 | 0.0143 |
| 3131 | HLF | C46 | Human | Oral cavity | OSCC | 1.29e-22 | 7.07e-01 | 0.1673 |
| 3131 | HLF | LN22 | Human | Oral cavity | OSCC | 4.63e-02 | 6.18e-01 | 0.1733 |
| 3131 | HLF | LN46 | Human | Oral cavity | OSCC | 8.56e-11 | 7.12e-01 | 0.1666 |
| 3131 | HLF | SYSMH4 | Human | Oral cavity | OSCC | 3.64e-04 | 7.90e-02 | 0.1226 |
| Page: 1 |
| Tissue | Expression Dynamics | Abbreviation |
| Liver | 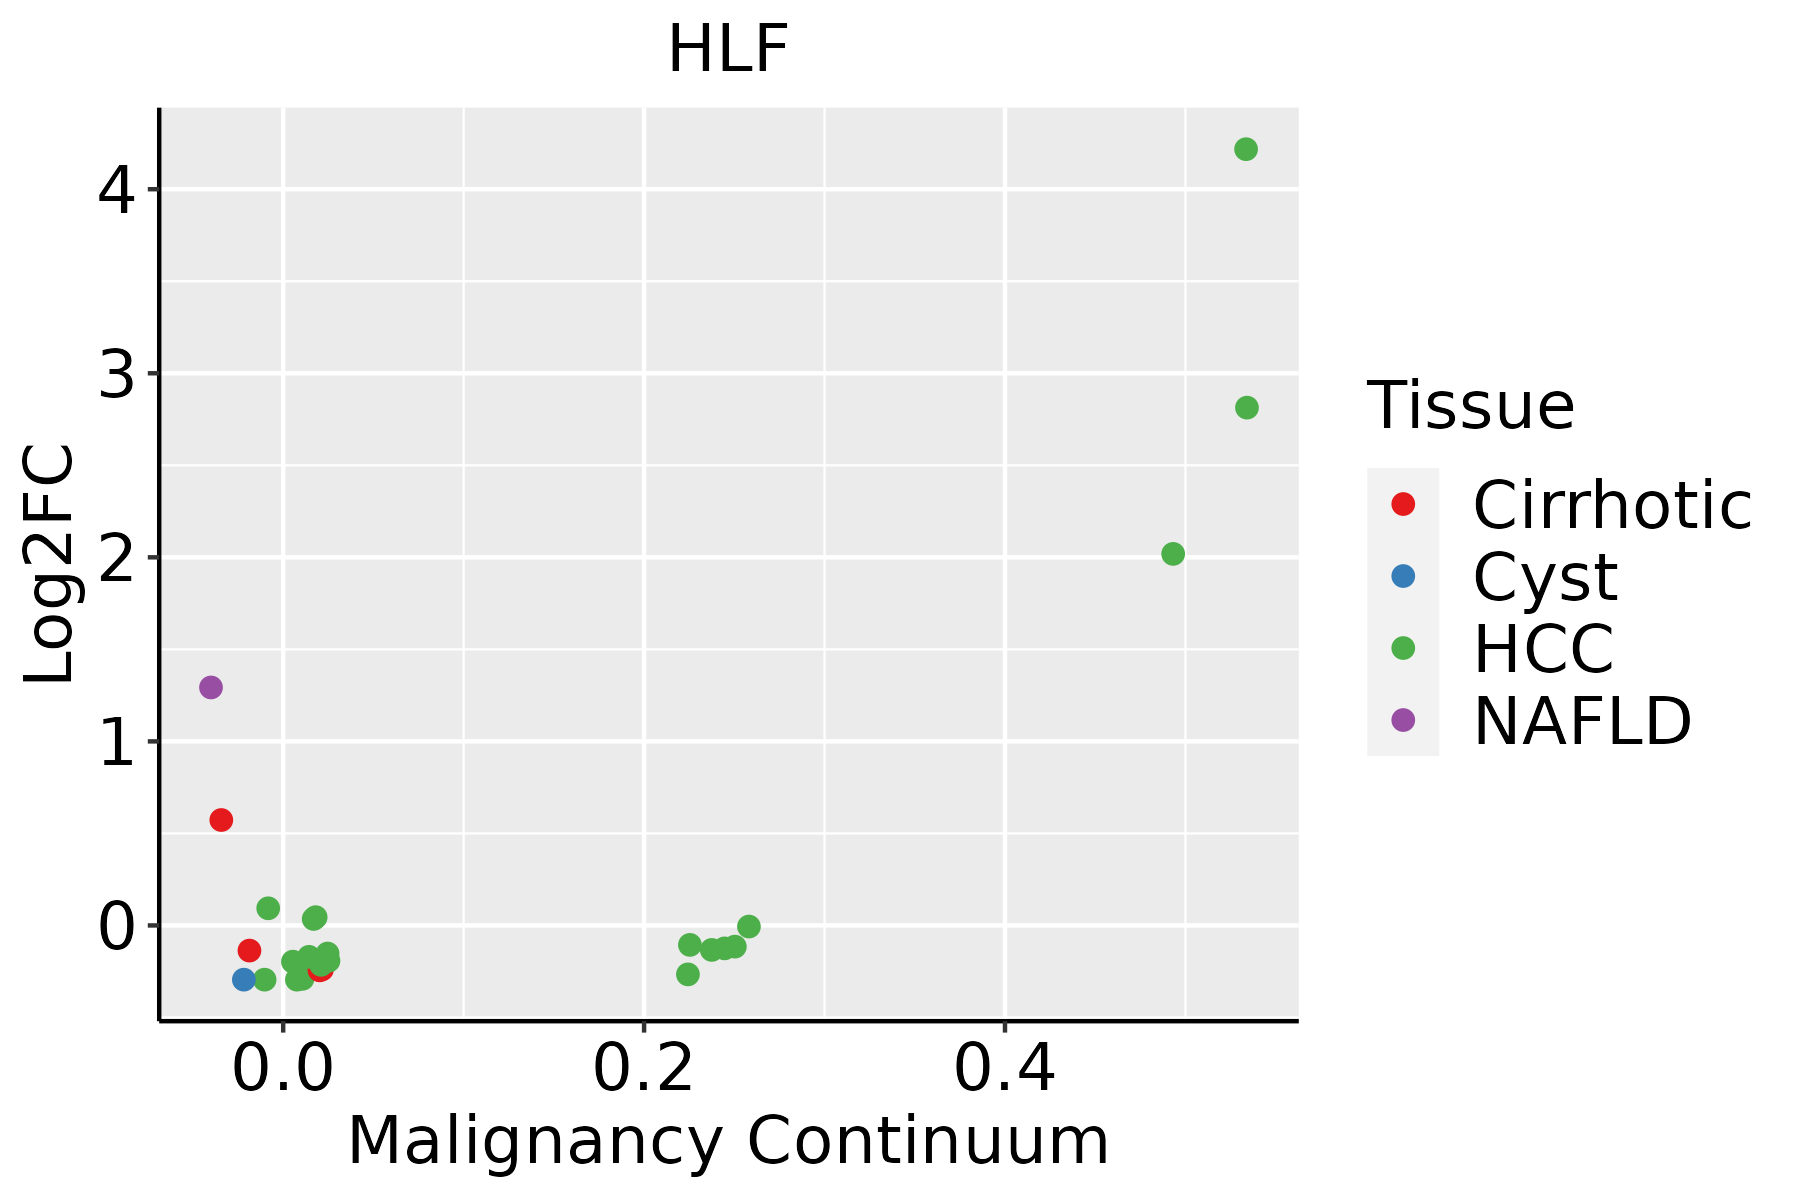 | HCC: Hepatocellular carcinoma |
| NAFLD: Non-alcoholic fatty liver disease | ||
| Oral Cavity | 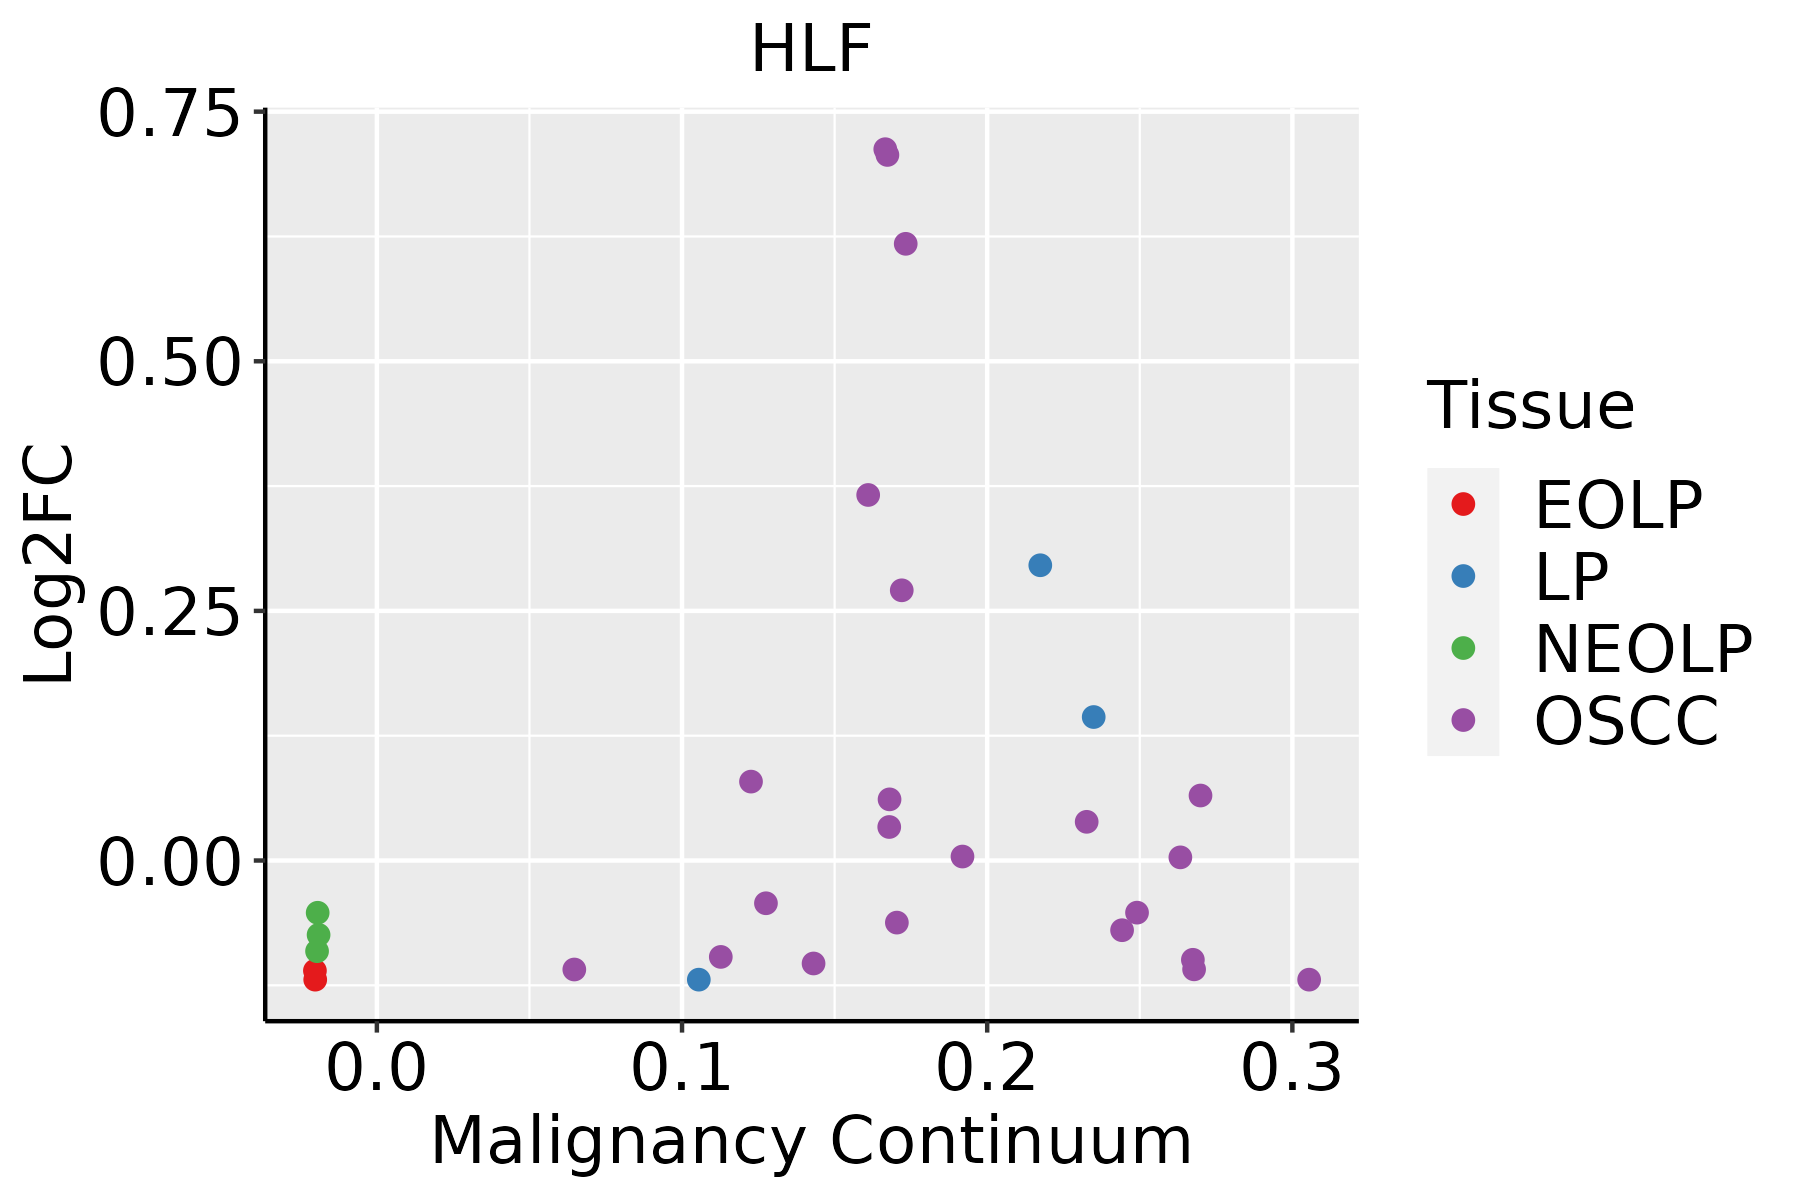 | EOLP: Erosive Oral lichen planus |
| LP: leukoplakia | ||
| NEOLP: Non-erosive oral lichen planus | ||
| OSCC: Oral squamous cell carcinoma |
| ∗log2FC in expression of this searched gene in stem-like cells from each diseased tissue sample relative to stem-like cells in normal samples in each tissue plotted against the malignancy continuum. Samples are colored based on if they are from different disease stage. |
Top |
Malignant transformation related pathway analysis |
| Find out the enriched GO biological processes and KEGG pathways involved in transition from healthy to precancer to cancer |
| Tissue | Disease Stage | Enriched GO biological Processes |
| Colorectum | AD |  |
| Colorectum | SER |  |
| Colorectum | MSS |  |
| Colorectum | MSI-H |  |
| Colorectum | FAP |  |
| ∗Top 15 enriched GO BP terms are showed in the bar plot of each disease state in each tissue. Each row represents a significant GO biological process which is colored according to the -log10(p.adjust). |
| Page: 1 2 3 4 5 6 7 8 9 |
| GO ID | Tissue | Disease Stage | Description | Gene Ratio | Bg Ratio | pvalue | p.adjust | Count |
| GO:00485115 | Liver | NAFLD | rhythmic process | 56/1882 | 298/18723 | 3.03e-06 | 1.23e-04 | 56 |
| GO:004851111 | Liver | Cirrhotic | rhythmic process | 103/4634 | 298/18723 | 8.47e-05 | 9.19e-04 | 103 |
| GO:004851121 | Liver | HCC | rhythmic process | 156/7958 | 298/18723 | 3.54e-04 | 2.46e-03 | 156 |
| GO:004851116 | Oral cavity | OSCC | rhythmic process | 157/7305 | 298/18723 | 1.00e-06 | 1.36e-05 | 157 |
| GO:00605378 | Oral cavity | OSCC | muscle tissue development | 185/7305 | 403/18723 | 2.60e-03 | 1.14e-02 | 185 |
| GO:00147067 | Oral cavity | OSCC | striated muscle tissue development | 174/7305 | 384/18723 | 6.45e-03 | 2.40e-02 | 174 |
| Page: 1 |
| Pathway ID | Tissue | Disease Stage | Description | Gene Ratio | Bg Ratio | pvalue | p.adjust | qvalue | Count |
| Page: 1 |
Top |
Cell-cell communication analysis |
| Identification of potential cell-cell interactions between two cell types and their ligand-receptor pairs for different disease states |
| Ligand | Receptor | LRpair | Pathway | Tissue | Disease Stage |
| Page: 1 |
Top |
Single-cell gene regulatory network inference analysis |
| Find out the significant the regulons (TFs) and the target genes of each regulon across cell types for different disease states |
| TF | Cell Type | Tissue | Disease Stage | Target Gene | RSS | Regulon Activity |
| HLF | TREG | Cervix | N_HPV | RORA,TNFRSF25,TNF, etc. | 6.73e-02 |  |
| HLF | TFH | Endometrium | ADJ | RORA,CCR6,RIOK2, etc. | 7.94e-02 |  |
| HLF | TH17 | Endometrium | ADJ | RORA,CCR6,RIOK2, etc. | 7.74e-02 | |
| HLF | TFH | Endometrium | AEH | RORA,CCR6,RIOK2, etc. | 2.12e-01 |  |
| HLF | TH17 | Endometrium | AEH | RORA,CCR6,RIOK2, etc. | 1.05e-01 | |
| HLF | TFH | Endometrium | EEC | RORA,CCR6,RIOK2, etc. | 7.99e-02 |  |
| HLF | PVA | Endometrium | ADJ | ABCG2,TXNIP,MAOA, etc. | 4.86e-01 | |
| HLF | PVA | Endometrium | AEH | ABCG2,TXNIP,MAOA, etc. | 4.42e-01 | |
| HLF | PVA | Endometrium | EEC | ABCG2,TXNIP,MAOA, etc. | 2.83e-01 | |
| HLF | MVA | Endometrium | EEC | ABCG2,TXNIP,MAOA, etc. | 1.74e-01 | |
| ∗The dot plots of a searched regulon are shown for all cell subpopulations in each disease state of each tissue based on the regulon specific score inferred using pySCENIC and by calculating the average expression. |
| Page: 1 2 |
Top |
Somatic mutation of malignant transformation related genes |
| Annotation of somatic variants for genes involved in malignant transformation |
| Hugo Symbol | Variant Class | Variant Classification | dbSNP RS | HGVSc | HGVSp | HGVSp Short | SWISSPROT | BIOTYPE | SIFT | PolyPhen | Tumor Sample Barcode | Tissue | Histology | Sex | Age | Stage | Therapy Types | Drugs | Outcome |
| HLF | SNV | Missense_Mutation | novel | c.748N>C | p.Glu250Gln | p.E250Q | Q16534 | protein_coding | deleterious(0) | probably_damaging(0.999) | TCGA-3C-AALI-01 | Breast | breast invasive carcinoma | Female | <65 | I/II | Unspecific | Poly E | Complete Response |
| HLF | SNV | Missense_Mutation | c.727C>G | p.Arg243Gly | p.R243G | Q16534 | protein_coding | deleterious(0) | probably_damaging(0.999) | TCGA-A7-A0CE-01 | Breast | breast invasive carcinoma | Female | <65 | I/II | Chemotherapy | adriamycin | SD | |
| HLF | SNV | Missense_Mutation | c.9N>T | p.Lys3Asn | p.K3N | Q16534 | protein_coding | deleterious_low_confidence(0) | probably_damaging(0.986) | TCGA-AN-A0FW-01 | Breast | breast invasive carcinoma | Female | >=65 | III/IV | Unknown | Unknown | SD | |
| HLF | SNV | Missense_Mutation | c.773C>T | p.Ser258Leu | p.S258L | Q16534 | protein_coding | deleterious(0) | benign(0.37) | TCGA-BH-A0BL-01 | Breast | breast invasive carcinoma | Female | <65 | I/II | Chemotherapy | adriamycin | CR | |
| HLF | SNV | Missense_Mutation | c.773N>G | p.Ser258Trp | p.S258W | Q16534 | protein_coding | deleterious(0) | probably_damaging(0.976) | TCGA-E2-A158-01 | Breast | breast invasive carcinoma | Female | <65 | I/II | Chemotherapy | arimidex | SD | |
| HLF | SNV | Missense_Mutation | c.428N>A | p.Cys143Tyr | p.C143Y | Q16534 | protein_coding | tolerated(0.57) | benign(0.365) | TCGA-E2-A1B1-01 | Breast | breast invasive carcinoma | Female | <65 | I/II | Other, specify in notesbiphosphonate | zoledronic | SD | |
| HLF | insertion | In_Frame_Ins | novel | c.575_576insCTATAC | p.Met192delinsIleTyrThr | p.M192delinsIYT | Q16534 | protein_coding | TCGA-B6-A0IK-01 | Breast | breast invasive carcinoma | Female | <65 | III/IV | Unknown | Unknown | PD | ||
| HLF | insertion | Frame_Shift_Ins | novel | c.577_578insGGTTCTGCAAAAATGCAAACCTCTGTCTTGTC | p.Phe193TrpfsTer24 | p.F193Wfs*24 | Q16534 | protein_coding | TCGA-B6-A0IK-01 | Breast | breast invasive carcinoma | Female | <65 | III/IV | Unknown | Unknown | PD | ||
| HLF | SNV | Missense_Mutation | novel | c.836N>A | p.Gly279Asp | p.G279D | Q16534 | protein_coding | deleterious(0) | probably_damaging(0.997) | TCGA-2W-A8YY-01 | Cervix | cervical & endocervical cancer | Female | <65 | I/II | Chemotherapy | cisplatin | CR |
| HLF | SNV | Missense_Mutation | novel | c.624G>T | p.Gln208His | p.Q208H | Q16534 | protein_coding | deleterious(0) | probably_damaging(0.993) | TCGA-AA-3947-01 | Colorectum | colon adenocarcinoma | Female | <65 | I/II | Unknown | Unknown | SD |
| Page: 1 2 3 4 5 |
Top |
Related drugs of malignant transformation related genes |
| Identification of chemicals and drugs interact with genes involved in malignant transfromation |
| (DGIdb 4.0) |
| Entrez ID | Symbol | Category | Interaction Types | Drug Claim Name | Drug Name | PMIDs |
| Page: 1 |

Copyright 2023-Present -The University of Texas Health Science Center at Houston |