
|
|||||
|
 | |
| |
| |
| |
| |
| |
|
Gene: HLCS |
Gene summary for HLCS |
| Gene information | Species | Human | Gene symbol | HLCS | Gene ID | 3141 |
| Gene name | holocarboxylase synthetase | |
| Gene Alias | HCS | |
| Cytomap | 21q22.13 | |
| Gene Type | protein-coding | GO ID | GO:0006082 | UniProtAcc | P50747 |
Top |
Malignant transformation analysis |
| Identification of the aberrant gene expression in precancerous and cancerous lesions by comparing the gene expression of stem-like cells in diseased tissues with normal stem cells |
| Entrez ID | Symbol | Replicates | Species | Organ | Tissue | Adj P-value | Log2FC | Malignancy |
| 3141 | HLCS | CCI_1 | Human | Cervix | CC | 1.87e-02 | 5.08e-01 | 0.528 |
| 3141 | HLCS | CCI_2 | Human | Cervix | CC | 1.27e-11 | 1.01e+00 | 0.5249 |
| 3141 | HLCS | CCI_3 | Human | Cervix | CC | 4.58e-16 | 8.86e-01 | 0.516 |
| 3141 | HLCS | A015-C-203 | Human | Colorectum | FAP | 1.65e-18 | -4.01e-01 | -0.1294 |
| 3141 | HLCS | A014-C-040 | Human | Colorectum | FAP | 3.66e-05 | -5.67e-01 | -0.1184 |
| 3141 | HLCS | A002-C-201 | Human | Colorectum | FAP | 2.85e-04 | -2.04e-01 | 0.0324 |
| 3141 | HLCS | A001-C-108 | Human | Colorectum | FAP | 2.49e-08 | -1.38e-01 | -0.0272 |
| 3141 | HLCS | A002-C-205 | Human | Colorectum | FAP | 7.96e-10 | -3.11e-01 | -0.1236 |
| 3141 | HLCS | A015-C-005 | Human | Colorectum | FAP | 3.49e-03 | -3.64e-01 | -0.0336 |
| 3141 | HLCS | A015-C-006 | Human | Colorectum | FAP | 6.51e-07 | -3.42e-01 | -0.0994 |
| 3141 | HLCS | A015-C-106 | Human | Colorectum | FAP | 2.97e-07 | -2.79e-01 | -0.0511 |
| 3141 | HLCS | A002-C-114 | Human | Colorectum | FAP | 3.57e-08 | -3.44e-01 | -0.1561 |
| 3141 | HLCS | A015-C-104 | Human | Colorectum | FAP | 1.55e-22 | -4.31e-01 | -0.1899 |
| 3141 | HLCS | A001-C-014 | Human | Colorectum | FAP | 1.81e-08 | -3.04e-01 | 0.0135 |
| 3141 | HLCS | A002-C-016 | Human | Colorectum | FAP | 1.70e-17 | -2.95e-01 | 0.0521 |
| 3141 | HLCS | A015-C-002 | Human | Colorectum | FAP | 8.29e-05 | -3.21e-01 | -0.0763 |
| 3141 | HLCS | A001-C-203 | Human | Colorectum | FAP | 8.52e-04 | -1.30e-01 | -0.0481 |
| 3141 | HLCS | A002-C-116 | Human | Colorectum | FAP | 2.79e-18 | -3.36e-01 | -0.0452 |
| 3141 | HLCS | A014-C-008 | Human | Colorectum | FAP | 1.04e-06 | -4.18e-01 | -0.191 |
| 3141 | HLCS | A018-E-020 | Human | Colorectum | FAP | 9.33e-10 | -3.90e-01 | -0.2034 |
| Page: 1 2 3 |
| Tissue | Expression Dynamics | Abbreviation |
| Cervix | 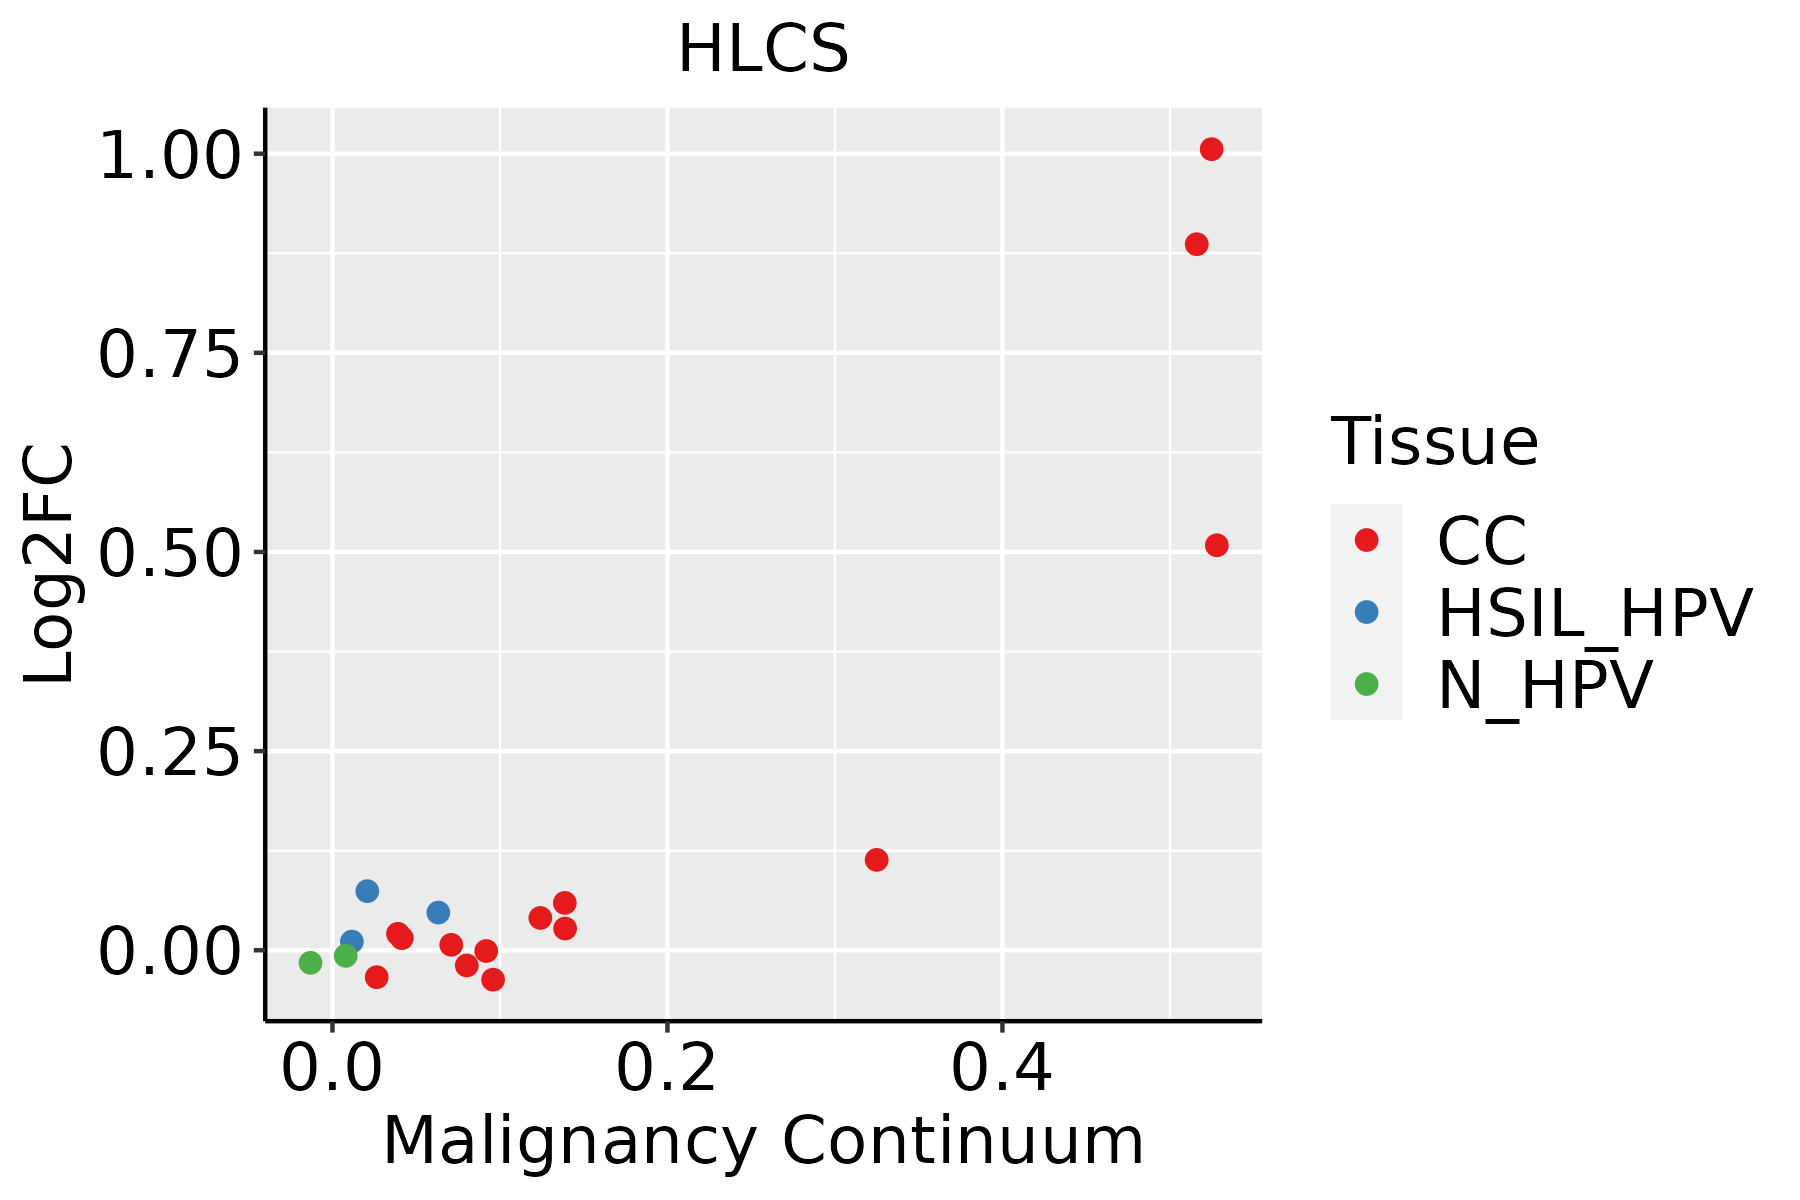 | CC: Cervix cancer |
| HSIL_HPV: HPV-infected high-grade squamous intraepithelial lesions | ||
| N_HPV: HPV-infected normal cervix | ||
| Colorectum (GSE201348) |  | FAP: Familial adenomatous polyposis |
| CRC: Colorectal cancer | ||
| Colorectum (HTA11) |  | AD: Adenomas |
| SER: Sessile serrated lesions | ||
| MSI-H: Microsatellite-high colorectal cancer | ||
| MSS: Microsatellite stable colorectal cancer | ||
| Lung | 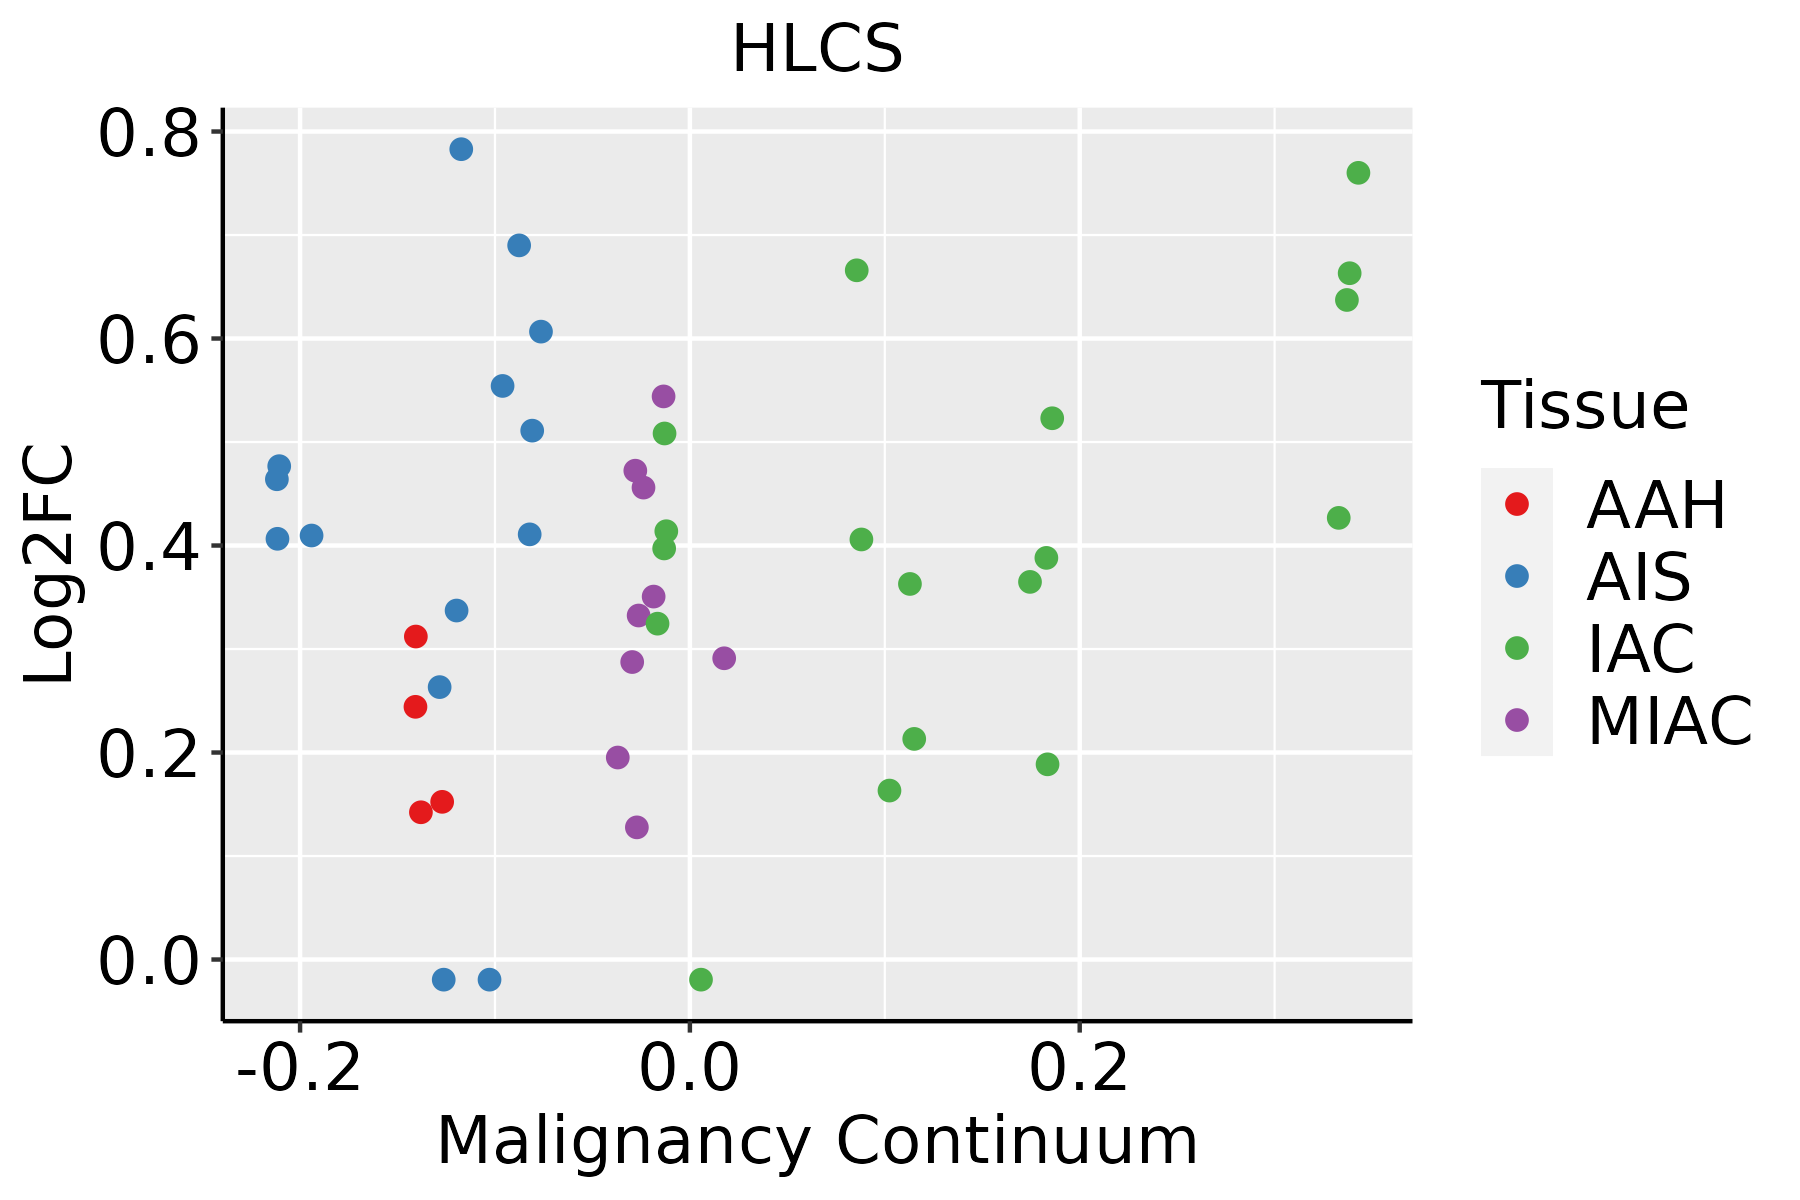 | AAH: Atypical adenomatous hyperplasia |
| AIS: Adenocarcinoma in situ | ||
| IAC: Invasive lung adenocarcinoma | ||
| MIA: Minimally invasive adenocarcinoma |
| ∗log2FC in expression of this searched gene in stem-like cells from each diseased tissue sample relative to stem-like cells in normal samples in each tissue plotted against the malignancy continuum. Samples are colored based on if they are from different disease stage. |
Top |
Malignant transformation related pathway analysis |
| Find out the enriched GO biological processes and KEGG pathways involved in transition from healthy to precancer to cancer |
| Tissue | Disease Stage | Enriched GO biological Processes |
| Colorectum | AD |  |
| Colorectum | SER |  |
| Colorectum | MSS |  |
| Colorectum | MSI-H |  |
| Colorectum | FAP |  |
| ∗Top 15 enriched GO BP terms are showed in the bar plot of each disease state in each tissue. Each row represents a significant GO biological process which is colored according to the -log10(p.adjust). |
| Page: 1 2 3 4 5 6 7 8 9 |
| GO ID | Tissue | Disease Stage | Description | Gene Ratio | Bg Ratio | pvalue | p.adjust | Count |
| GO:003166710 | Cervix | CC | response to nutrient levels | 92/2311 | 474/18723 | 5.80e-06 | 1.42e-04 | 92 |
| GO:00165705 | Cervix | CC | histone modification | 84/2311 | 463/18723 | 1.70e-04 | 2.01e-03 | 84 |
| GO:00075846 | Cervix | CC | response to nutrient | 33/2311 | 174/18723 | 7.65e-03 | 4.07e-02 | 33 |
| GO:00165701 | Colorectum | FAP | histone modification | 94/2622 | 463/18723 | 1.06e-04 | 1.76e-03 | 94 |
| GO:00316673 | Colorectum | FAP | response to nutrient levels | 95/2622 | 474/18723 | 1.59e-04 | 2.43e-03 | 95 |
| GO:00165702 | Colorectum | CRC | histone modification | 75/2078 | 463/18723 | 4.95e-04 | 7.06e-03 | 75 |
| GO:00165704 | Lung | IAC | histone modification | 93/2061 | 463/18723 | 5.41e-09 | 8.03e-07 | 93 |
| GO:00316678 | Lung | IAC | response to nutrient levels | 76/2061 | 474/18723 | 4.87e-04 | 7.08e-03 | 76 |
| GO:001657012 | Lung | AIS | histone modification | 81/1849 | 463/18723 | 2.30e-07 | 2.16e-05 | 81 |
| GO:003166713 | Lung | AIS | response to nutrient levels | 64/1849 | 474/18723 | 6.13e-03 | 4.98e-02 | 64 |
| Page: 1 |
| Pathway ID | Tissue | Disease Stage | Description | Gene Ratio | Bg Ratio | pvalue | p.adjust | qvalue | Count |
| Page: 1 |
Top |
Cell-cell communication analysis |
| Identification of potential cell-cell interactions between two cell types and their ligand-receptor pairs for different disease states |
| Ligand | Receptor | LRpair | Pathway | Tissue | Disease Stage |
| Page: 1 |
Top |
Single-cell gene regulatory network inference analysis |
| Find out the significant the regulons (TFs) and the target genes of each regulon across cell types for different disease states |
| TF | Cell Type | Tissue | Disease Stage | Target Gene | RSS | Regulon Activity |
| ∗The dot plots of a searched regulon are shown for all cell subpopulations in each disease state of each tissue based on the regulon specific score inferred using pySCENIC and by calculating the average expression. |
| Page: 1 |
Top |
Somatic mutation of malignant transformation related genes |
| Annotation of somatic variants for genes involved in malignant transformation |
| Hugo Symbol | Variant Class | Variant Classification | dbSNP RS | HGVSc | HGVSp | HGVSp Short | SWISSPROT | BIOTYPE | SIFT | PolyPhen | Tumor Sample Barcode | Tissue | Histology | Sex | Age | Stage | Therapy Types | Drugs | Outcome |
| HLCS | SNV | Missense_Mutation | rs751093392 | c.835N>A | p.Glu279Lys | p.E279K | P50747 | protein_coding | deleterious(0.04) | benign(0.122) | TCGA-BH-A0W4-01 | Breast | breast invasive carcinoma | Female | <65 | I/II | Unknown | Unknown | SD |
| HLCS | SNV | Missense_Mutation | c.703G>A | p.Ala235Thr | p.A235T | P50747 | protein_coding | tolerated(0.63) | benign(0.003) | TCGA-BH-A18G-01 | Breast | breast invasive carcinoma | Female | >=65 | I/II | Unknown | Unknown | SD | |
| HLCS | insertion | Frame_Shift_Ins | novel | c.259_260insT | p.Gly87ValfsTer4 | p.G87Vfs*4 | P50747 | protein_coding | TCGA-B6-A0IB-01 | Breast | breast invasive carcinoma | Female | <65 | III/IV | Unknown | Unknown | PD | ||
| HLCS | insertion | In_Frame_Ins | novel | c.258_259insTTGTCCACCGGAGAGGAGAGGTACACATTTAGG | p.Ala86_Gly87insLeuSerThrGlyGluGluArgTyrThrPheArg | p.A86_G87insLSTGEERYTFR | P50747 | protein_coding | TCGA-B6-A0IB-01 | Breast | breast invasive carcinoma | Female | <65 | III/IV | Unknown | Unknown | PD | ||
| HLCS | deletion | Frame_Shift_Del | novel | c.1242delN | p.Lys414AsnfsTer17 | p.K414Nfs*17 | P50747 | protein_coding | TCGA-EW-A2FV-01 | Breast | breast invasive carcinoma | Female | <65 | III/IV | Chemotherapy | docetaxel | SD | ||
| HLCS | SNV | Missense_Mutation | c.1084N>A | p.Glu362Lys | p.E362K | P50747 | protein_coding | deleterious(0.02) | benign(0.075) | TCGA-C5-A1M7-01 | Cervix | cervical & endocervical cancer | Female | <65 | I/II | Unknown | Unknown | SD | |
| HLCS | SNV | Missense_Mutation | rs149399432 | c.1900G>A | p.Asp634Asn | p.D634N | P50747 | protein_coding | deleterious(0.01) | probably_damaging(0.922) | TCGA-DS-A5RQ-01 | Cervix | cervical & endocervical cancer | Female | >=65 | I/II | Chemotherapy | cisplatin | CR |
| HLCS | SNV | Missense_Mutation | c.1833C>G | p.Ile611Met | p.I611M | P50747 | protein_coding | deleterious(0) | benign(0.428) | TCGA-IR-A3LK-01 | Cervix | cervical & endocervical cancer | Female | >=65 | I/II | Chemotherapy | cisplatin | PD | |
| HLCS | SNV | Missense_Mutation | rs200629955 | c.886G>A | p.Val296Ile | p.V296I | P50747 | protein_coding | tolerated(0.21) | benign(0) | TCGA-VS-A8EB-01 | Cervix | cervical & endocervical cancer | Female | <65 | III/IV | Unknown | Unknown | PD |
| HLCS | SNV | Missense_Mutation | rs543256742 | c.1774N>A | p.Glu592Lys | p.E592K | P50747 | protein_coding | tolerated(0.35) | benign(0.253) | TCGA-VS-A8QA-01 | Cervix | cervical & endocervical cancer | Female | <65 | I/II | Unknown | Unknown | SD |
| Page: 1 2 3 4 5 6 7 |
Top |
Related drugs of malignant transformation related genes |
| Identification of chemicals and drugs interact with genes involved in malignant transfromation |
| (DGIdb 4.0) |
| Entrez ID | Symbol | Category | Interaction Types | Drug Claim Name | Drug Name | PMIDs |
| Page: 1 |

Copyright 2023-Present -The University of Texas Health Science Center at Houston |