| Tissue | Expression Dynamics | Abbreviation |
| Cervix | 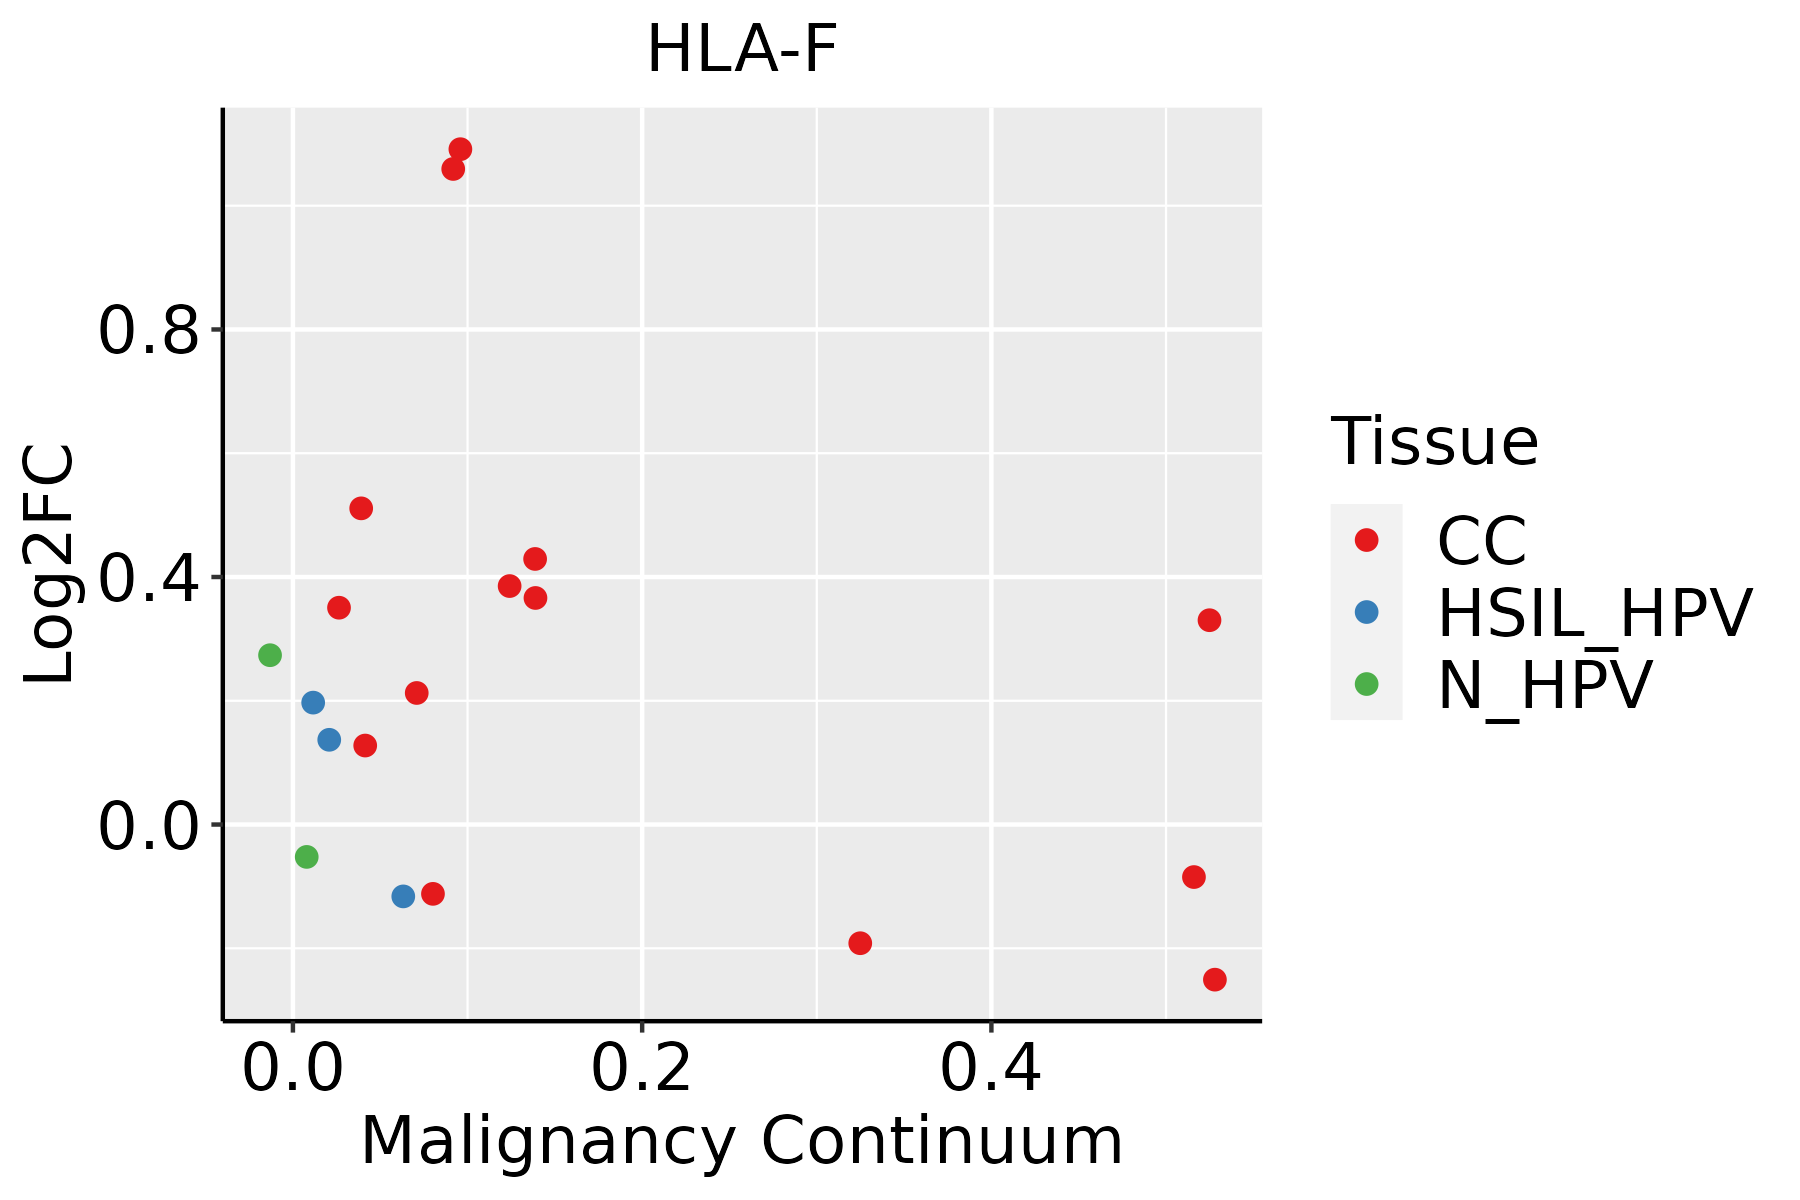 | CC: Cervix cancer |
| HSIL_HPV: HPV-infected high-grade squamous intraepithelial lesions |
| N_HPV: HPV-infected normal cervix |
| Colorectum (GSE201348) |  | FAP: Familial adenomatous polyposis |
| CRC: Colorectal cancer |
| Colorectum (HTA11) |  | AD: Adenomas |
| SER: Sessile serrated lesions |
| MSI-H: Microsatellite-high colorectal cancer |
| MSS: Microsatellite stable colorectal cancer |
| Esophagus | 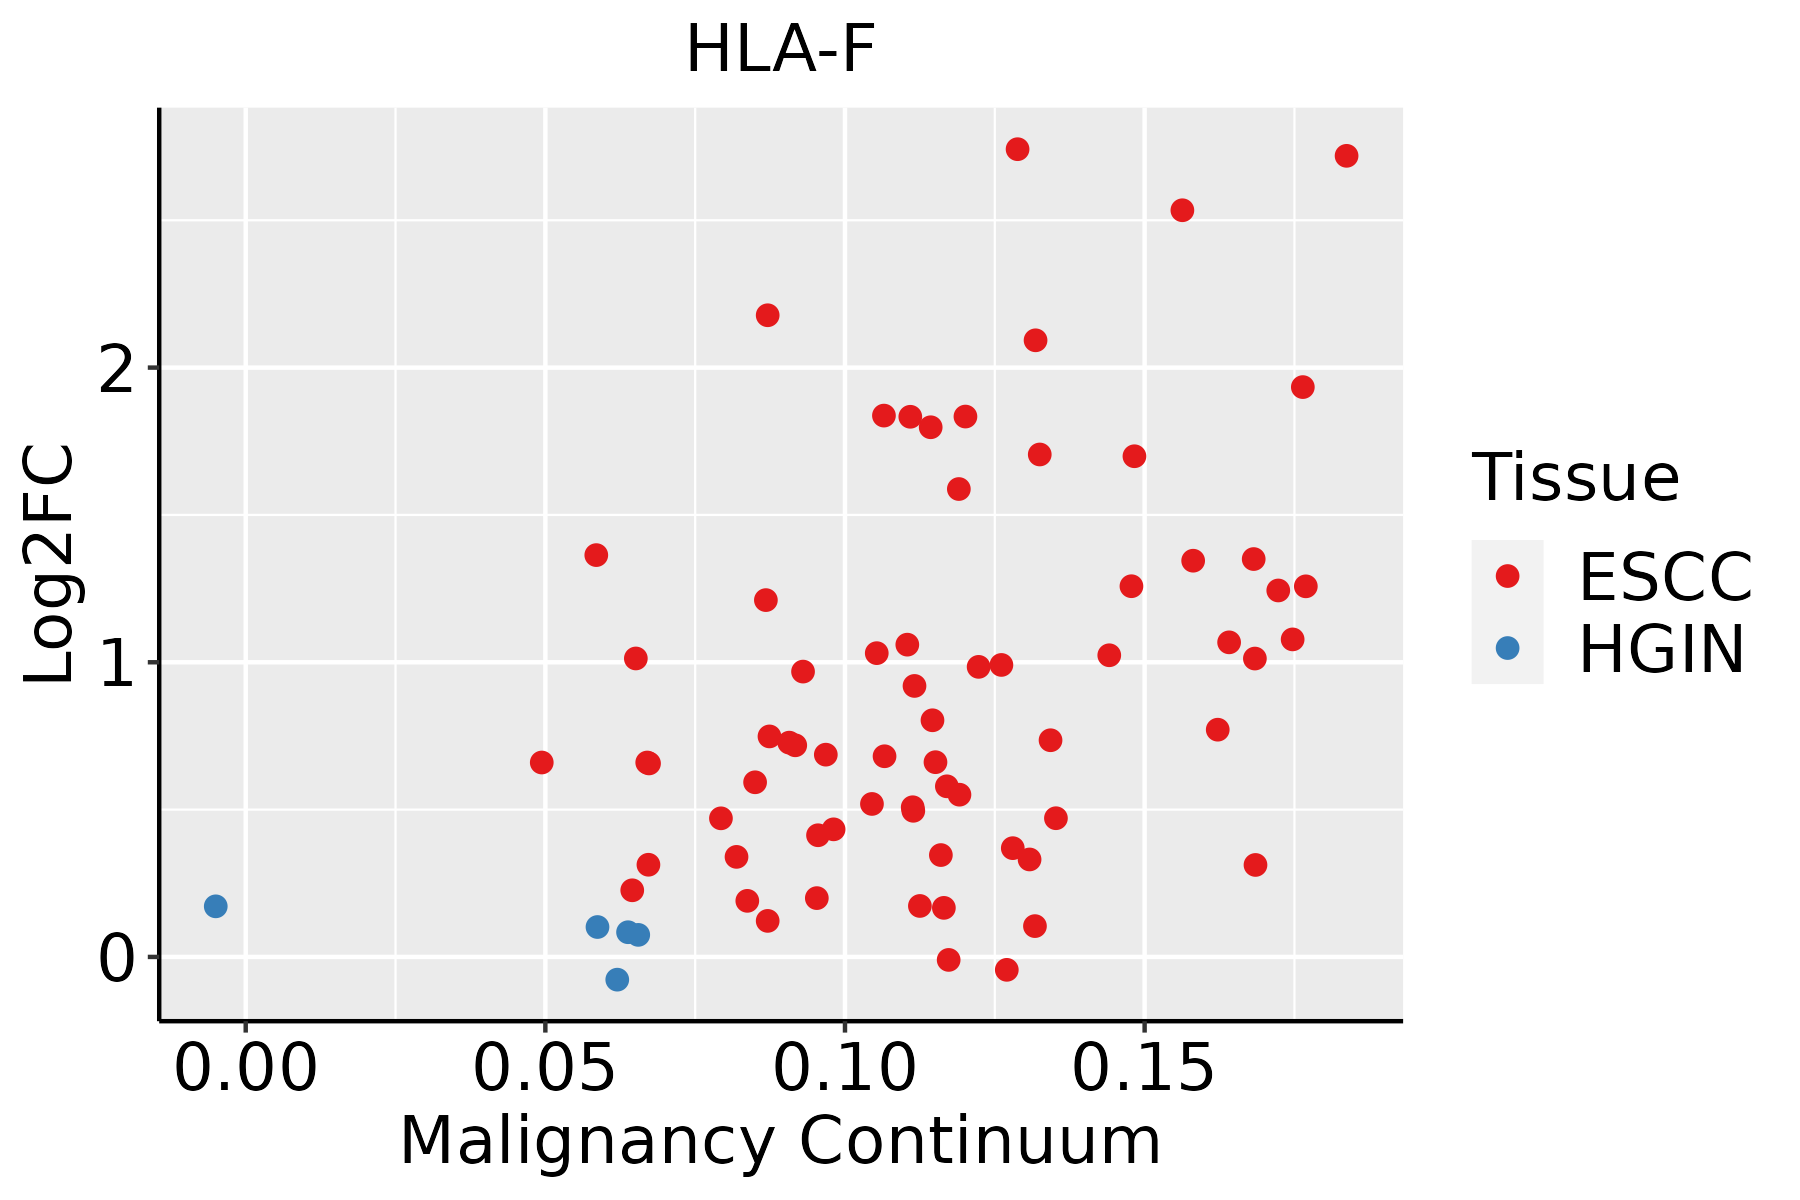 | ESCC: Esophageal squamous cell carcinoma |
| HGIN: High-grade intraepithelial neoplasias |
| LGIN: Low-grade intraepithelial neoplasias |
| Liver | 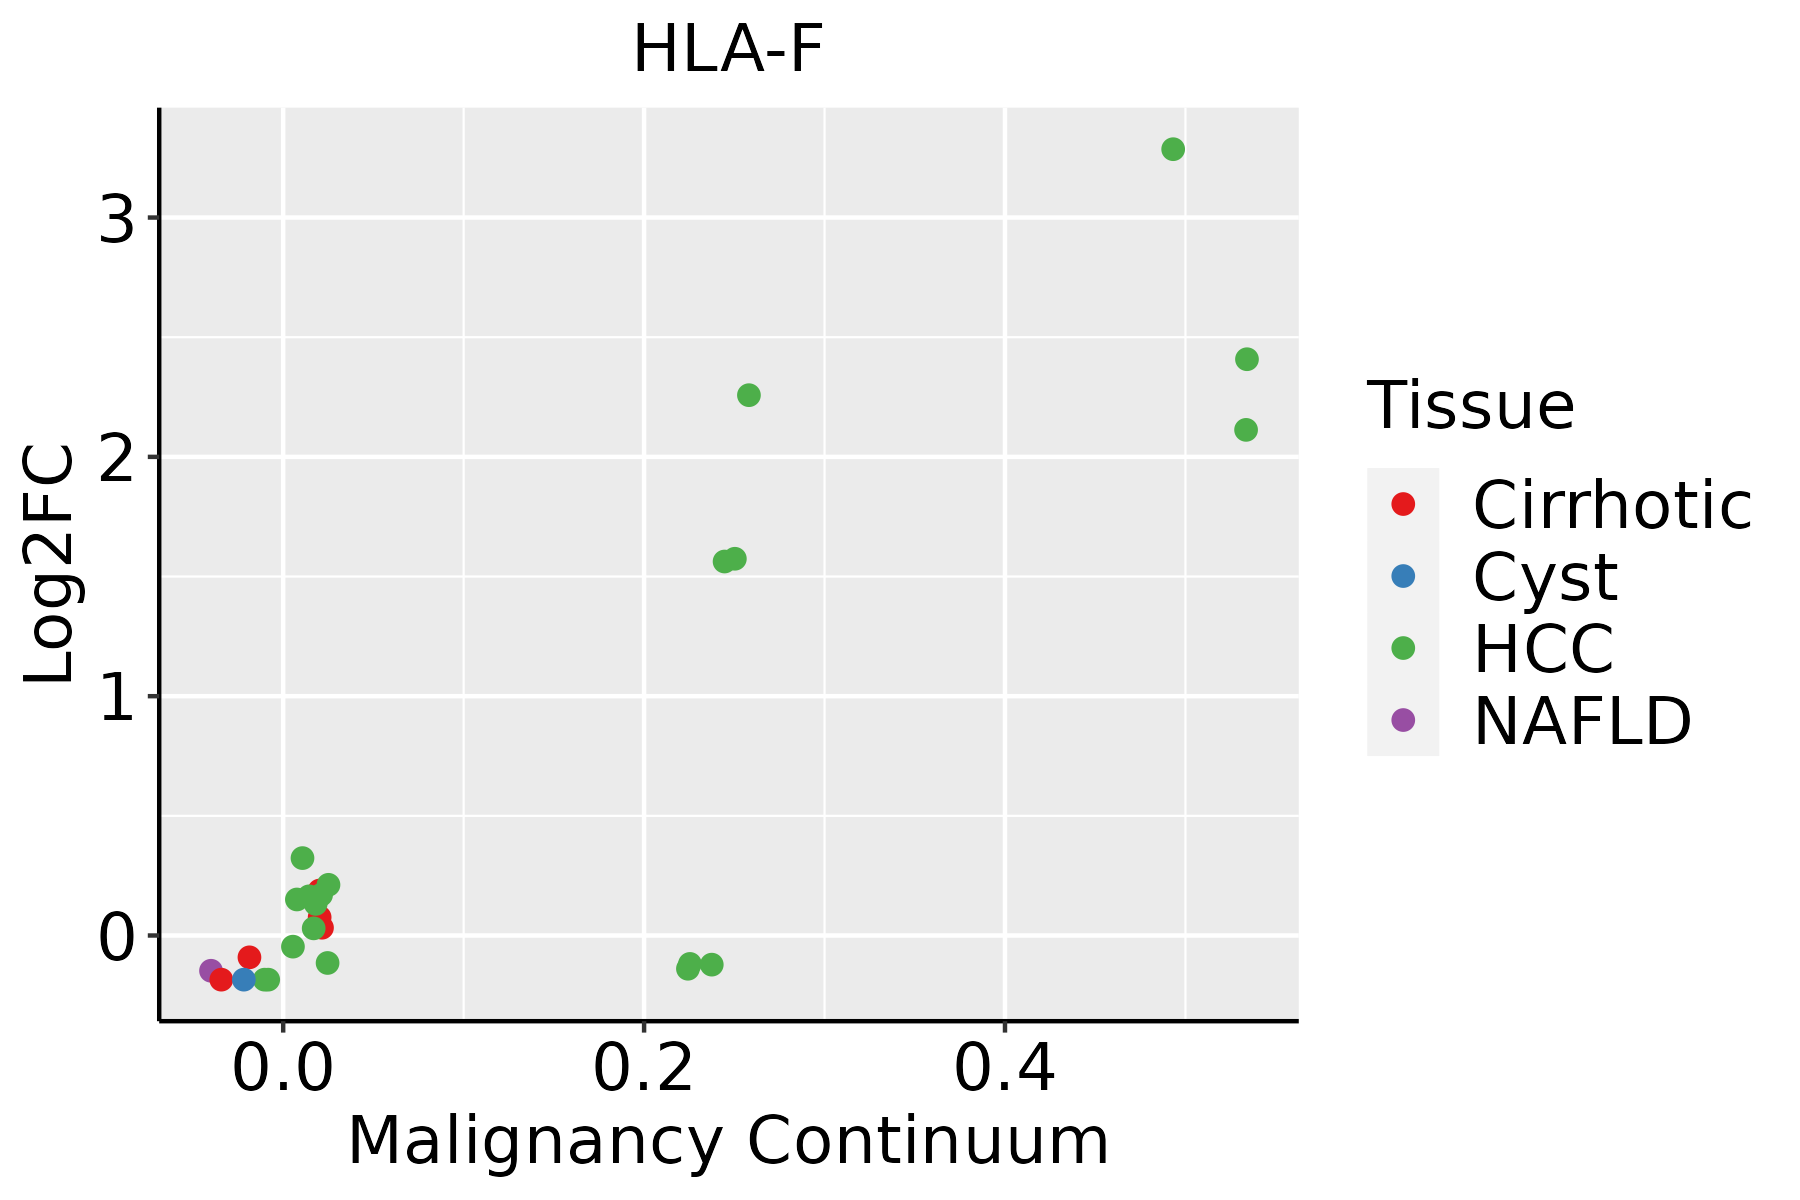 | HCC: Hepatocellular carcinoma |
| NAFLD: Non-alcoholic fatty liver disease |
| Oral Cavity | 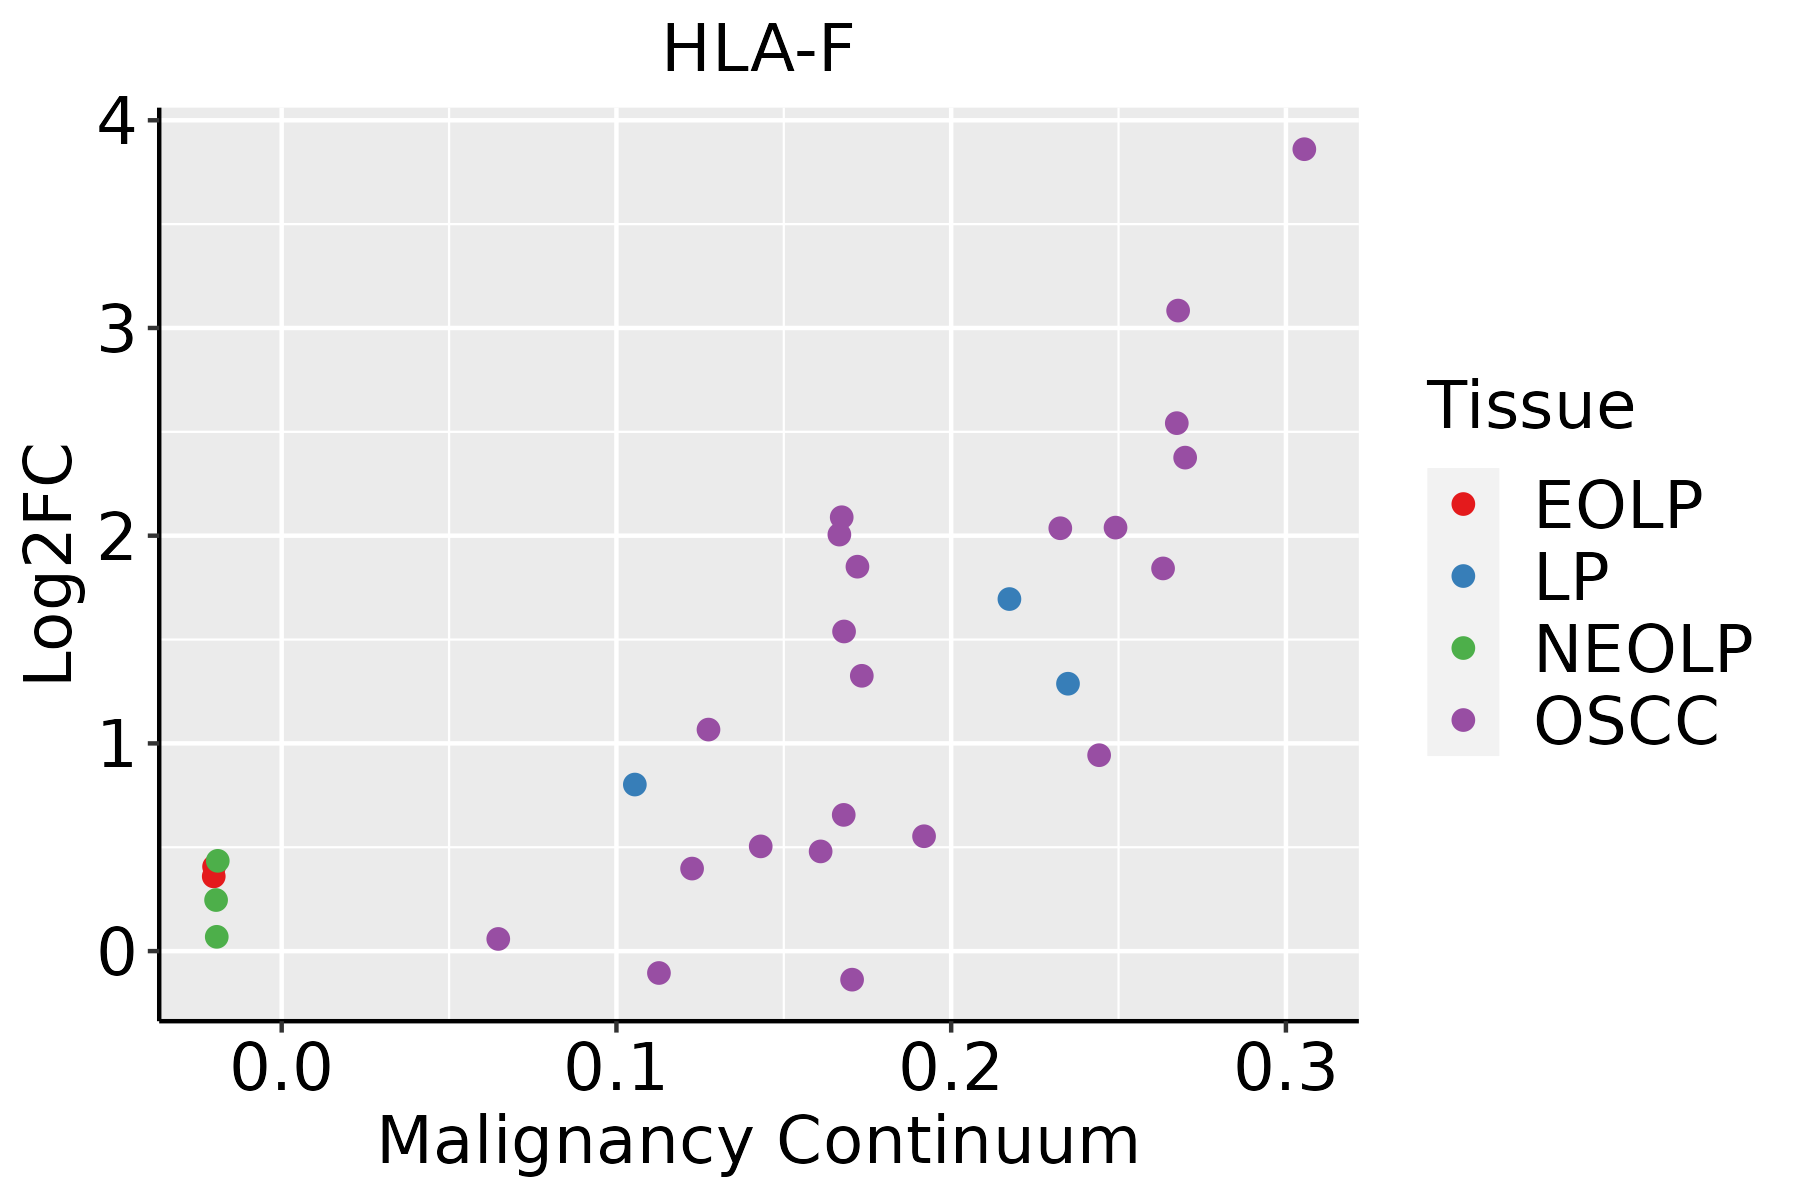 | EOLP: Erosive Oral lichen planus |
| LP: leukoplakia |
| NEOLP: Non-erosive oral lichen planus |
| OSCC: Oral squamous cell carcinoma |
| Prostate |  | BPH: Benign Prostatic Hyperplasia |
| Skin | 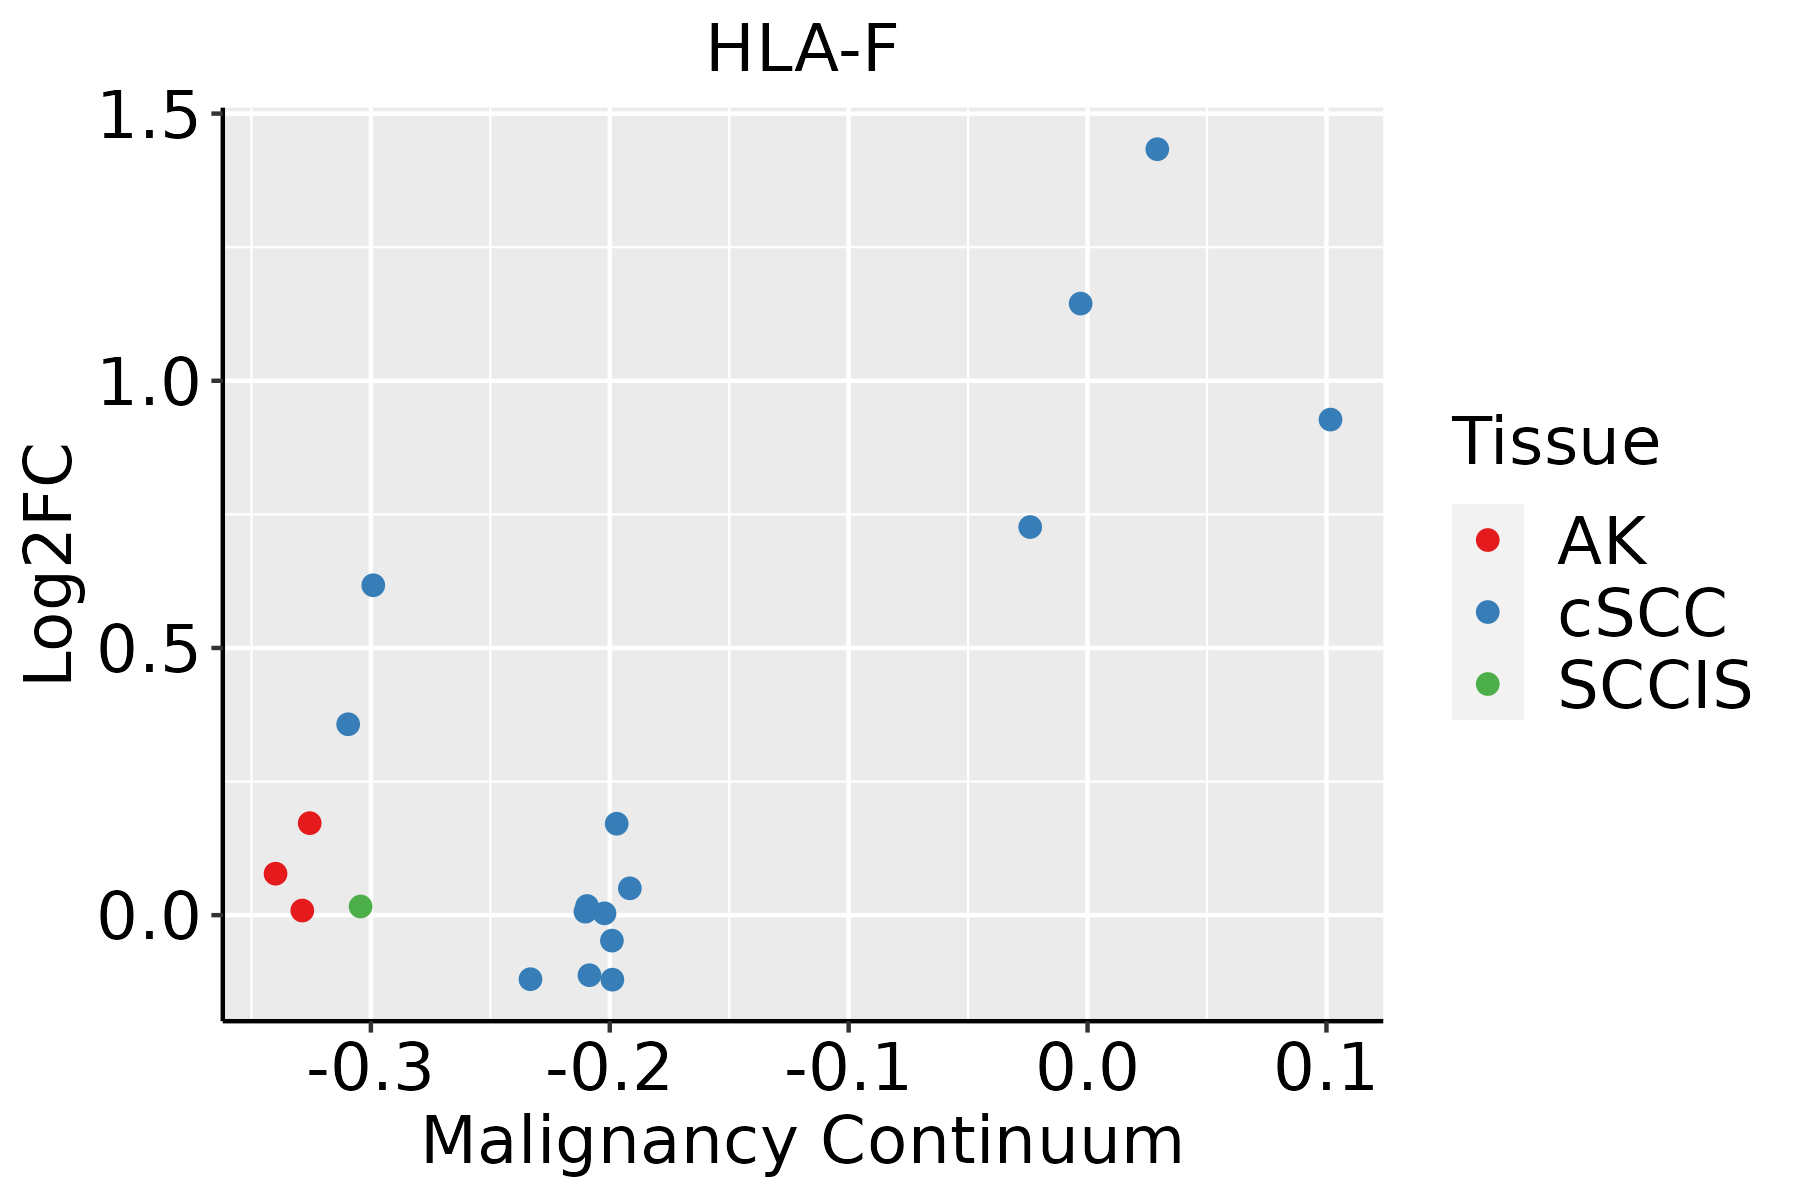 | AK: Actinic keratosis |
| cSCC: Cutaneous squamous cell carcinoma |
| SCCIS:squamous cell carcinoma in situ |
| Thyroid | 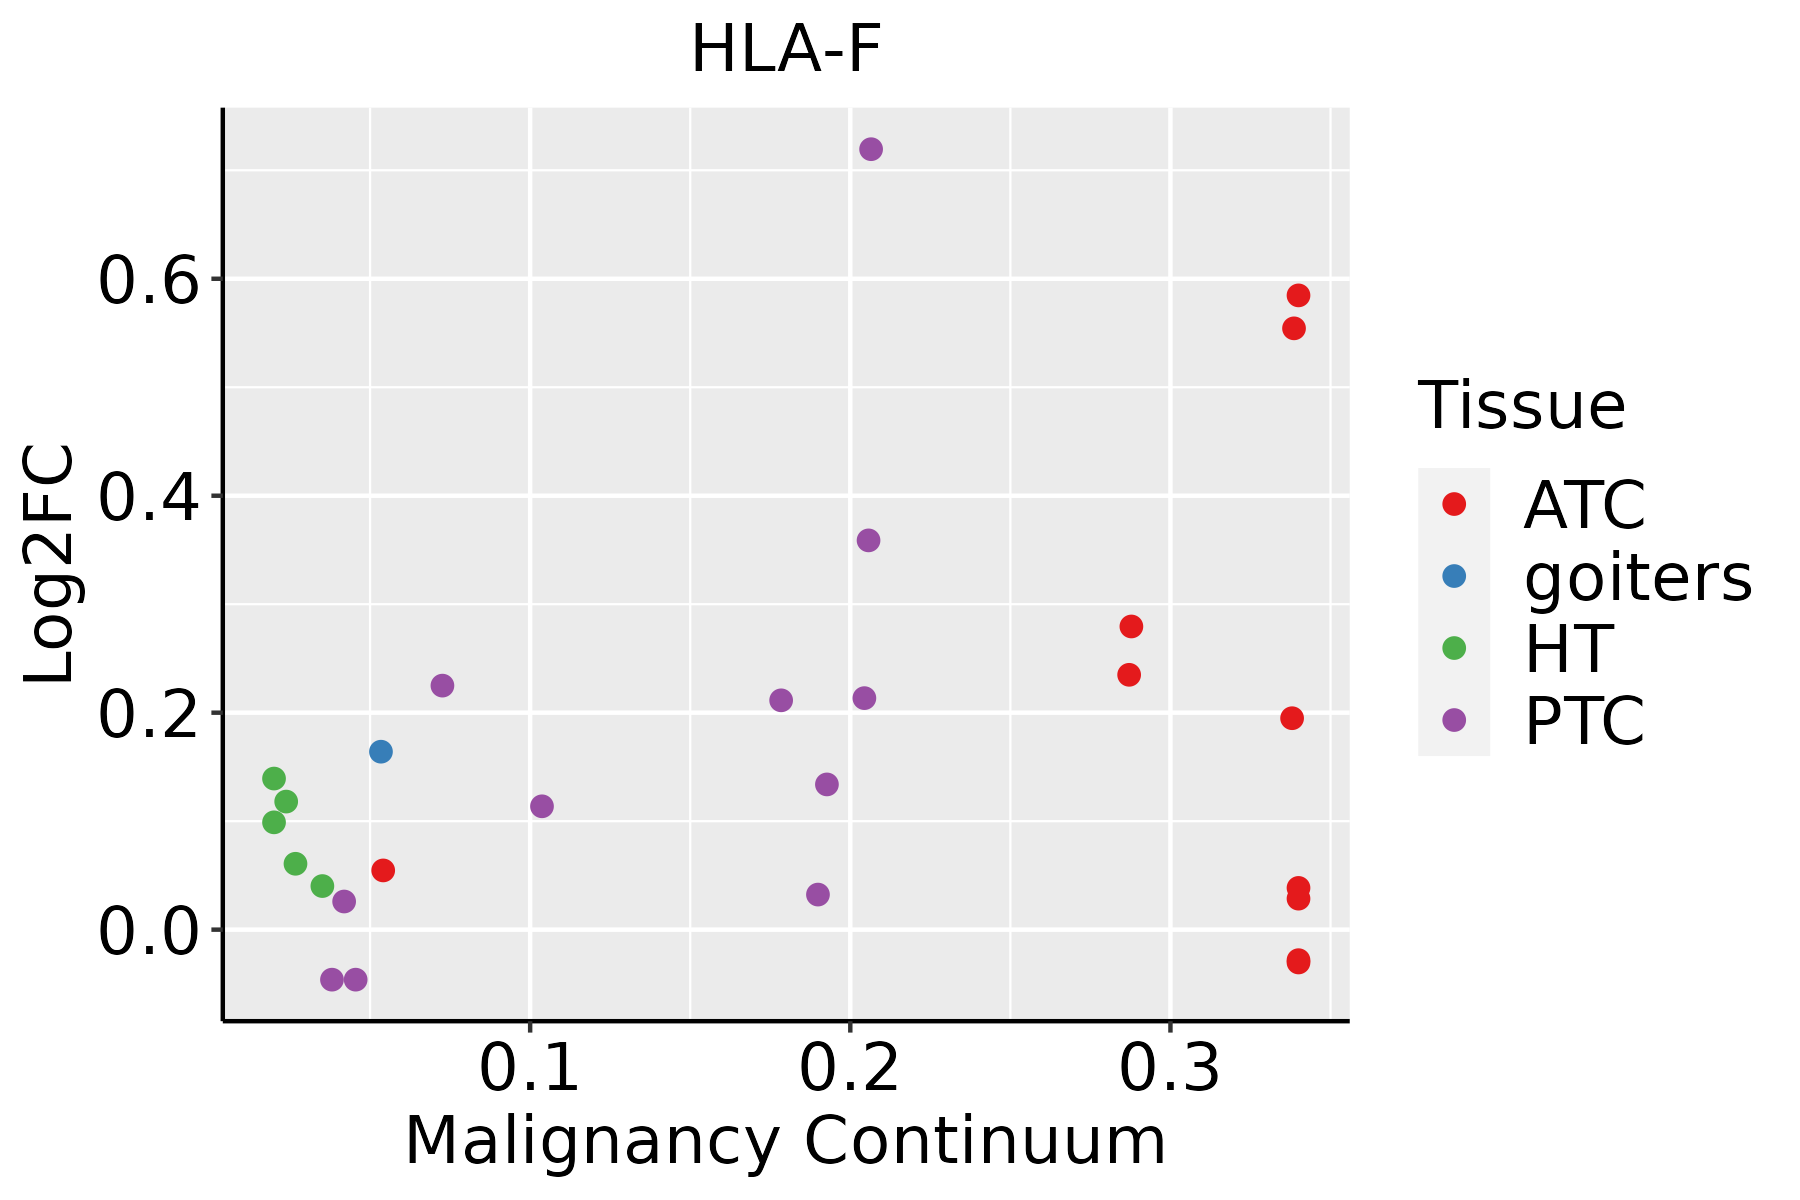 | ATC: Anaplastic thyroid cancer |
| HT: Hashimoto's thyroiditis |
| PTC: Papillary thyroid cancer |
| GO ID | Tissue | Disease Stage | Description | Gene Ratio | Bg Ratio | pvalue | p.adjust | Count |
| GO:00321035 | Cervix | CC | positive regulation of response to external stimulus | 95/2311 | 427/18723 | 5.44e-09 | 5.03e-07 | 95 |
| GO:00026837 | Cervix | CC | negative regulation of immune system process | 94/2311 | 434/18723 | 2.63e-08 | 1.87e-06 | 94 |
| GO:000247810 | Cervix | CC | antigen processing and presentation of exogenous peptide antigen | 18/2311 | 38/18723 | 1.20e-07 | 6.06e-06 | 18 |
| GO:004800210 | Cervix | CC | antigen processing and presentation of peptide antigen | 24/2311 | 62/18723 | 1.21e-07 | 6.07e-06 | 24 |
| GO:001988410 | Cervix | CC | antigen processing and presentation of exogenous antigen | 20/2311 | 47/18723 | 2.18e-07 | 9.57e-06 | 20 |
| GO:00018197 | Cervix | CC | positive regulation of cytokine production | 95/2311 | 467/18723 | 4.88e-07 | 1.85e-05 | 95 |
| GO:001988210 | Cervix | CC | antigen processing and presentation | 32/2311 | 106/18723 | 8.61e-07 | 3.08e-05 | 32 |
| GO:000248310 | Cervix | CC | antigen processing and presentation of endogenous peptide antigen | 11/2311 | 19/18723 | 2.89e-06 | 8.23e-05 | 11 |
| GO:001988310 | Cervix | CC | antigen processing and presentation of endogenous antigen | 13/2311 | 26/18723 | 3.25e-06 | 8.80e-05 | 13 |
| GO:00313494 | Cervix | CC | positive regulation of defense response | 60/2311 | 278/18723 | 9.38e-06 | 2.11e-04 | 60 |
| GO:0051250 | Cervix | CC | negative regulation of lymphocyte activation | 39/2311 | 157/18723 | 1.23e-05 | 2.57e-04 | 39 |
| GO:00028315 | Cervix | CC | regulation of response to biotic stimulus | 67/2311 | 327/18723 | 1.79e-05 | 3.36e-04 | 67 |
| GO:0002695 | Cervix | CC | negative regulation of leukocyte activation | 43/2311 | 187/18723 | 3.47e-05 | 5.60e-04 | 43 |
| GO:001988510 | Cervix | CC | antigen processing and presentation of endogenous peptide antigen via MHC class I | 9/2311 | 17/18723 | 6.27e-05 | 8.94e-04 | 9 |
| GO:007099710 | Cervix | CC | neuron death | 70/2311 | 361/18723 | 7.50e-05 | 1.03e-03 | 70 |
| GO:00028322 | Cervix | CC | negative regulation of response to biotic stimulus | 27/2311 | 108/18723 | 2.27e-04 | 2.55e-03 | 27 |
| GO:0050866 | Cervix | CC | negative regulation of cell activation | 44/2311 | 210/18723 | 2.76e-04 | 3.02e-03 | 44 |
| GO:000247410 | Cervix | CC | antigen processing and presentation of peptide antigen via MHC class I | 11/2311 | 28/18723 | 2.84e-04 | 3.07e-03 | 11 |
| GO:190121410 | Cervix | CC | regulation of neuron death | 61/2311 | 319/18723 | 3.11e-04 | 3.31e-03 | 61 |
| GO:00507773 | Cervix | CC | negative regulation of immune response | 41/2311 | 194/18723 | 3.63e-04 | 3.76e-03 | 41 |
| Pathway ID | Tissue | Disease Stage | Description | Gene Ratio | Bg Ratio | pvalue | p.adjust | qvalue | Count |
| hsa0461220 | Cervix | CC | Antigen processing and presentation | 34/1267 | 78/8465 | 1.06e-09 | 2.14e-08 | 1.26e-08 | 34 |
| hsa0516720 | Cervix | CC | Kaposi sarcoma-associated herpesvirus infection | 60/1267 | 194/8465 | 9.74e-09 | 1.58e-07 | 9.33e-08 | 60 |
| hsa0541620 | Cervix | CC | Viral myocarditis | 27/1267 | 60/8465 | 2.43e-08 | 3.57e-07 | 2.11e-07 | 27 |
| hsa0516318 | Cervix | CC | Human cytomegalovirus infection | 65/1267 | 225/8465 | 4.59e-08 | 6.47e-07 | 3.83e-07 | 65 |
| hsa0421810 | Cervix | CC | Cellular senescence | 49/1267 | 156/8465 | 1.30e-07 | 1.63e-06 | 9.61e-07 | 49 |
| hsa0414520 | Cervix | CC | Phagosome | 47/1267 | 152/8465 | 3.95e-07 | 4.26e-06 | 2.52e-06 | 47 |
| hsa0516920 | Cervix | CC | Epstein-Barr virus infection | 57/1267 | 202/8465 | 7.30e-07 | 7.39e-06 | 4.37e-06 | 57 |
| hsa0516620 | Cervix | CC | Human T-cell leukemia virus 1 infection | 61/1267 | 222/8465 | 8.13e-07 | 7.98e-06 | 4.72e-06 | 61 |
| hsa0414418 | Cervix | CC | Endocytosis | 64/1267 | 251/8465 | 6.97e-06 | 6.10e-05 | 3.61e-05 | 64 |
| hsa0517016 | Cervix | CC | Human immunodeficiency virus 1 infection | 55/1267 | 212/8465 | 1.80e-05 | 1.42e-04 | 8.40e-05 | 55 |
| hsa0494016 | Cervix | CC | Type I diabetes mellitus | 17/1267 | 43/8465 | 7.47e-05 | 5.04e-04 | 2.98e-04 | 17 |
| hsa051657 | Cervix | CC | Human papillomavirus infection | 74/1267 | 331/8465 | 1.70e-04 | 1.02e-03 | 6.03e-04 | 74 |
| hsa0533014 | Cervix | CC | Allograft rejection | 15/1267 | 38/8465 | 2.01e-04 | 1.14e-03 | 6.75e-04 | 15 |
| hsa0533212 | Cervix | CC | Graft-versus-host disease | 15/1267 | 42/8465 | 7.12e-04 | 3.25e-03 | 1.92e-03 | 15 |
| hsa045147 | Cervix | CC | Cell adhesion molecules | 36/1267 | 157/8465 | 4.94e-03 | 1.67e-02 | 9.86e-03 | 36 |
| hsa0532012 | Cervix | CC | Autoimmune thyroid disease | 15/1267 | 53/8465 | 9.08e-03 | 2.85e-02 | 1.69e-02 | 15 |
| hsa04612110 | Cervix | CC | Antigen processing and presentation | 34/1267 | 78/8465 | 1.06e-09 | 2.14e-08 | 1.26e-08 | 34 |
| hsa05167110 | Cervix | CC | Kaposi sarcoma-associated herpesvirus infection | 60/1267 | 194/8465 | 9.74e-09 | 1.58e-07 | 9.33e-08 | 60 |
| hsa05416110 | Cervix | CC | Viral myocarditis | 27/1267 | 60/8465 | 2.43e-08 | 3.57e-07 | 2.11e-07 | 27 |
| hsa0516319 | Cervix | CC | Human cytomegalovirus infection | 65/1267 | 225/8465 | 4.59e-08 | 6.47e-07 | 3.83e-07 | 65 |
| Hugo Symbol | Variant Class | Variant Classification | dbSNP RS | HGVSc | HGVSp | HGVSp Short | SWISSPROT | BIOTYPE | SIFT | PolyPhen | Tumor Sample Barcode | Tissue | Histology | Sex | Age | Stage | Therapy Types | Drugs | Outcome |
| HLA-F | SNV | Missense_Mutation | | c.695C>G | p.Ala232Gly | p.A232G | P30511 | protein_coding | deleterious_low_confidence(0) | benign(0.022) | TCGA-D8-A147-01 | Breast | breast invasive carcinoma | Female | <65 | I/II | Chemotherapy | doxorubicine | SD |
| HLA-F | SNV | Missense_Mutation | | c.659C>T | p.Ala220Val | p.A220V | P30511 | protein_coding | tolerated_low_confidence(0.68) | benign(0) | TCGA-D8-A27M-01 | Breast | breast invasive carcinoma | Female | <65 | I/II | Chemotherapy | methotrexate+5 | SD |
| HLA-F | SNV | Missense_Mutation | rs541971824 | c.719N>A | p.Arg240Gln | p.R240Q | P30511 | protein_coding | tolerated_low_confidence(0.06) | possibly_damaging(0.598) | TCGA-PL-A8LX-01 | Breast | breast invasive carcinoma | Female | <65 | III/IV | Unknown | Unknown | SD |
| HLA-F | SNV | Missense_Mutation | novel | c.996G>T | p.Lys332Asn | p.K332N | P30511 | protein_coding | deleterious_low_confidence(0.02) | benign(0.197) | TCGA-2W-A8YY-01 | Cervix | cervical & endocervical cancer | Female | <65 | I/II | Chemotherapy | cisplatin | CR |
| HLA-F | SNV | Missense_Mutation | | c.593N>G | p.Glu198Gly | p.E198G | P30511 | protein_coding | deleterious_low_confidence(0) | possibly_damaging(0.847) | TCGA-FU-A3HZ-01 | Cervix | cervical & endocervical cancer | Female | <65 | I/II | Chemotherapy | cisplatin | CR |
| HLA-F | SNV | Missense_Mutation | novel | c.191N>T | p.Pro64Leu | p.P64L | P30511 | protein_coding | deleterious_low_confidence(0) | benign(0.297) | TCGA-VS-A94Z-01 | Cervix | cervical & endocervical cancer | Female | <65 | I/II | Chemotherapy | cisplatin | CR |
| HLA-F | SNV | Missense_Mutation | rs764964427 | c.584N>G | p.Asn195Ser | p.N195S | P30511 | protein_coding | tolerated_low_confidence(0.05) | benign(0.371) | TCGA-AA-3877-01 | Colorectum | colon adenocarcinoma | Female | >=65 | I/II | Unknown | Unknown | SD |
| HLA-F | SNV | Missense_Mutation | | c.604N>T | p.Arg202Cys | p.R202C | P30511 | protein_coding | deleterious_low_confidence(0.01) | possibly_damaging(0.466) | TCGA-F4-6856-01 | Colorectum | colon adenocarcinoma | Male | <65 | I/II | Ancillary | leucovorin | CR |
| HLA-F | SNV | Missense_Mutation | rs57486551 | c.1237N>T | p.Arg413Cys | p.R413C | P30511 | protein_coding | deleterious_low_confidence(0) | benign(0) | TCGA-AG-A002-01 | Colorectum | rectum adenocarcinoma | Male | <65 | I/II | Unknown | Unknown | SD |
| HLA-F | deletion | Frame_Shift_Del | | c.1180delN | p.Leu396CysfsTer38 | p.L396Cfs*38 | P30511 | protein_coding | | | TCGA-AA-3966-01 | Colorectum | colon adenocarcinoma | Female | >=65 | I/II | Unknown | Unknown | SD |


