| Tissue | Expression Dynamics | Abbreviation |
| Breast |  | IDC: Invasive ductal carcinoma |
| DCIS: Ductal carcinoma in situ |
| Precancer(BRCA1-mut): Precancerous lesion from BRCA1 mutation carriers |
| Cervix | 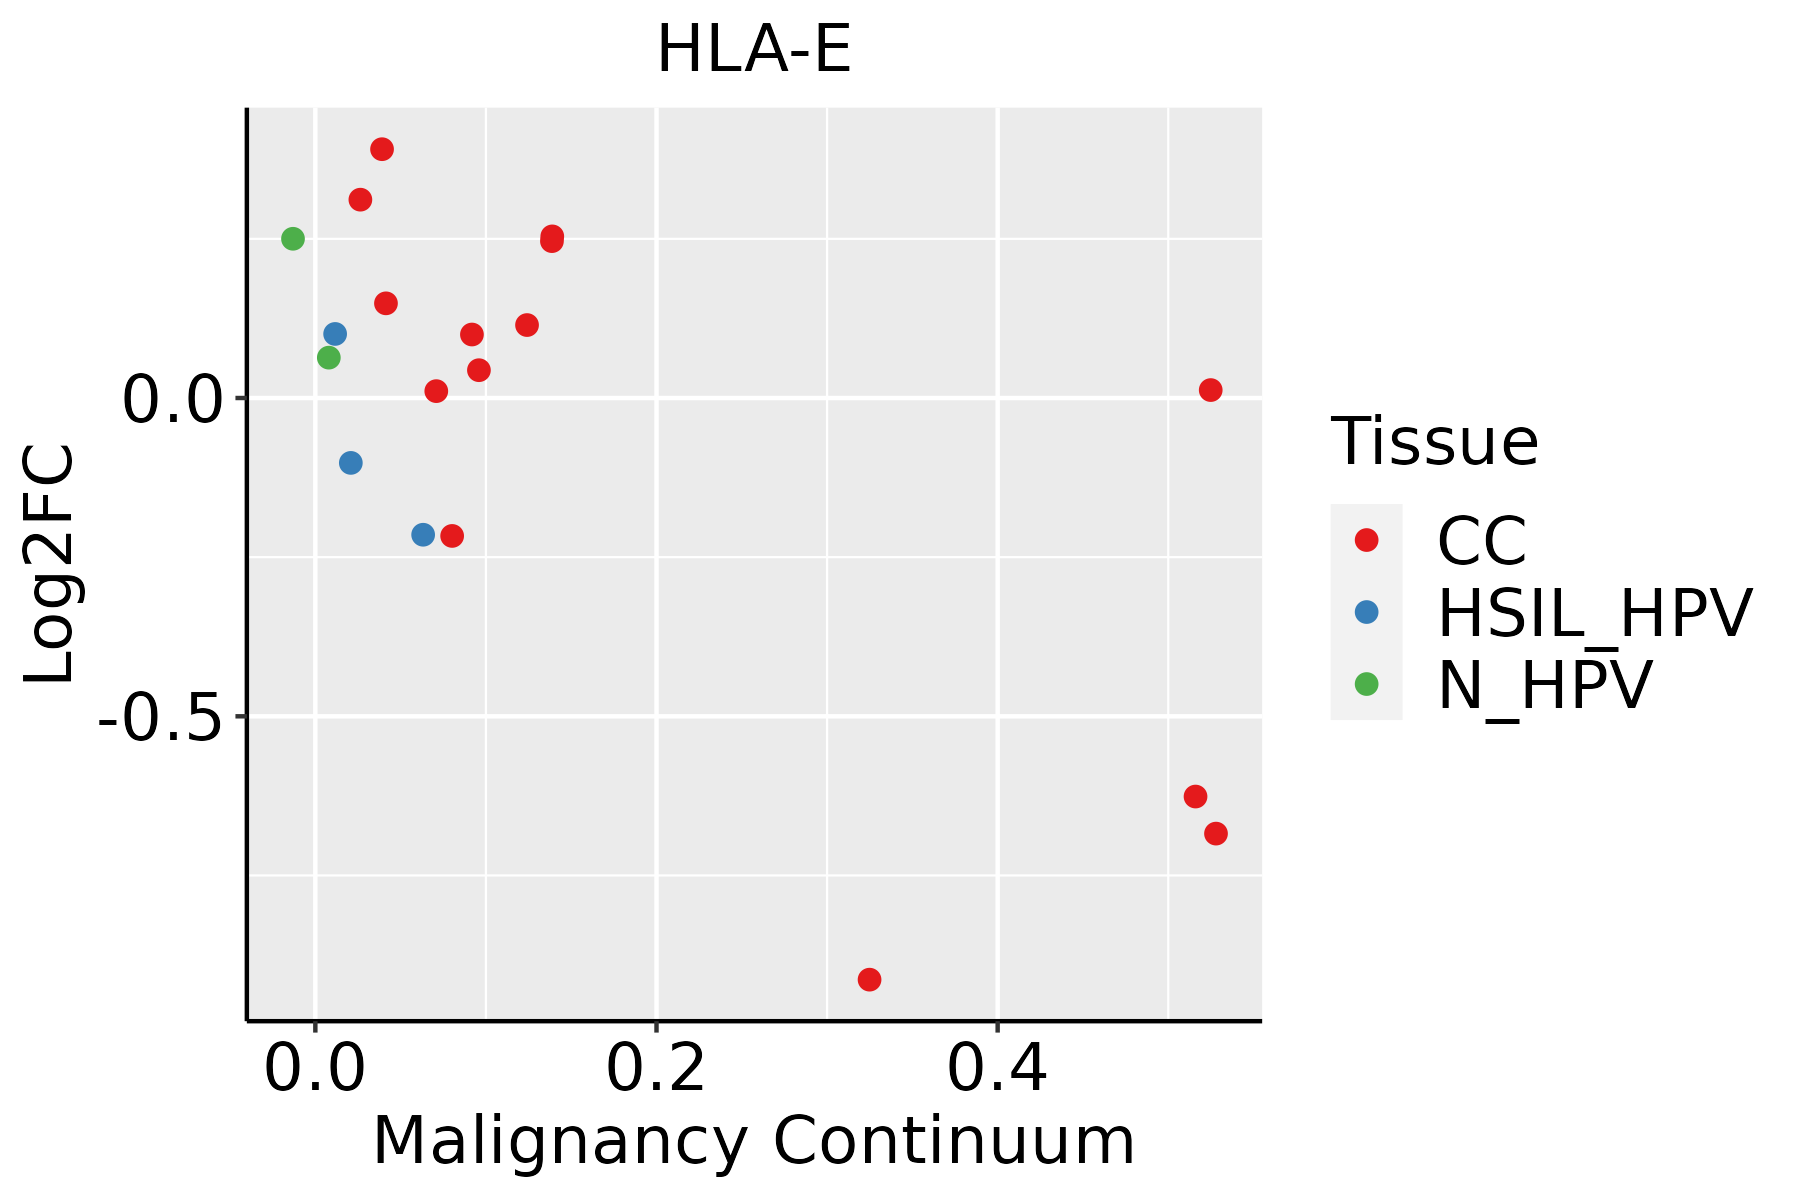 | CC: Cervix cancer |
| HSIL_HPV: HPV-infected high-grade squamous intraepithelial lesions |
| N_HPV: HPV-infected normal cervix |
| Colorectum (GSE201348) |  | FAP: Familial adenomatous polyposis |
| CRC: Colorectal cancer |
| Colorectum (HTA11) |  | AD: Adenomas |
| SER: Sessile serrated lesions |
| MSI-H: Microsatellite-high colorectal cancer |
| MSS: Microsatellite stable colorectal cancer |
| Endometrium | 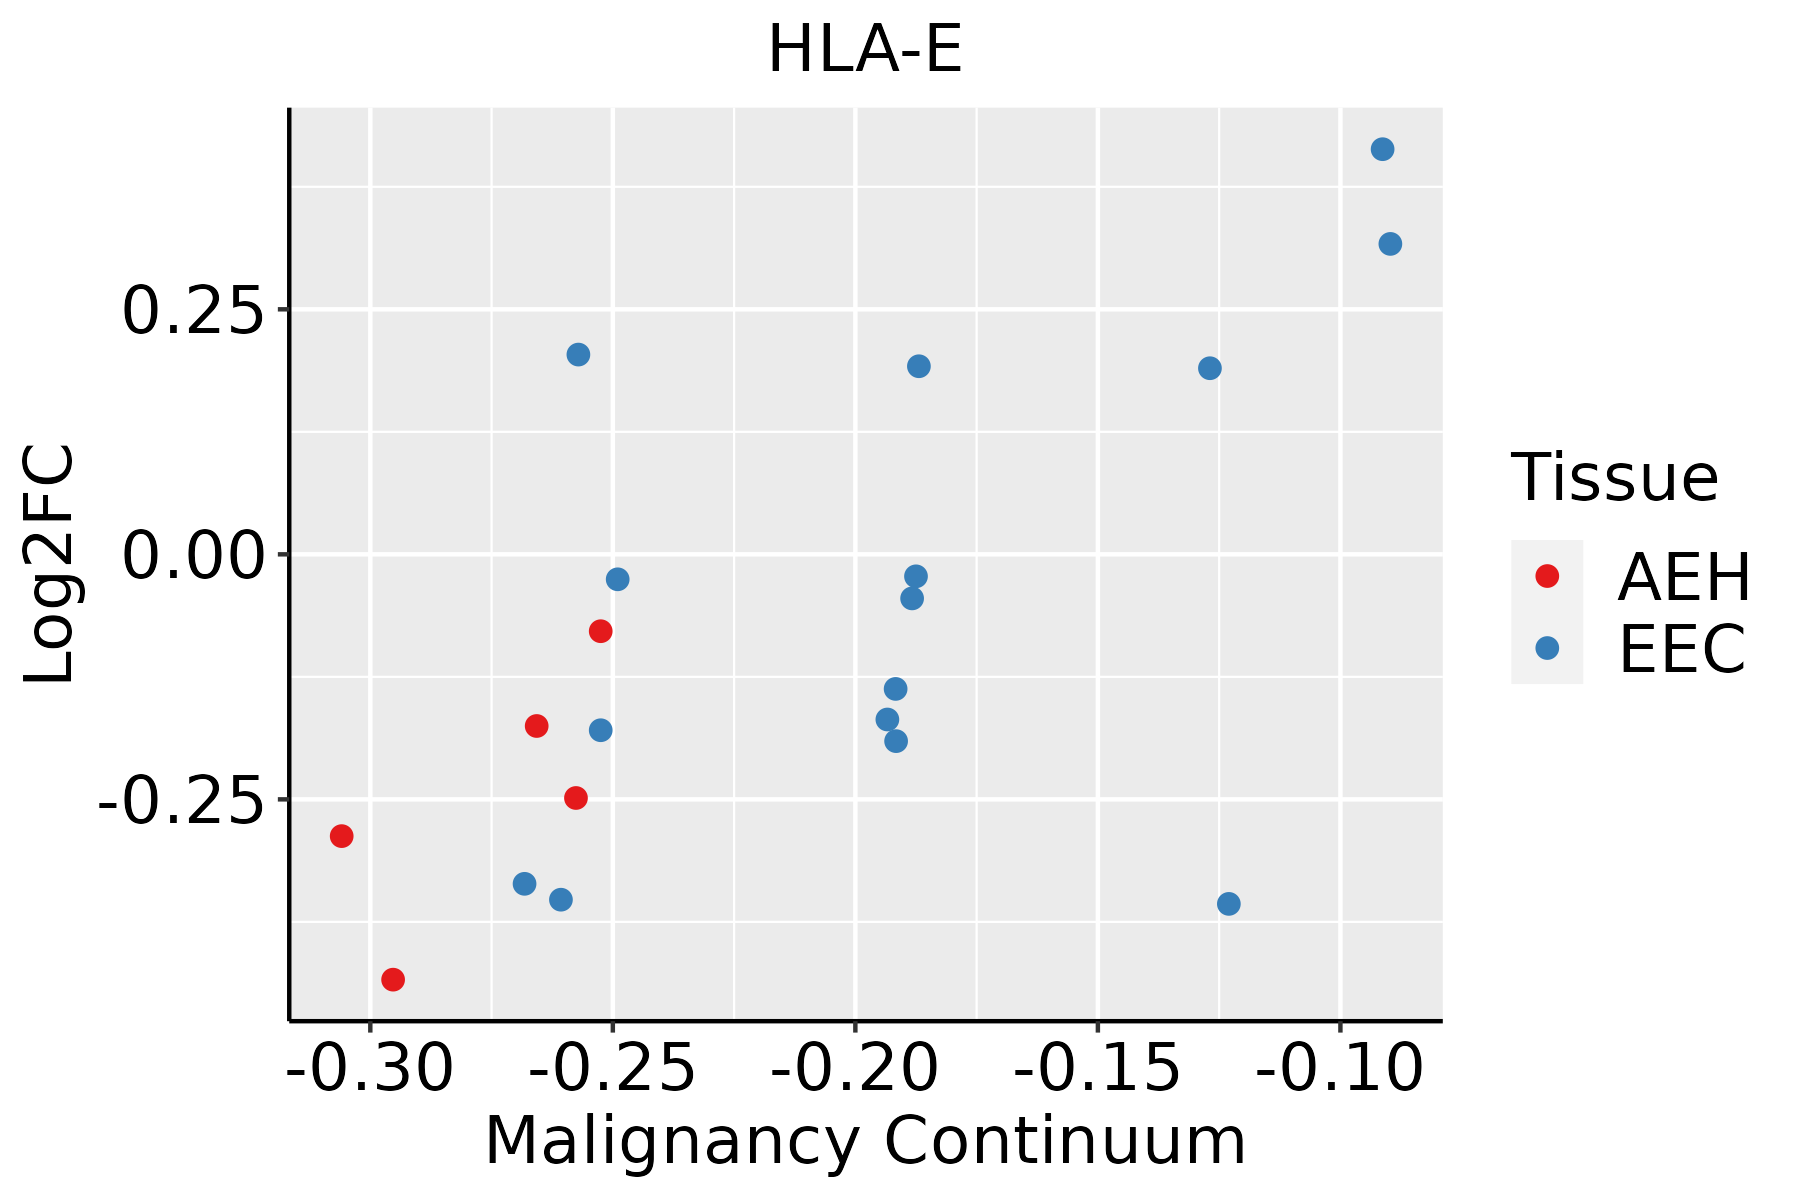 | AEH: Atypical endometrial hyperplasia |
| EEC: Endometrioid Cancer |
| Esophagus |  | ESCC: Esophageal squamous cell carcinoma |
| HGIN: High-grade intraepithelial neoplasias |
| LGIN: Low-grade intraepithelial neoplasias |
| GC | 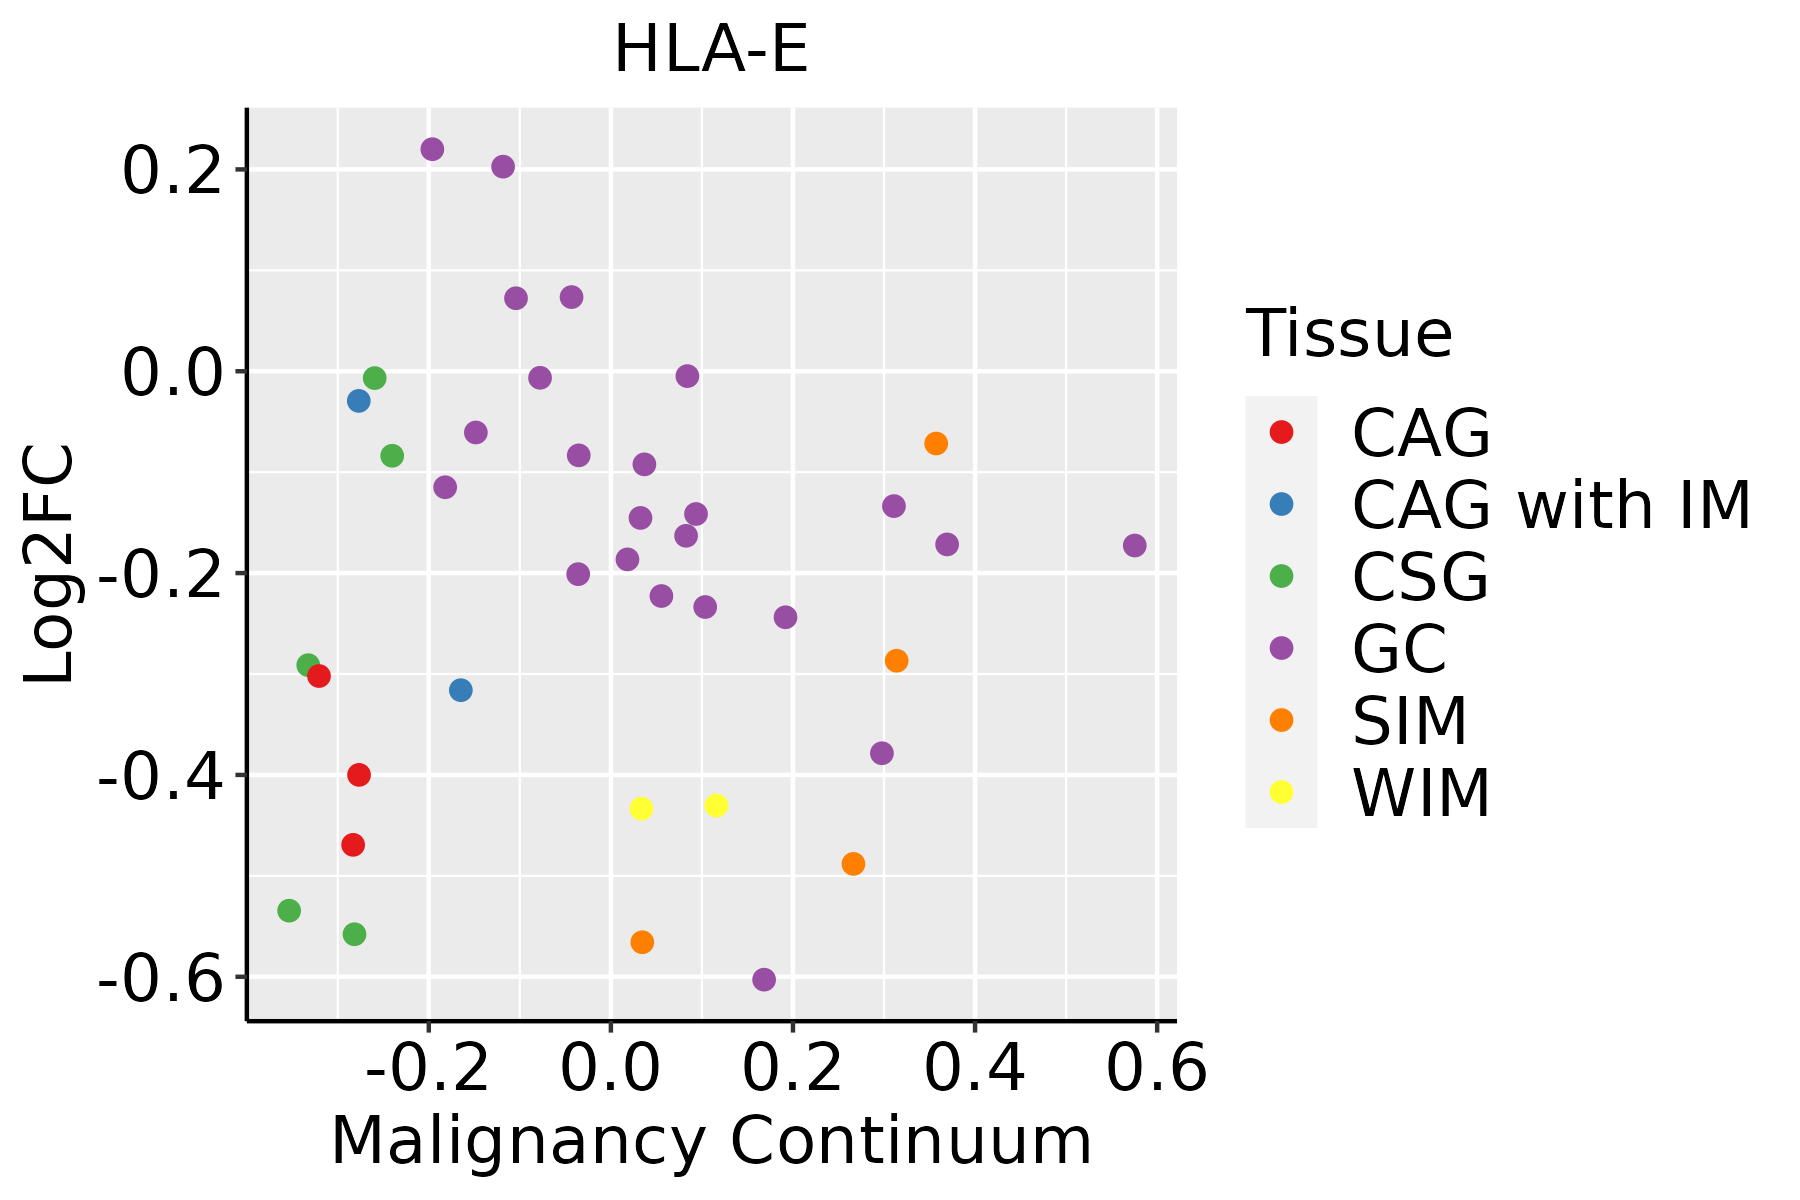 | CAG: Chronic atrophic gastritis |
| CAG with IM: Chronic atrophic gastritis with intestinal metaplasia |
| CSG: Chronic superficial gastritis |
| GC: Gastric cancer |
| SIM: Severe intestinal metaplasia |
| WIM: Wild intestinal metaplasia |
| Liver |  | HCC: Hepatocellular carcinoma |
| NAFLD: Non-alcoholic fatty liver disease |
| Lung | 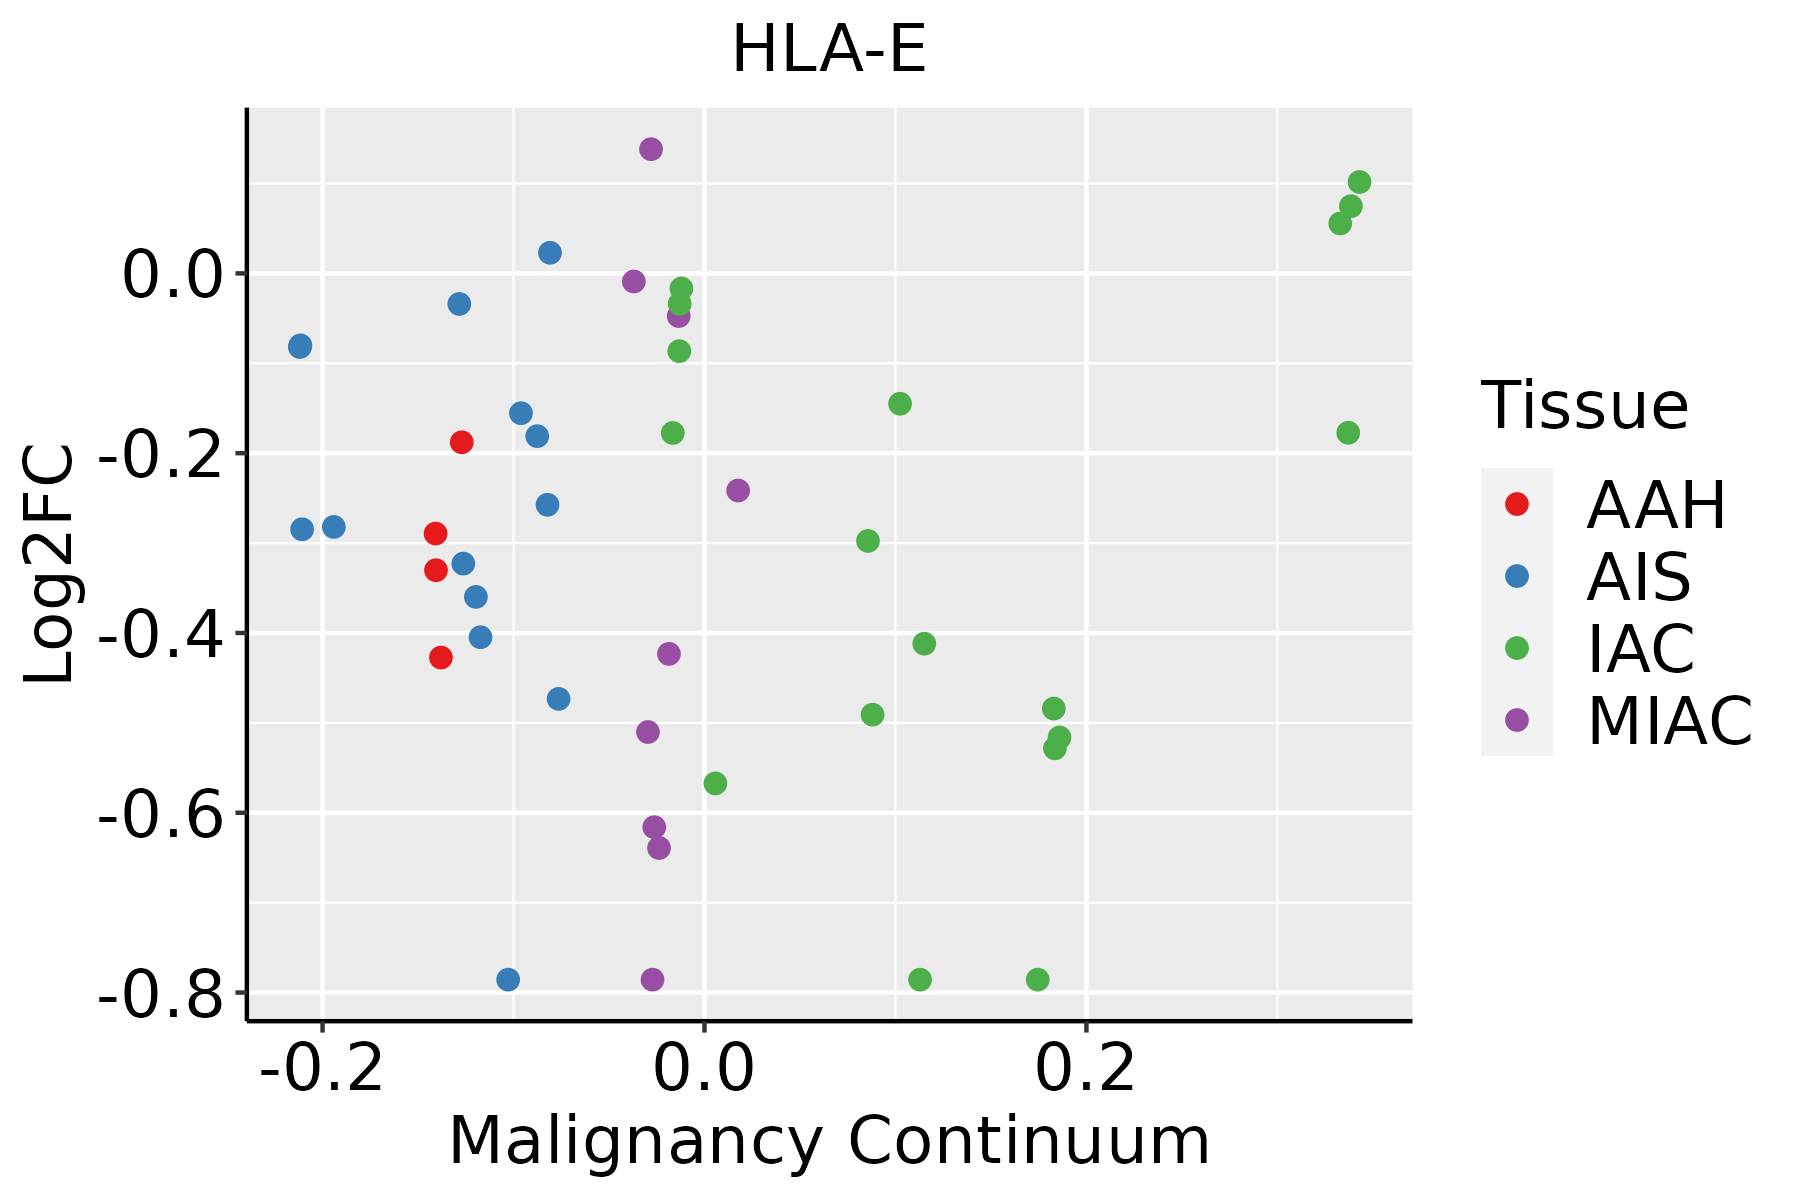 | AAH: Atypical adenomatous hyperplasia |
| AIS: Adenocarcinoma in situ |
| IAC: Invasive lung adenocarcinoma |
| MIA: Minimally invasive adenocarcinoma |
| Oral Cavity |  | EOLP: Erosive Oral lichen planus |
| LP: leukoplakia |
| NEOLP: Non-erosive oral lichen planus |
| OSCC: Oral squamous cell carcinoma |
| Prostate |  | BPH: Benign Prostatic Hyperplasia |
| Skin |  | AK: Actinic keratosis |
| cSCC: Cutaneous squamous cell carcinoma |
| SCCIS:squamous cell carcinoma in situ |
| Thyroid |  | ATC: Anaplastic thyroid cancer |
| HT: Hashimoto's thyroiditis |
| PTC: Papillary thyroid cancer |
| GO ID | Tissue | Disease Stage | Description | Gene Ratio | Bg Ratio | pvalue | p.adjust | Count |
| GO:00457859 | Breast | Precancer | positive regulation of cell adhesion | 52/1080 | 437/18723 | 5.74e-07 | 2.49e-05 | 52 |
| GO:00018196 | Breast | Precancer | positive regulation of cytokine production | 52/1080 | 467/18723 | 4.18e-06 | 1.29e-04 | 52 |
| GO:00024839 | Breast | Precancer | antigen processing and presentation of endogenous peptide antigen | 8/1080 | 19/18723 | 5.10e-06 | 1.53e-04 | 8 |
| GO:00507293 | Breast | Precancer | positive regulation of inflammatory response | 23/1080 | 142/18723 | 6.51e-06 | 1.81e-04 | 23 |
| GO:00198839 | Breast | Precancer | antigen processing and presentation of endogenous antigen | 9/1080 | 26/18723 | 8.75e-06 | 2.34e-04 | 9 |
| GO:0050727 | Breast | Precancer | regulation of inflammatory response | 44/1080 | 386/18723 | 1.26e-05 | 3.22e-04 | 44 |
| GO:00421107 | Breast | Precancer | T cell activation | 52/1080 | 487/18723 | 1.37e-05 | 3.42e-04 | 52 |
| GO:00508707 | Breast | Precancer | positive regulation of T cell activation | 29/1080 | 216/18723 | 1.94e-05 | 4.58e-04 | 29 |
| GO:00321034 | Breast | Precancer | positive regulation of response to external stimulus | 46/1080 | 427/18723 | 3.41e-05 | 7.40e-04 | 46 |
| GO:19030396 | Breast | Precancer | positive regulation of leukocyte cell-cell adhesion | 30/1080 | 239/18723 | 5.13e-05 | 1.07e-03 | 30 |
| GO:00027117 | Breast | Precancer | positive regulation of T cell mediated immunity | 12/1080 | 56/18723 | 6.72e-05 | 1.35e-03 | 12 |
| GO:00313493 | Breast | Precancer | positive regulation of defense response | 33/1080 | 278/18723 | 6.79e-05 | 1.36e-03 | 33 |
| GO:00197307 | Breast | Precancer | antimicrobial humoral response | 19/1080 | 122/18723 | 7.02e-05 | 1.40e-03 | 19 |
| GO:00508637 | Breast | Precancer | regulation of T cell activation | 37/1080 | 329/18723 | 8.04e-05 | 1.56e-03 | 37 |
| GO:00224098 | Breast | Precancer | positive regulation of cell-cell adhesion | 33/1080 | 284/18723 | 1.03e-04 | 1.89e-03 | 33 |
| GO:00071597 | Breast | Precancer | leukocyte cell-cell adhesion | 40/1080 | 371/18723 | 1.07e-04 | 1.94e-03 | 40 |
| GO:00019168 | Breast | Precancer | positive regulation of T cell mediated cytotoxicity | 8/1080 | 29/18723 | 1.73e-04 | 2.83e-03 | 8 |
| GO:00480029 | Breast | Precancer | antigen processing and presentation of peptide antigen | 12/1080 | 62/18723 | 1.89e-04 | 3.04e-03 | 12 |
| GO:00224079 | Breast | Precancer | regulation of cell-cell adhesion | 45/1080 | 448/18723 | 2.12e-04 | 3.30e-03 | 45 |
| GO:00198859 | Breast | Precancer | antigen processing and presentation of endogenous peptide antigen via MHC class I | 6/1080 | 17/18723 | 2.59e-04 | 3.83e-03 | 6 |
| Pathway ID | Tissue | Disease Stage | Description | Gene Ratio | Bg Ratio | pvalue | p.adjust | qvalue | Count |
| hsa0516718 | Breast | Precancer | Kaposi sarcoma-associated herpesvirus infection | 36/684 | 194/8465 | 1.68e-06 | 2.53e-05 | 1.94e-05 | 36 |
| hsa0461218 | Breast | Precancer | Antigen processing and presentation | 19/684 | 78/8465 | 9.61e-06 | 1.12e-04 | 8.62e-05 | 19 |
| hsa0516918 | Breast | Precancer | Epstein-Barr virus infection | 35/684 | 202/8465 | 1.15e-05 | 1.26e-04 | 9.64e-05 | 35 |
| hsa042189 | Breast | Precancer | Cellular senescence | 29/684 | 156/8465 | 1.66e-05 | 1.69e-04 | 1.30e-04 | 29 |
| hsa0414518 | Breast | Precancer | Phagosome | 27/684 | 152/8465 | 7.37e-05 | 6.85e-04 | 5.25e-04 | 27 |
| hsa0541618 | Breast | Precancer | Viral myocarditis | 14/684 | 60/8465 | 2.32e-04 | 1.98e-03 | 1.52e-03 | 14 |
| hsa0516618 | Breast | Precancer | Human T-cell leukemia virus 1 infection | 33/684 | 222/8465 | 4.29e-04 | 3.31e-03 | 2.53e-03 | 33 |
| hsa0516316 | Breast | Precancer | Human cytomegalovirus infection | 32/684 | 225/8465 | 1.13e-03 | 7.57e-03 | 5.80e-03 | 32 |
| hsa052036 | Breast | Precancer | Viral carcinogenesis | 27/684 | 204/8465 | 7.19e-03 | 4.06e-02 | 3.11e-02 | 27 |
| hsa0516719 | Breast | Precancer | Kaposi sarcoma-associated herpesvirus infection | 36/684 | 194/8465 | 1.68e-06 | 2.53e-05 | 1.94e-05 | 36 |
| hsa0461219 | Breast | Precancer | Antigen processing and presentation | 19/684 | 78/8465 | 9.61e-06 | 1.12e-04 | 8.62e-05 | 19 |
| hsa0516919 | Breast | Precancer | Epstein-Barr virus infection | 35/684 | 202/8465 | 1.15e-05 | 1.26e-04 | 9.64e-05 | 35 |
| hsa0421814 | Breast | Precancer | Cellular senescence | 29/684 | 156/8465 | 1.66e-05 | 1.69e-04 | 1.30e-04 | 29 |
| hsa0414519 | Breast | Precancer | Phagosome | 27/684 | 152/8465 | 7.37e-05 | 6.85e-04 | 5.25e-04 | 27 |
| hsa0541619 | Breast | Precancer | Viral myocarditis | 14/684 | 60/8465 | 2.32e-04 | 1.98e-03 | 1.52e-03 | 14 |
| hsa0516619 | Breast | Precancer | Human T-cell leukemia virus 1 infection | 33/684 | 222/8465 | 4.29e-04 | 3.31e-03 | 2.53e-03 | 33 |
| hsa0516317 | Breast | Precancer | Human cytomegalovirus infection | 32/684 | 225/8465 | 1.13e-03 | 7.57e-03 | 5.80e-03 | 32 |
| hsa0520312 | Breast | Precancer | Viral carcinogenesis | 27/684 | 204/8465 | 7.19e-03 | 4.06e-02 | 3.11e-02 | 27 |
| hsa0516922 | Breast | IDC | Epstein-Barr virus infection | 45/867 | 202/8465 | 3.16e-07 | 6.05e-06 | 4.52e-06 | 45 |
| hsa0461223 | Breast | IDC | Antigen processing and presentation | 24/867 | 78/8465 | 4.61e-07 | 8.33e-06 | 6.23e-06 | 24 |
| Hugo Symbol | Variant Class | Variant Classification | dbSNP RS | HGVSc | HGVSp | HGVSp Short | SWISSPROT | BIOTYPE | SIFT | PolyPhen | Tumor Sample Barcode | Tissue | Histology | Sex | Age | Stage | Therapy Types | Drugs | Outcome |
| HLA-E | SNV | Missense_Mutation | | c.1038N>T | p.Trp346Cys | p.W346C | | protein_coding | tolerated_low_confidence(0.27) | benign(0) | TCGA-E2-A1IJ-01 | Breast | breast invasive carcinoma | Female | <65 | I/II | Hormone Therapy | arimidex | SD |
| HLA-E | insertion | Nonsense_Mutation | novel | c.81_82insAATTAA | p.Lys27_Tyr28insAsnTer | p.K27_Y28insN* | | protein_coding | | | TCGA-E9-A1NI-01 | Breast | breast invasive carcinoma | Female | <65 | I/II | Chemotherapy | doxorubicin | CR |
| HLA-E | SNV | Missense_Mutation | | c.757N>A | p.Glu253Lys | p.E253K | | protein_coding | deleterious_low_confidence(0) | probably_damaging(0.98) | TCGA-C5-A1ME-01 | Cervix | cervical & endocervical cancer | Female | <65 | I/II | Unknown | Unknown | SD |
| HLA-E | SNV | Missense_Mutation | | c.517N>A | p.Glu173Lys | p.E173K | | protein_coding | tolerated_low_confidence(0.39) | probably_damaging(0.991) | TCGA-IR-A3LH-01 | Cervix | cervical & endocervical cancer | Female | <65 | I/II | Chemotherapy | cisplatin | CR |
| HLA-E | SNV | Missense_Mutation | | c.517N>C | p.Glu173Gln | p.E173Q | | protein_coding | tolerated_low_confidence(0.35) | probably_damaging(0.991) | TCGA-VS-A8EI-01 | Cervix | cervical & endocervical cancer | Female | <65 | I/II | Chemotherapy | cisplatin | CR |
| HLA-E | SNV | Missense_Mutation | | c.469N>A | p.Val157Met | p.V157M | | protein_coding | deleterious_low_confidence(0.01) | benign(0.034) | TCGA-AA-3672-01 | Colorectum | colon adenocarcinoma | Female | >=65 | III/IV | Unknown | Unknown | SD |
| HLA-E | SNV | Missense_Mutation | | c.400N>C | p.Tyr134His | p.Y134H | | protein_coding | deleterious_low_confidence(0.02) | probably_damaging(0.998) | TCGA-AA-3811-01 | Colorectum | colon adenocarcinoma | Female | >=65 | III/IV | Unknown | Unknown | PD |
| HLA-E | SNV | Missense_Mutation | novel | c.1012N>A | p.Gly338Arg | p.G338R | | protein_coding | tolerated_low_confidence(0.16) | probably_damaging(0.996) | TCGA-AA-3864-01 | Colorectum | colon adenocarcinoma | Male | >=65 | I/II | Unknown | Unknown | SD |
| HLA-E | SNV | Missense_Mutation | | c.725N>A | p.Gly242Glu | p.G242E | | protein_coding | deleterious_low_confidence(0.04) | probably_damaging(0.999) | TCGA-AU-6004-01 | Colorectum | colon adenocarcinoma | Female | >=65 | I/II | Unknown | Unknown | SD |
| HLA-E | SNV | Missense_Mutation | novel | c.911N>T | p.Pro304Leu | p.P304L | | protein_coding | tolerated_low_confidence(0.46) | probably_damaging(0.991) | TCGA-A5-A0G2-01 | Endometrium | uterine corpus endometrioid carcinoma | Female | <65 | III/IV | Unknown | Unknown | SD |
| Entrez ID | Symbol | Category | Interaction Types | Drug Claim Name | Drug Name | PMIDs |
| 3133 | HLA-E | CELL SURFACE, EXTERNAL SIDE OF PLASMA MEMBRANE, CLINICALLY ACTIONABLE | | glucocorticoids | | |
| 3133 | HLA-E | CELL SURFACE, EXTERNAL SIDE OF PLASMA MEMBRANE, CLINICALLY ACTIONABLE | | infliximab | INFLIXIMAB | |
| 3133 | HLA-E | CELL SURFACE, EXTERNAL SIDE OF PLASMA MEMBRANE, CLINICALLY ACTIONABLE | | adalimumab | ADALIMUMAB | |
| 3133 | HLA-E | CELL SURFACE, EXTERNAL SIDE OF PLASMA MEMBRANE, CLINICALLY ACTIONABLE | | methotrexate | METHOTREXATE | |
| 3133 | HLA-E | CELL SURFACE, EXTERNAL SIDE OF PLASMA MEMBRANE, CLINICALLY ACTIONABLE | | certolizumab pegol | | |
| 3133 | HLA-E | CELL SURFACE, EXTERNAL SIDE OF PLASMA MEMBRANE, CLINICALLY ACTIONABLE | | etanercept | ETANERCEPT | |


