
|
|||||
|
 | |
| |
| |
| |
| |
| |
|
Gene: HLA-DRA |
Gene summary for HLA-DRA |
| Gene information | Species | Human | Gene symbol | HLA-DRA | Gene ID | 3122 |
| Gene name | major histocompatibility complex, class II, DR alpha | |
| Gene Alias | HLA-DRA1 | |
| Cytomap | 6p21.32 | |
| Gene Type | protein-coding | GO ID | GO:0001775 | UniProtAcc | A0A0G2JMH6 |
Top |
Malignant transformation analysis |
| Identification of the aberrant gene expression in precancerous and cancerous lesions by comparing the gene expression of stem-like cells in diseased tissues with normal stem cells |
| Entrez ID | Symbol | Replicates | Species | Organ | Tissue | Adj P-value | Log2FC | Malignancy |
| 3122 | HLA-DRA | GSM4909281 | Human | Breast | IDC | 3.12e-04 | 4.46e-01 | 0.21 |
| 3122 | HLA-DRA | GSM4909282 | Human | Breast | IDC | 3.41e-12 | 5.27e-01 | -0.0288 |
| 3122 | HLA-DRA | GSM4909285 | Human | Breast | IDC | 1.52e-05 | -2.54e-01 | 0.21 |
| 3122 | HLA-DRA | GSM4909286 | Human | Breast | IDC | 6.38e-07 | -2.82e-01 | 0.1081 |
| 3122 | HLA-DRA | GSM4909287 | Human | Breast | IDC | 2.10e-20 | 8.45e-01 | 0.2057 |
| 3122 | HLA-DRA | GSM4909290 | Human | Breast | IDC | 6.51e-08 | 5.60e-01 | 0.2096 |
| 3122 | HLA-DRA | GSM4909293 | Human | Breast | IDC | 9.84e-25 | 7.72e-01 | 0.1581 |
| 3122 | HLA-DRA | GSM4909300 | Human | Breast | IDC | 5.51e-14 | 8.37e-01 | 0.0334 |
| 3122 | HLA-DRA | GSM4909305 | Human | Breast | IDC | 2.30e-12 | 6.27e-01 | 0.0436 |
| 3122 | HLA-DRA | GSM4909311 | Human | Breast | IDC | 1.11e-03 | -1.91e-01 | 0.1534 |
| 3122 | HLA-DRA | GSM4909312 | Human | Breast | IDC | 1.34e-05 | -2.57e-01 | 0.1552 |
| 3122 | HLA-DRA | GSM4909315 | Human | Breast | IDC | 2.39e-03 | -2.44e-01 | 0.21 |
| 3122 | HLA-DRA | GSM4909319 | Human | Breast | IDC | 1.10e-05 | 7.27e-02 | 0.1563 |
| 3122 | HLA-DRA | brca10 | Human | Breast | Precancer | 1.01e-03 | -2.44e-01 | -0.0029 |
| 3122 | HLA-DRA | M1 | Human | Breast | IDC | 8.06e-09 | 6.39e-01 | 0.1577 |
| 3122 | HLA-DRA | M2 | Human | Breast | IDC | 1.96e-05 | 7.93e-01 | 0.21 |
| 3122 | HLA-DRA | NCCBC11 | Human | Breast | DCIS | 1.46e-09 | 8.53e-01 | 0.1232 |
| 3122 | HLA-DRA | NCCBC14 | Human | Breast | DCIS | 1.26e-12 | 7.47e-01 | 0.2021 |
| 3122 | HLA-DRA | NCCBC3 | Human | Breast | DCIS | 2.09e-78 | 1.57e+00 | 0.1198 |
| 3122 | HLA-DRA | NCCBC5 | Human | Breast | DCIS | 3.23e-35 | 1.17e+00 | 0.2046 |
| Page: 1 2 3 4 5 6 7 8 9 10 11 12 13 14 |
| Tissue | Expression Dynamics | Abbreviation |
| Breast |  | IDC: Invasive ductal carcinoma |
| DCIS: Ductal carcinoma in situ | ||
| Precancer(BRCA1-mut): Precancerous lesion from BRCA1 mutation carriers | ||
| Cervix |  | CC: Cervix cancer |
| HSIL_HPV: HPV-infected high-grade squamous intraepithelial lesions | ||
| N_HPV: HPV-infected normal cervix | ||
| Colorectum (GSE201348) |  | FAP: Familial adenomatous polyposis |
| CRC: Colorectal cancer | ||
| Colorectum (HTA11) | 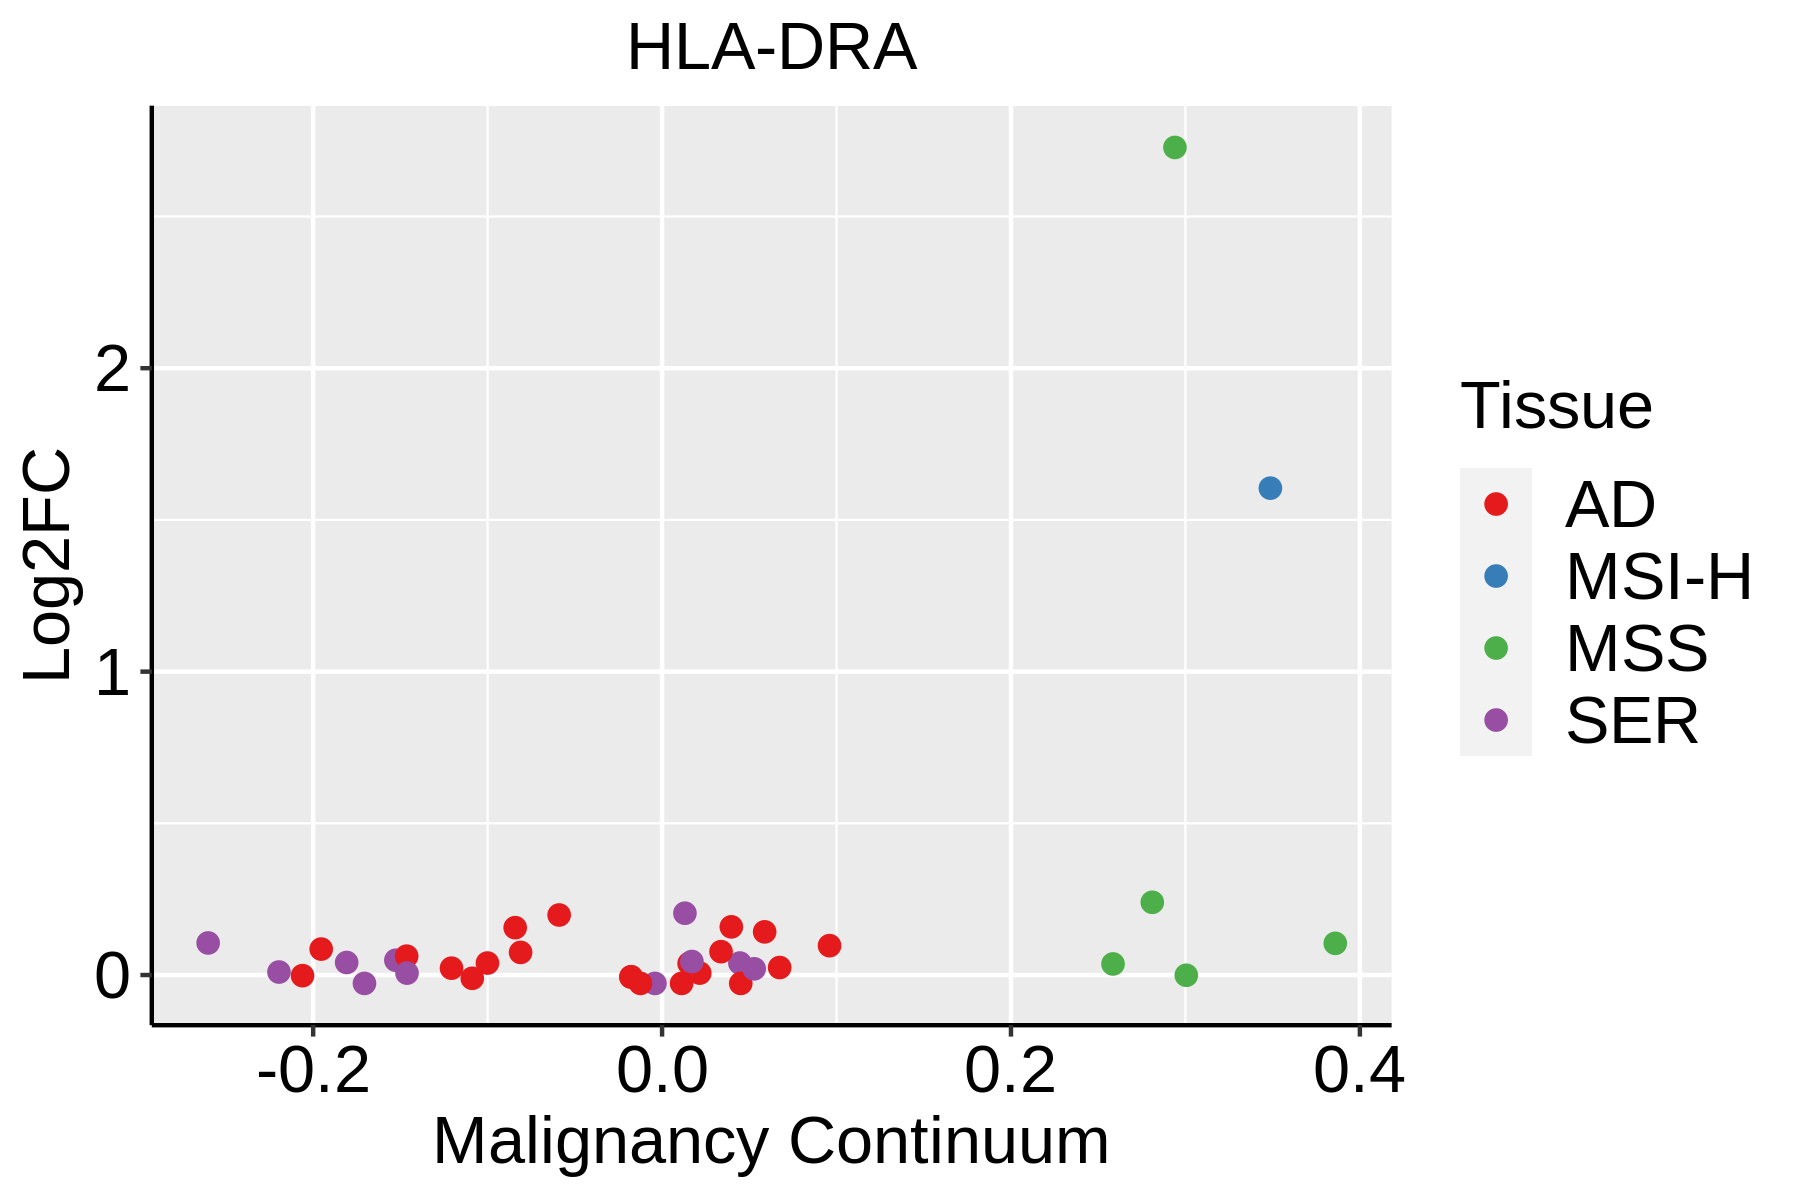 | AD: Adenomas |
| SER: Sessile serrated lesions | ||
| MSI-H: Microsatellite-high colorectal cancer | ||
| MSS: Microsatellite stable colorectal cancer | ||
| Endometrium |  | AEH: Atypical endometrial hyperplasia |
| EEC: Endometrioid Cancer | ||
| Esophagus | 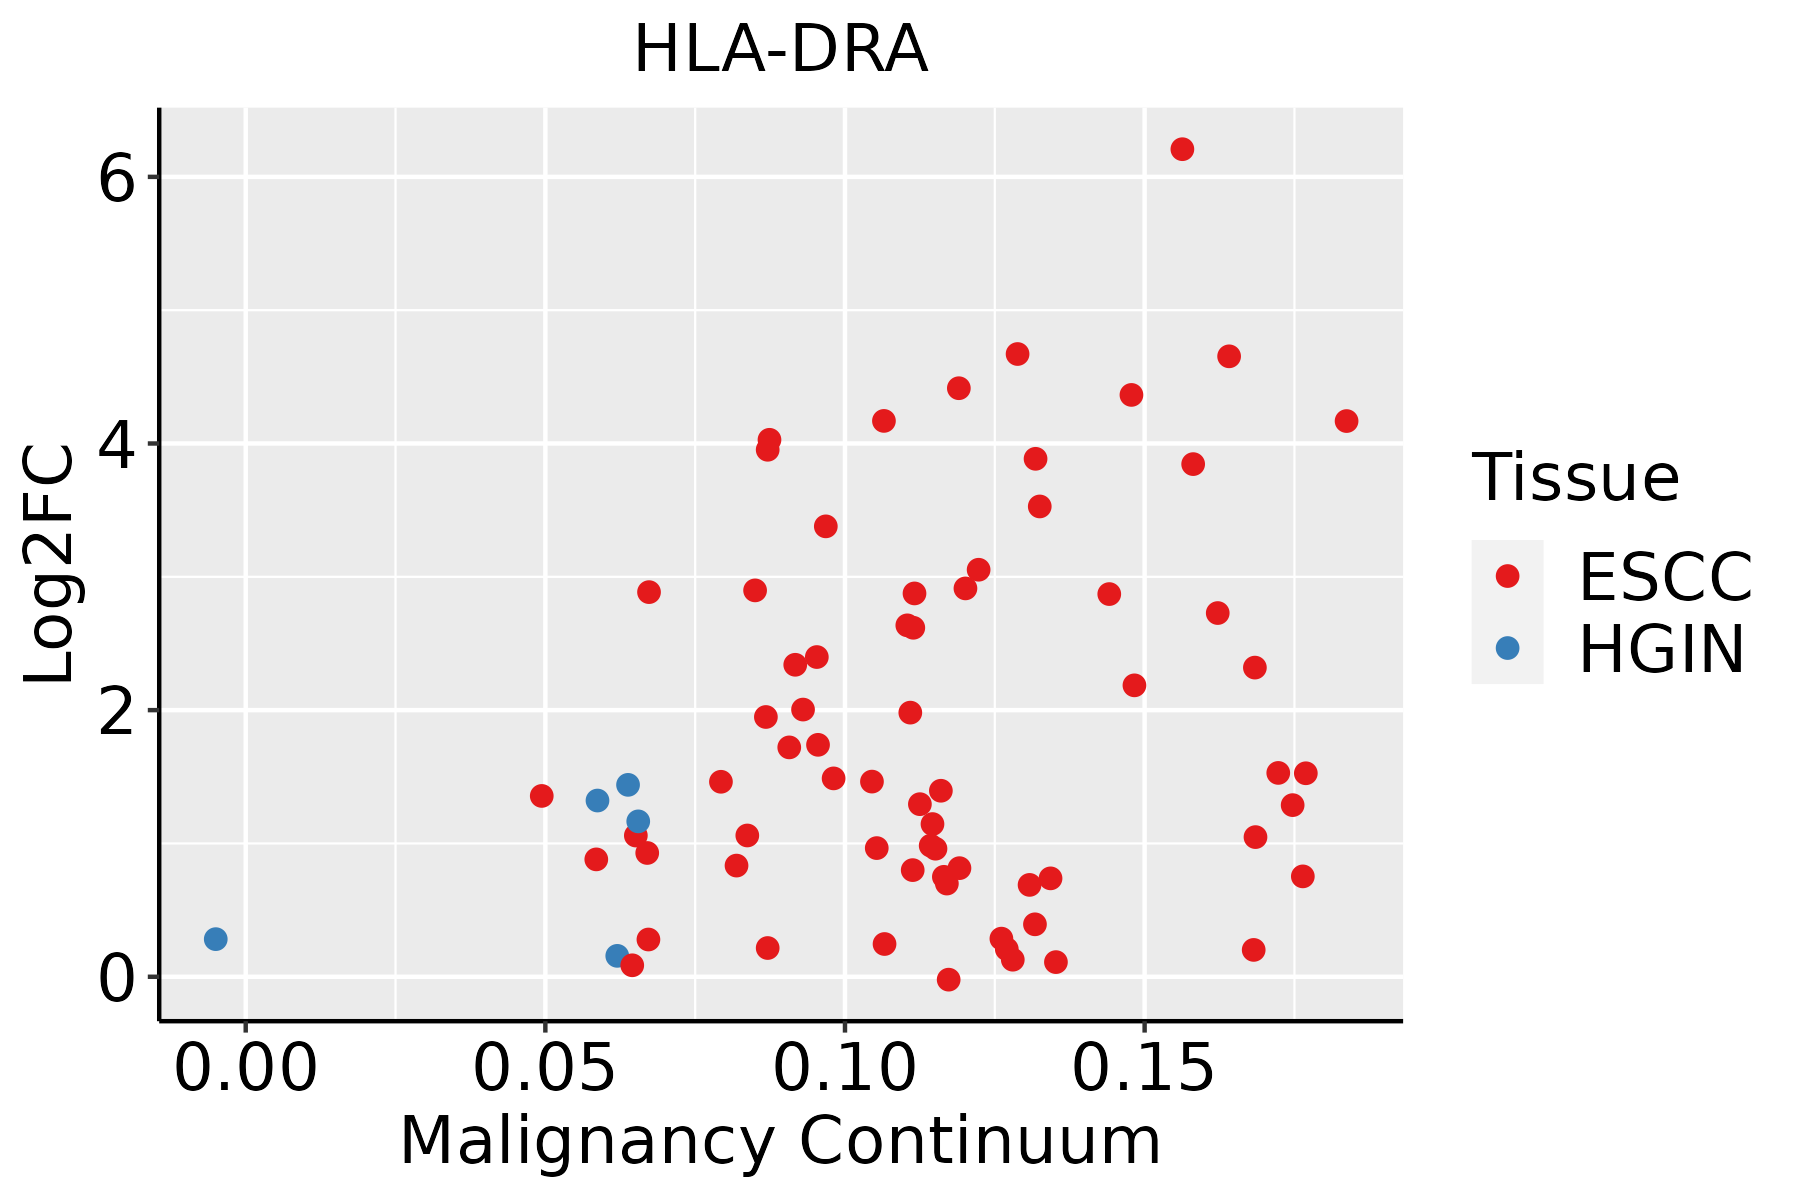 | ESCC: Esophageal squamous cell carcinoma |
| HGIN: High-grade intraepithelial neoplasias | ||
| LGIN: Low-grade intraepithelial neoplasias | ||
| GC |  | CAG: Chronic atrophic gastritis |
| CAG with IM: Chronic atrophic gastritis with intestinal metaplasia | ||
| CSG: Chronic superficial gastritis | ||
| GC: Gastric cancer | ||
| SIM: Severe intestinal metaplasia | ||
| WIM: Wild intestinal metaplasia | ||
| Liver | 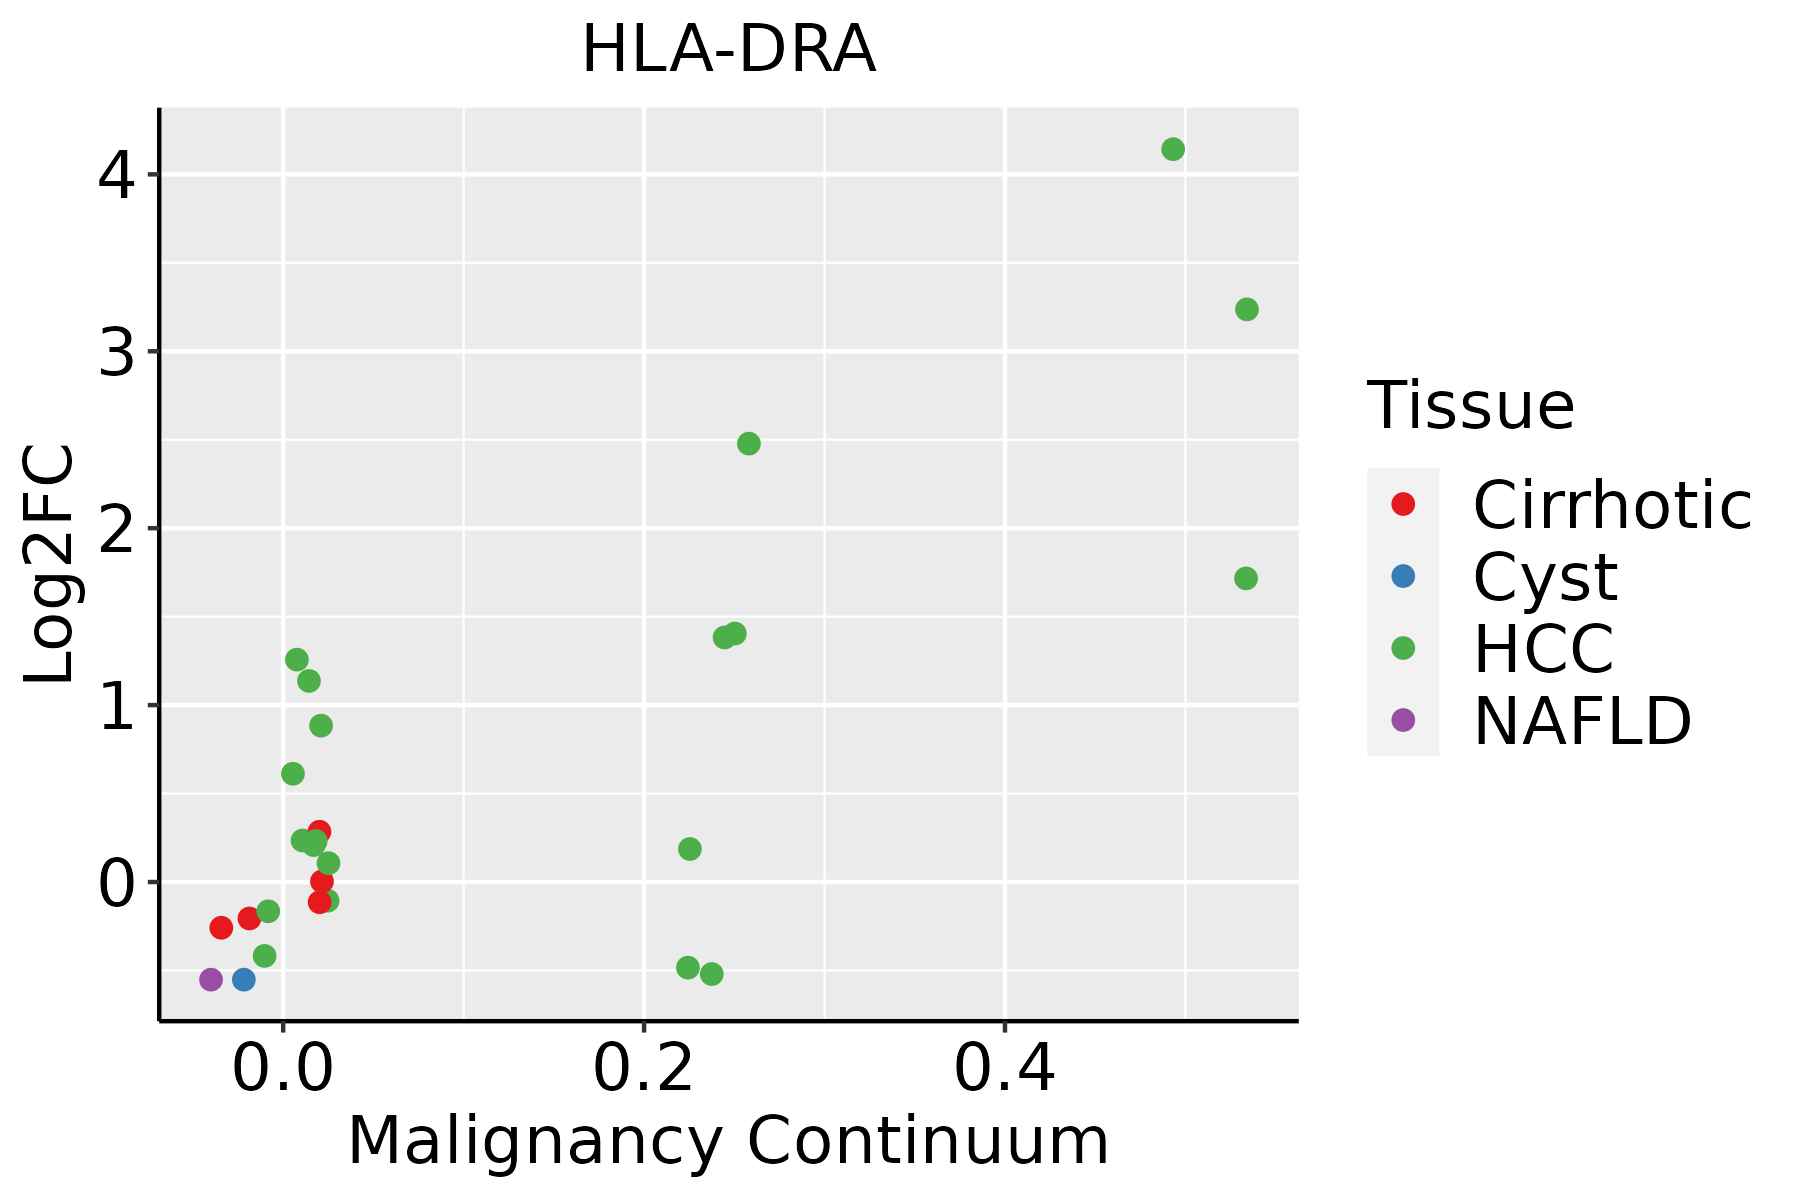 | HCC: Hepatocellular carcinoma |
| NAFLD: Non-alcoholic fatty liver disease | ||
| Lung | 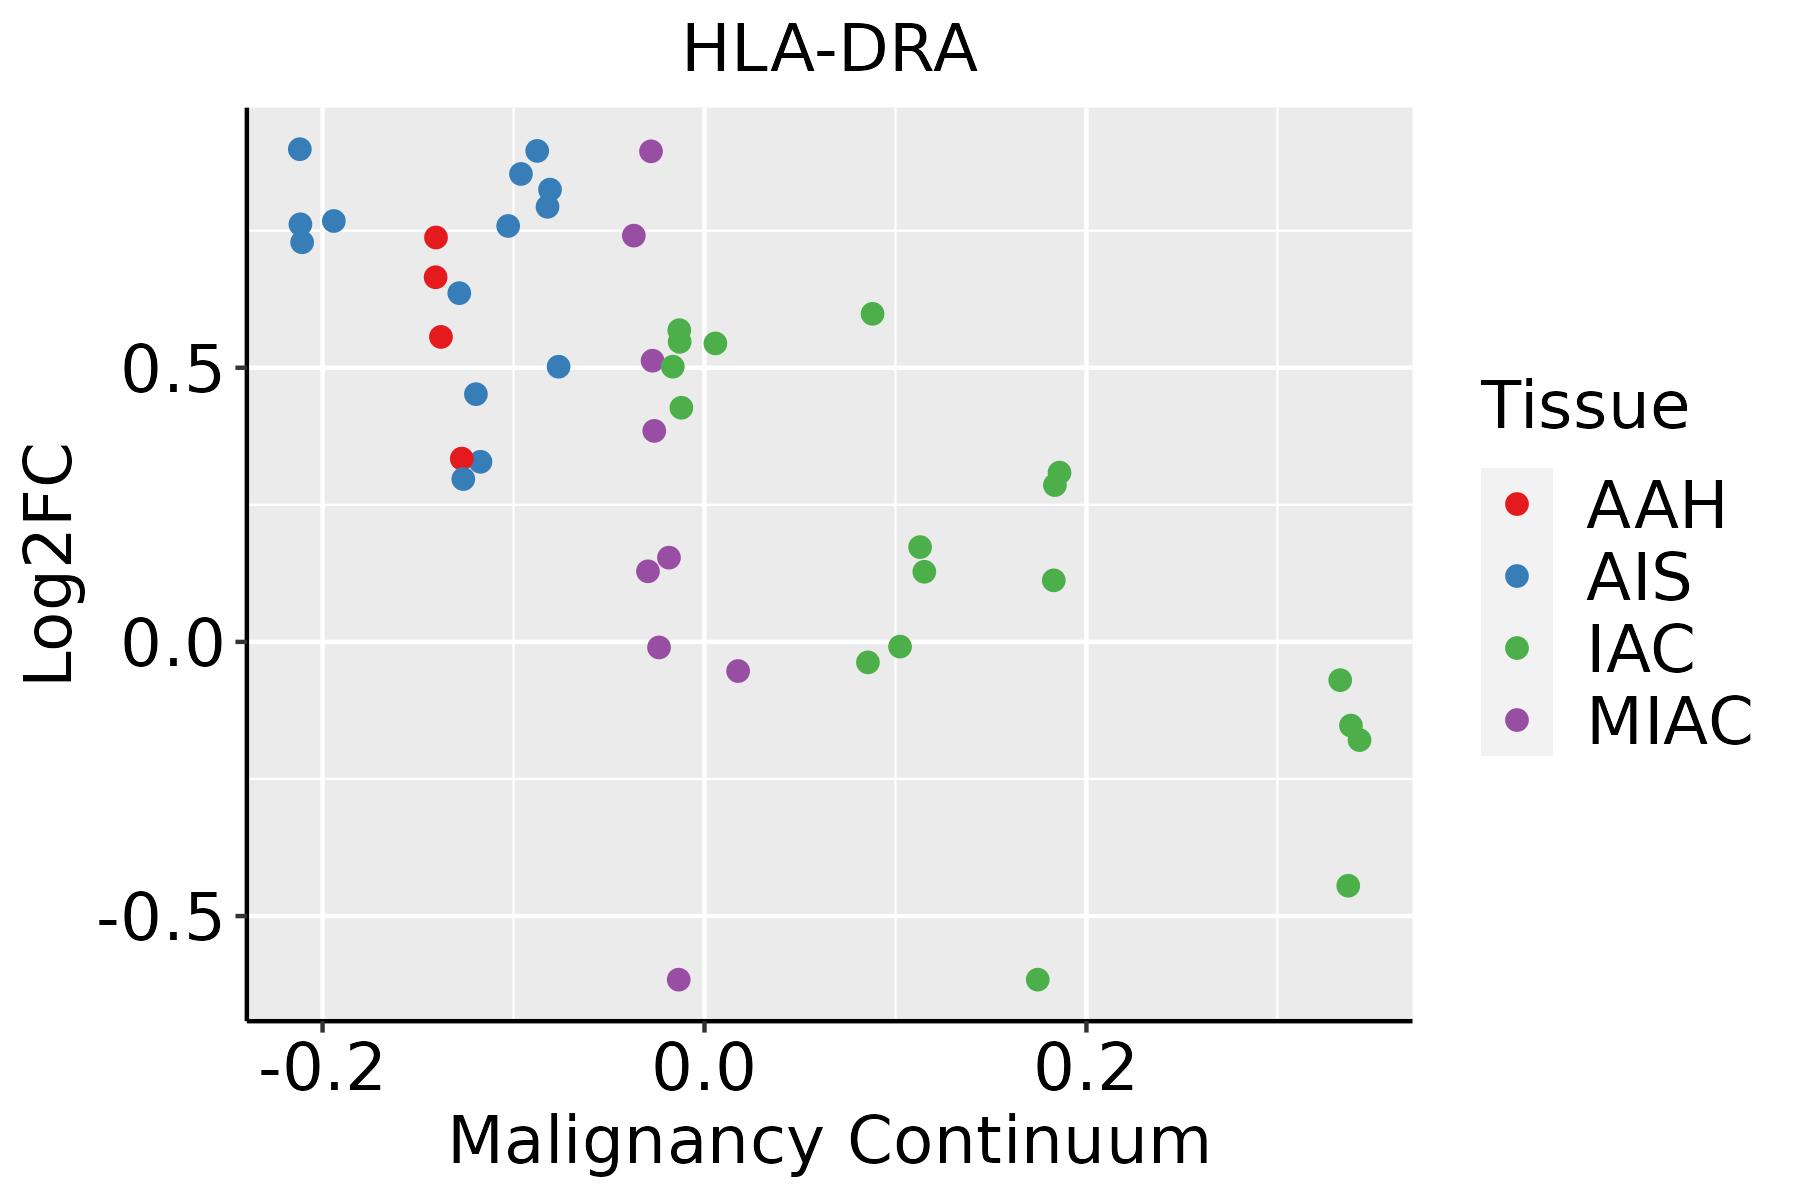 | AAH: Atypical adenomatous hyperplasia |
| AIS: Adenocarcinoma in situ | ||
| IAC: Invasive lung adenocarcinoma | ||
| MIA: Minimally invasive adenocarcinoma | ||
| Oral Cavity |  | EOLP: Erosive Oral lichen planus |
| LP: leukoplakia | ||
| NEOLP: Non-erosive oral lichen planus | ||
| OSCC: Oral squamous cell carcinoma | ||
| Prostate | 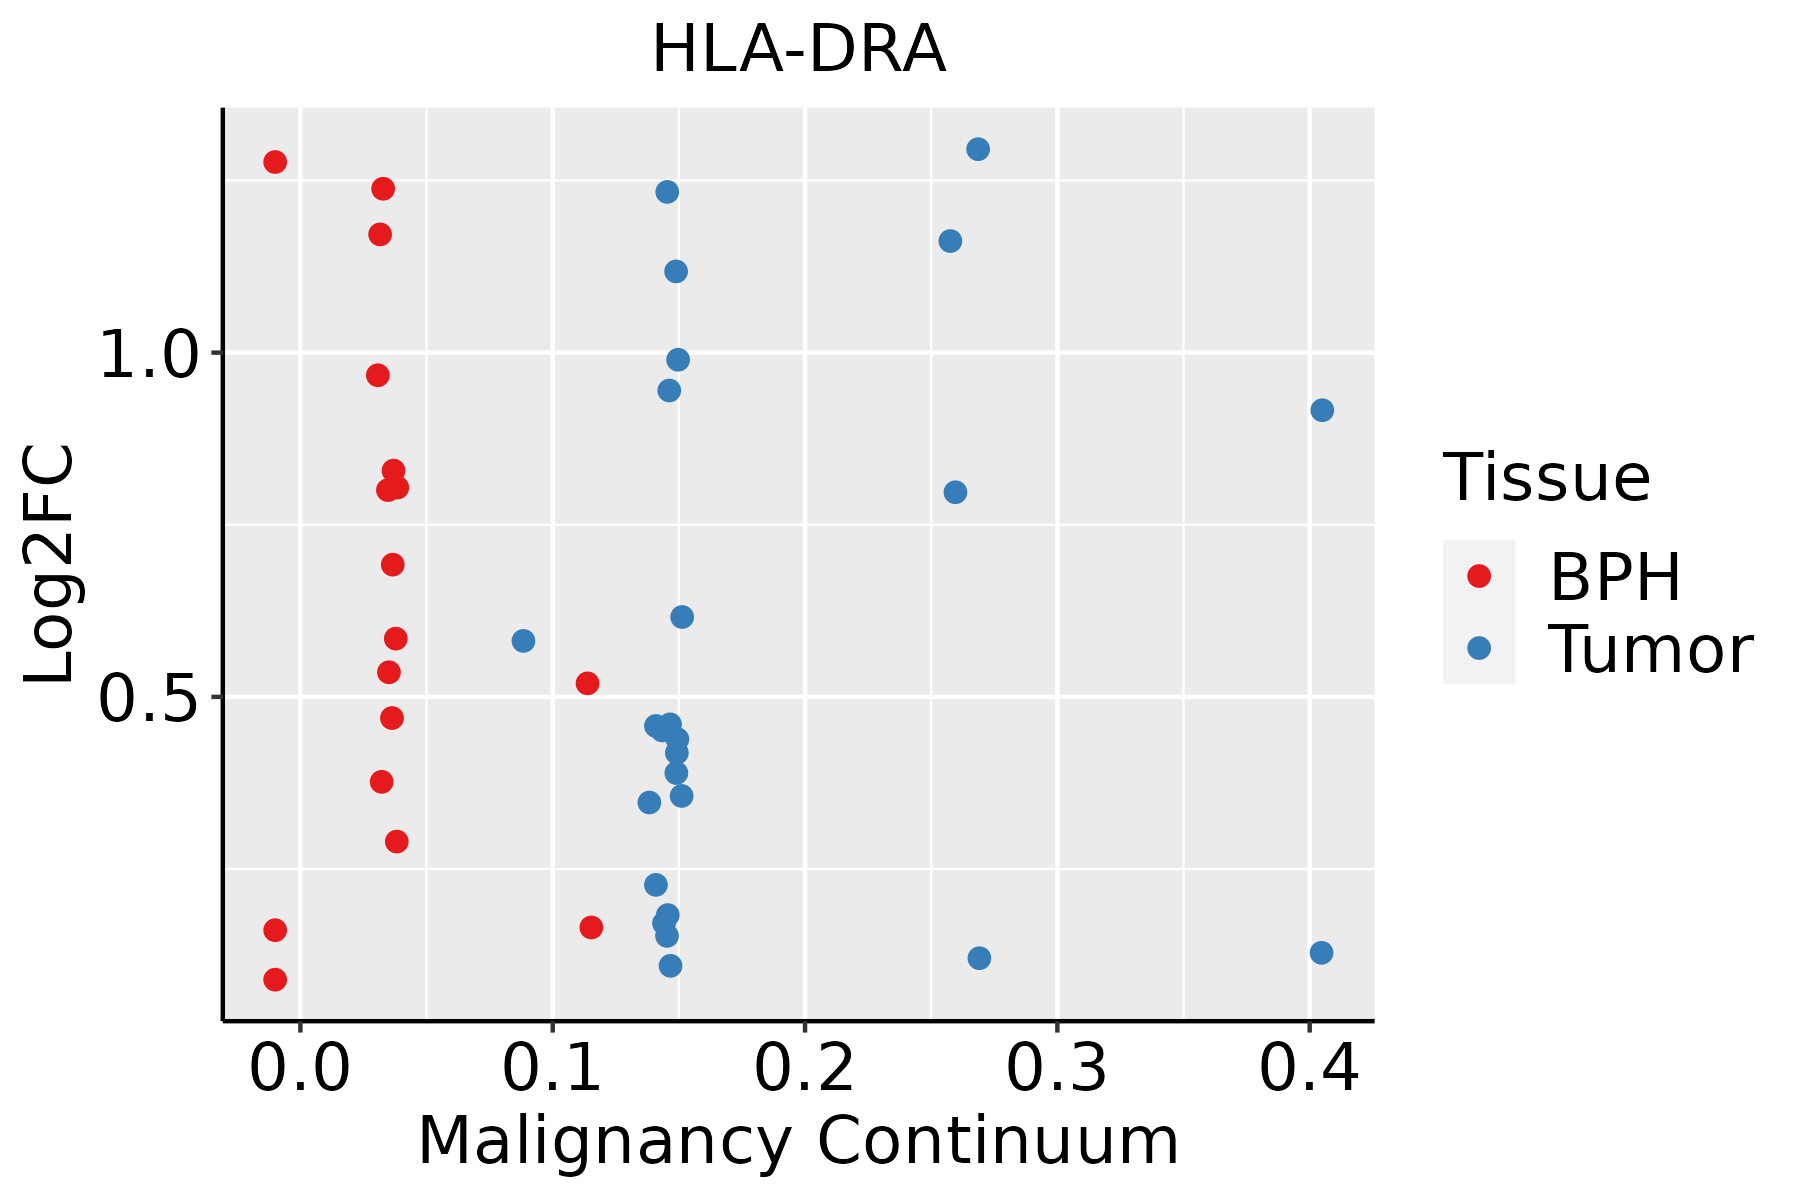 | BPH: Benign Prostatic Hyperplasia |
| Skin |  | AK: Actinic keratosis |
| cSCC: Cutaneous squamous cell carcinoma | ||
| SCCIS:squamous cell carcinoma in situ | ||
| Thyroid |  | ATC: Anaplastic thyroid cancer |
| HT: Hashimoto's thyroiditis | ||
| PTC: Papillary thyroid cancer |
| ∗log2FC in expression of this searched gene in stem-like cells from each diseased tissue sample relative to stem-like cells in normal samples in each tissue plotted against the malignancy continuum. Samples are colored based on if they are from different disease stage. |
Top |
Malignant transformation related pathway analysis |
| Find out the enriched GO biological processes and KEGG pathways involved in transition from healthy to precancer to cancer |
| Tissue | Disease Stage | Enriched GO biological Processes |
| Colorectum | AD |  |
| Colorectum | SER |  |
| Colorectum | MSS |  |
| Colorectum | MSI-H |  |
| Colorectum | FAP |  |
| ∗Top 15 enriched GO BP terms are showed in the bar plot of each disease state in each tissue. Each row represents a significant GO biological process which is colored according to the -log10(p.adjust). |
| Page: 1 2 3 4 5 6 7 8 9 |
| GO ID | Tissue | Disease Stage | Description | Gene Ratio | Bg Ratio | pvalue | p.adjust | Count |
| GO:00457859 | Breast | Precancer | positive regulation of cell adhesion | 52/1080 | 437/18723 | 5.74e-07 | 2.49e-05 | 52 |
| GO:00024839 | Breast | Precancer | antigen processing and presentation of endogenous peptide antigen | 8/1080 | 19/18723 | 5.10e-06 | 1.53e-04 | 8 |
| GO:00198839 | Breast | Precancer | antigen processing and presentation of endogenous antigen | 9/1080 | 26/18723 | 8.75e-06 | 2.34e-04 | 9 |
| GO:00421107 | Breast | Precancer | T cell activation | 52/1080 | 487/18723 | 1.37e-05 | 3.42e-04 | 52 |
| GO:00508707 | Breast | Precancer | positive regulation of T cell activation | 29/1080 | 216/18723 | 1.94e-05 | 4.58e-04 | 29 |
| GO:19037069 | Breast | Precancer | regulation of hemopoiesis | 41/1080 | 367/18723 | 3.95e-05 | 8.52e-04 | 41 |
| GO:19030396 | Breast | Precancer | positive regulation of leukocyte cell-cell adhesion | 30/1080 | 239/18723 | 5.13e-05 | 1.07e-03 | 30 |
| GO:00027117 | Breast | Precancer | positive regulation of T cell mediated immunity | 12/1080 | 56/18723 | 6.72e-05 | 1.35e-03 | 12 |
| GO:00508637 | Breast | Precancer | regulation of T cell activation | 37/1080 | 329/18723 | 8.04e-05 | 1.56e-03 | 37 |
| GO:00224098 | Breast | Precancer | positive regulation of cell-cell adhesion | 33/1080 | 284/18723 | 1.03e-04 | 1.89e-03 | 33 |
| GO:00071597 | Breast | Precancer | leukocyte cell-cell adhesion | 40/1080 | 371/18723 | 1.07e-04 | 1.94e-03 | 40 |
| GO:19021055 | Breast | Precancer | regulation of leukocyte differentiation | 32/1080 | 279/18723 | 1.66e-04 | 2.74e-03 | 32 |
| GO:00019168 | Breast | Precancer | positive regulation of T cell mediated cytotoxicity | 8/1080 | 29/18723 | 1.73e-04 | 2.83e-03 | 8 |
| GO:00480029 | Breast | Precancer | antigen processing and presentation of peptide antigen | 12/1080 | 62/18723 | 1.89e-04 | 3.04e-03 | 12 |
| GO:00224079 | Breast | Precancer | regulation of cell-cell adhesion | 45/1080 | 448/18723 | 2.12e-04 | 3.30e-03 | 45 |
| GO:19031313 | Breast | Precancer | mononuclear cell differentiation | 43/1080 | 426/18723 | 2.61e-04 | 3.84e-03 | 43 |
| GO:19030377 | Breast | Precancer | regulation of leukocyte cell-cell adhesion | 36/1080 | 336/18723 | 2.61e-04 | 3.84e-03 | 36 |
| GO:00027094 | Breast | Precancer | regulation of T cell mediated immunity | 13/1080 | 85/18723 | 1.12e-03 | 1.23e-02 | 13 |
| GO:00024789 | Breast | Precancer | antigen processing and presentation of exogenous peptide antigen | 8/1080 | 38/18723 | 1.24e-03 | 1.32e-02 | 8 |
| GO:00019146 | Breast | Precancer | regulation of T cell mediated cytotoxicity | 8/1080 | 39/18723 | 1.48e-03 | 1.53e-02 | 8 |
| Page: 1 2 3 4 5 6 7 8 9 10 11 12 13 14 15 16 17 18 19 20 21 22 23 24 25 26 27 28 29 30 31 32 33 34 35 36 37 38 39 40 41 42 43 44 45 46 47 |
| Pathway ID | Tissue | Disease Stage | Description | Gene Ratio | Bg Ratio | pvalue | p.adjust | qvalue | Count |
| hsa0516918 | Breast | Precancer | Epstein-Barr virus infection | 35/684 | 202/8465 | 1.15e-05 | 1.26e-04 | 9.64e-05 | 35 |
| hsa0516618 | Breast | Precancer | Human T-cell leukemia virus 1 infection | 33/684 | 222/8465 | 4.29e-04 | 3.31e-03 | 2.53e-03 | 33 |
| hsa0516919 | Breast | Precancer | Epstein-Barr virus infection | 35/684 | 202/8465 | 1.15e-05 | 1.26e-04 | 9.64e-05 | 35 |
| hsa0516619 | Breast | Precancer | Human T-cell leukemia virus 1 infection | 33/684 | 222/8465 | 4.29e-04 | 3.31e-03 | 2.53e-03 | 33 |
| hsa0516922 | Breast | IDC | Epstein-Barr virus infection | 45/867 | 202/8465 | 3.16e-07 | 6.05e-06 | 4.52e-06 | 45 |
| hsa0461223 | Breast | IDC | Antigen processing and presentation | 24/867 | 78/8465 | 4.61e-07 | 8.33e-06 | 6.23e-06 | 24 |
| hsa0414522 | Breast | IDC | Phagosome | 34/867 | 152/8465 | 8.00e-06 | 9.99e-05 | 7.48e-05 | 34 |
| hsa0541623 | Breast | IDC | Viral myocarditis | 18/867 | 60/8465 | 1.85e-05 | 2.01e-04 | 1.50e-04 | 18 |
| hsa0516624 | Breast | IDC | Human T-cell leukemia virus 1 infection | 40/867 | 222/8465 | 2.52e-04 | 2.21e-03 | 1.66e-03 | 40 |
| hsa0532321 | Breast | IDC | Rheumatoid arthritis | 21/867 | 93/8465 | 3.69e-04 | 3.15e-03 | 2.36e-03 | 21 |
| hsa0494014 | Breast | IDC | Type I diabetes mellitus | 12/867 | 43/8465 | 9.40e-04 | 7.28e-03 | 5.44e-03 | 12 |
| hsa0533012 | Breast | IDC | Allograft rejection | 11/867 | 38/8465 | 1.09e-03 | 8.26e-03 | 6.18e-03 | 11 |
| hsa0533210 | Breast | IDC | Graft-versus-host disease | 11/867 | 42/8465 | 2.66e-03 | 1.80e-02 | 1.35e-02 | 11 |
| hsa0514012 | Breast | IDC | Leishmaniasis | 16/867 | 77/8465 | 4.35e-03 | 2.57e-02 | 1.92e-02 | 16 |
| hsa0532010 | Breast | IDC | Autoimmune thyroid disease | 12/867 | 53/8465 | 6.29e-03 | 3.30e-02 | 2.47e-02 | 12 |
| hsa0516932 | Breast | IDC | Epstein-Barr virus infection | 45/867 | 202/8465 | 3.16e-07 | 6.05e-06 | 4.52e-06 | 45 |
| hsa0461233 | Breast | IDC | Antigen processing and presentation | 24/867 | 78/8465 | 4.61e-07 | 8.33e-06 | 6.23e-06 | 24 |
| hsa0414532 | Breast | IDC | Phagosome | 34/867 | 152/8465 | 8.00e-06 | 9.99e-05 | 7.48e-05 | 34 |
| hsa0541633 | Breast | IDC | Viral myocarditis | 18/867 | 60/8465 | 1.85e-05 | 2.01e-04 | 1.50e-04 | 18 |
| hsa0516634 | Breast | IDC | Human T-cell leukemia virus 1 infection | 40/867 | 222/8465 | 2.52e-04 | 2.21e-03 | 1.66e-03 | 40 |
| Page: 1 2 3 4 5 6 7 8 9 10 11 12 13 14 15 16 17 18 19 20 21 22 23 24 25 26 27 |
Top |
Cell-cell communication analysis |
| Identification of potential cell-cell interactions between two cell types and their ligand-receptor pairs for different disease states |
| Ligand | Receptor | LRpair | Pathway | Tissue | Disease Stage |
| HLA-DRA | CD4 | HLA-DRA_CD4 | MHC-II | Breast | DCIS |
| HLA-DRA | CD4 | HLA-DRA_CD4 | MHC-II | Breast | Healthy |
| HLA-DRA | CD4 | HLA-DRA_CD4 | MHC-II | Breast | IDC |
| HLA-DRA | CD4 | HLA-DRA_CD4 | MHC-II | Cervix | ADJ |
| HLA-DRA | CD4 | HLA-DRA_CD4 | MHC-II | Cervix | CC |
| HLA-DRA | CD4 | HLA-DRA_CD4 | MHC-II | Cervix | Healthy |
| HLA-DRA | CD4 | HLA-DRA_CD4 | MHC-II | Cervix | Precancer |
| HLA-DRA | CD4 | HLA-DRA_CD4 | MHC-II | CRC | AD |
| HLA-DRA | CD4 | HLA-DRA_CD4 | MHC-II | CRC | ADJ |
| HLA-DRA | CD4 | HLA-DRA_CD4 | MHC-II | CRC | FAP |
| HLA-DRA | CD4 | HLA-DRA_CD4 | MHC-II | CRC | MSI-H |
| HLA-DRA | CD4 | HLA-DRA_CD4 | MHC-II | CRC | MSS |
| HLA-DRA | CD4 | HLA-DRA_CD4 | MHC-II | CRC | SER |
| HLA-DRA | CD4 | HLA-DRA_CD4 | MHC-II | Endometrium | ADJ |
| HLA-DRA | CD4 | HLA-DRA_CD4 | MHC-II | Endometrium | AEH |
| HLA-DRA | CD4 | HLA-DRA_CD4 | MHC-II | Endometrium | EEC |
| HLA-DRA | CD4 | HLA-DRA_CD4 | MHC-II | Endometrium | Healthy |
| HLA-DRA | CD4 | HLA-DRA_CD4 | MHC-II | HNSCC | ADJ |
| HLA-DRA | CD4 | HLA-DRA_CD4 | MHC-II | HNSCC | Healthy |
| HLA-DRA | CD4 | HLA-DRA_CD4 | MHC-II | HNSCC | Precancer |
| Page: 1 2 |
Top |
Single-cell gene regulatory network inference analysis |
| Find out the significant the regulons (TFs) and the target genes of each regulon across cell types for different disease states |
| TF | Cell Type | Tissue | Disease Stage | Target Gene | RSS | Regulon Activity |
| ∗The dot plots of a searched regulon are shown for all cell subpopulations in each disease state of each tissue based on the regulon specific score inferred using pySCENIC and by calculating the average expression. |
| Page: 1 |
Top |
Somatic mutation of malignant transformation related genes |
| Annotation of somatic variants for genes involved in malignant transformation |
| Hugo Symbol | Variant Class | Variant Classification | dbSNP RS | HGVSc | HGVSp | HGVSp Short | SWISSPROT | BIOTYPE | SIFT | PolyPhen | Tumor Sample Barcode | Tissue | Histology | Sex | Age | Stage | Therapy Types | Drugs | Outcome |
| HLA-DRA | SNV | Missense_Mutation | novel | c.136G>A | p.Glu46Lys | p.E46K | P01903 | protein_coding | deleterious(0) | probably_damaging(1) | TCGA-2W-A8YY-01 | Cervix | cervical & endocervical cancer | Female | <65 | I/II | Chemotherapy | cisplatin | CR |
| HLA-DRA | SNV | Missense_Mutation | c.595N>A | p.Leu199Ile | p.L199I | P01903 | protein_coding | deleterious(0.03) | benign(0.017) | TCGA-EK-A2PI-01 | Cervix | cervical & endocervical cancer | Female | <65 | III/IV | Unknown | Unknown | SD | |
| HLA-DRA | SNV | Missense_Mutation | c.607T>C | p.Trp203Arg | p.W203R | P01903 | protein_coding | deleterious(0.01) | possibly_damaging(0.459) | TCGA-A6-5665-01 | Colorectum | colon adenocarcinoma | Female | >=65 | I/II | Unknown | Unknown | PD | |
| HLA-DRA | SNV | Missense_Mutation | c.176N>C | p.Val59Ala | p.V59A | P01903 | protein_coding | deleterious(0.01) | probably_damaging(0.925) | TCGA-A6-6141-01 | Colorectum | colon adenocarcinoma | Male | <65 | I/II | Chemotherapy | 5-fu | SD | |
| HLA-DRA | SNV | Missense_Mutation | rs751526731 | c.205N>T | p.Arg69Trp | p.R69W | P01903 | protein_coding | tolerated(0.09) | probably_damaging(1) | TCGA-A6-6142-01 | Colorectum | colon adenocarcinoma | Female | <65 | I/II | Chemotherapy | fluorouracil | PD |
| HLA-DRA | SNV | Missense_Mutation | c.695N>C | p.Ile232Thr | p.I232T | P01903 | protein_coding | tolerated(0.06) | benign(0.043) | TCGA-AA-3495-01 | Colorectum | colon adenocarcinoma | Male | >=65 | I/II | Unknown | Unknown | SD | |
| HLA-DRA | SNV | Missense_Mutation | c.748N>T | p.Arg250Cys | p.R250C | P01903 | protein_coding | tolerated(0.23) | benign(0.031) | TCGA-AA-3511-01 | Colorectum | colon adenocarcinoma | Male | <65 | I/II | Unknown | Unknown | PD | |
| HLA-DRA | SNV | Missense_Mutation | c.385N>A | p.Val129Ile | p.V129I | P01903 | protein_coding | tolerated(1) | benign(0) | TCGA-AA-3864-01 | Colorectum | colon adenocarcinoma | Male | >=65 | I/II | Unknown | Unknown | SD | |
| HLA-DRA | SNV | Missense_Mutation | c.371N>C | p.Leu124Pro | p.L124P | P01903 | protein_coding | deleterious(0.02) | benign(0.149) | TCGA-D5-6927-01 | Colorectum | colon adenocarcinoma | Male | <65 | I/II | Unknown | Unknown | SD | |
| HLA-DRA | SNV | Missense_Mutation | c.97A>G | p.Ile33Val | p.I33V | P01903 | protein_coding | tolerated(0.28) | benign(0.353) | TCGA-NH-A5IV-01 | Colorectum | colon adenocarcinoma | Female | >=65 | I/II | Unknown | Unknown | SD |
| Page: 1 2 3 4 |
Top |
Related drugs of malignant transformation related genes |
| Identification of chemicals and drugs interact with genes involved in malignant transfromation |
| (DGIdb 4.0) |
| Entrez ID | Symbol | Category | Interaction Types | Drug Claim Name | Drug Name | PMIDs |
| 3122 | HLA-DRA | DRUGGABLE GENOME, CELL SURFACE, CLINICALLY ACTIONABLE | amoxicillin | AMOXICILLIN | 30664875 | |
| 3122 | HLA-DRA | DRUGGABLE GENOME, CELL SURFACE, CLINICALLY ACTIONABLE | NIVOLUMAB | NIVOLUMAB | 26822383 | |
| 3122 | HLA-DRA | DRUGGABLE GENOME, CELL SURFACE, CLINICALLY ACTIONABLE | PEMBROLIZUMAB | PEMBROLIZUMAB | 26822383 | |
| 3122 | HLA-DRA | DRUGGABLE GENOME, CELL SURFACE, CLINICALLY ACTIONABLE | clavulanate | CLAVULANIC ACID | 30664875 | |
| 3122 | HLA-DRA | DRUGGABLE GENOME, CELL SURFACE, CLINICALLY ACTIONABLE | ATEZOLIZUMAB | ATEZOLIZUMAB | 26822383 | |
| 3122 | HLA-DRA | DRUGGABLE GENOME, CELL SURFACE, CLINICALLY ACTIONABLE | flucloxacillin | FLOXACILLIN | 30664875 |
| Page: 1 |

Copyright 2023-Present -The University of Texas Health Science Center at Houston |