
|
|||||
|
 | |
| |
| |
| |
| |
| |
|
Gene: HLA-DQA2 |
Gene summary for HLA-DQA2 |
| Gene information | Species | Human | Gene symbol | HLA-DQA2 | Gene ID | 3118 |
| Gene name | major histocompatibility complex, class II, DQ alpha 2 | |
| Gene Alias | DC-alpha | |
| Cytomap | 6p21.32 | |
| Gene Type | protein-coding | GO ID | GO:0001775 | UniProtAcc | P01906 |
Top |
Malignant transformation analysis |
| Identification of the aberrant gene expression in precancerous and cancerous lesions by comparing the gene expression of stem-like cells in diseased tissues with normal stem cells |
| Entrez ID | Symbol | Replicates | Species | Organ | Tissue | Adj P-value | Log2FC | Malignancy |
| 3118 | HLA-DQA2 | CA_HPV_1 | Human | Cervix | CC | 3.81e-16 | 6.39e-01 | 0.0264 |
| 3118 | HLA-DQA2 | CA_HPV_2 | Human | Cervix | CC | 2.80e-02 | -2.85e-01 | 0.0391 |
| 3118 | HLA-DQA2 | HSIL_HPV_1 | Human | Cervix | HSIL_HPV | 5.49e-03 | 5.26e-01 | 0.0116 |
| 3118 | HLA-DQA2 | HSIL_HPV_2 | Human | Cervix | HSIL_HPV | 8.27e-07 | 6.11e-01 | 0.0208 |
| 3118 | HLA-DQA2 | N_HPV_1 | Human | Cervix | N_HPV | 1.93e-08 | 6.49e-01 | 0.0079 |
| 3118 | HLA-DQA2 | CCII_1 | Human | Cervix | CC | 2.48e-03 | -3.07e-01 | 0.3249 |
| 3118 | HLA-DQA2 | Tumor | Human | Cervix | CC | 2.90e-05 | -3.00e-01 | 0.1241 |
| 3118 | HLA-DQA2 | sample1 | Human | Cervix | CC | 2.31e-02 | -3.07e-01 | 0.0959 |
| 3118 | HLA-DQA2 | sample3 | Human | Cervix | CC | 1.29e-05 | -2.99e-01 | 0.1387 |
| 3118 | HLA-DQA2 | H2 | Human | Cervix | HSIL_HPV | 4.20e-07 | -3.07e-01 | 0.0632 |
| 3118 | HLA-DQA2 | T1 | Human | Cervix | CC | 3.99e-08 | -3.07e-01 | 0.0918 |
| 3118 | HLA-DQA2 | T3 | Human | Cervix | CC | 4.20e-08 | -3.07e-01 | 0.1389 |
| 3118 | HLA-DQA2 | LZE6T | Human | Esophagus | ESCC | 8.66e-03 | 1.53e-01 | 0.0845 |
| 3118 | HLA-DQA2 | P1T-E | Human | Esophagus | ESCC | 7.89e-03 | 8.75e-01 | 0.0875 |
| 3118 | HLA-DQA2 | P2T-E | Human | Esophagus | ESCC | 4.99e-24 | 8.99e-01 | 0.1177 |
| 3118 | HLA-DQA2 | P11T-E | Human | Esophagus | ESCC | 5.47e-21 | 1.31e+00 | 0.1426 |
| 3118 | HLA-DQA2 | P17T-E | Human | Esophagus | ESCC | 5.39e-04 | 4.48e-01 | 0.1278 |
| 3118 | HLA-DQA2 | P21T-E | Human | Esophagus | ESCC | 4.87e-10 | 4.62e-01 | 0.1617 |
| 3118 | HLA-DQA2 | P24T-E | Human | Esophagus | ESCC | 1.27e-21 | 6.47e-01 | 0.1287 |
| 3118 | HLA-DQA2 | P37T-E | Human | Esophagus | ESCC | 7.46e-03 | 3.48e-01 | 0.1371 |
| Page: 1 2 |
| Tissue | Expression Dynamics | Abbreviation |
| Cervix |  | CC: Cervix cancer |
| HSIL_HPV: HPV-infected high-grade squamous intraepithelial lesions | ||
| N_HPV: HPV-infected normal cervix | ||
| Esophagus | 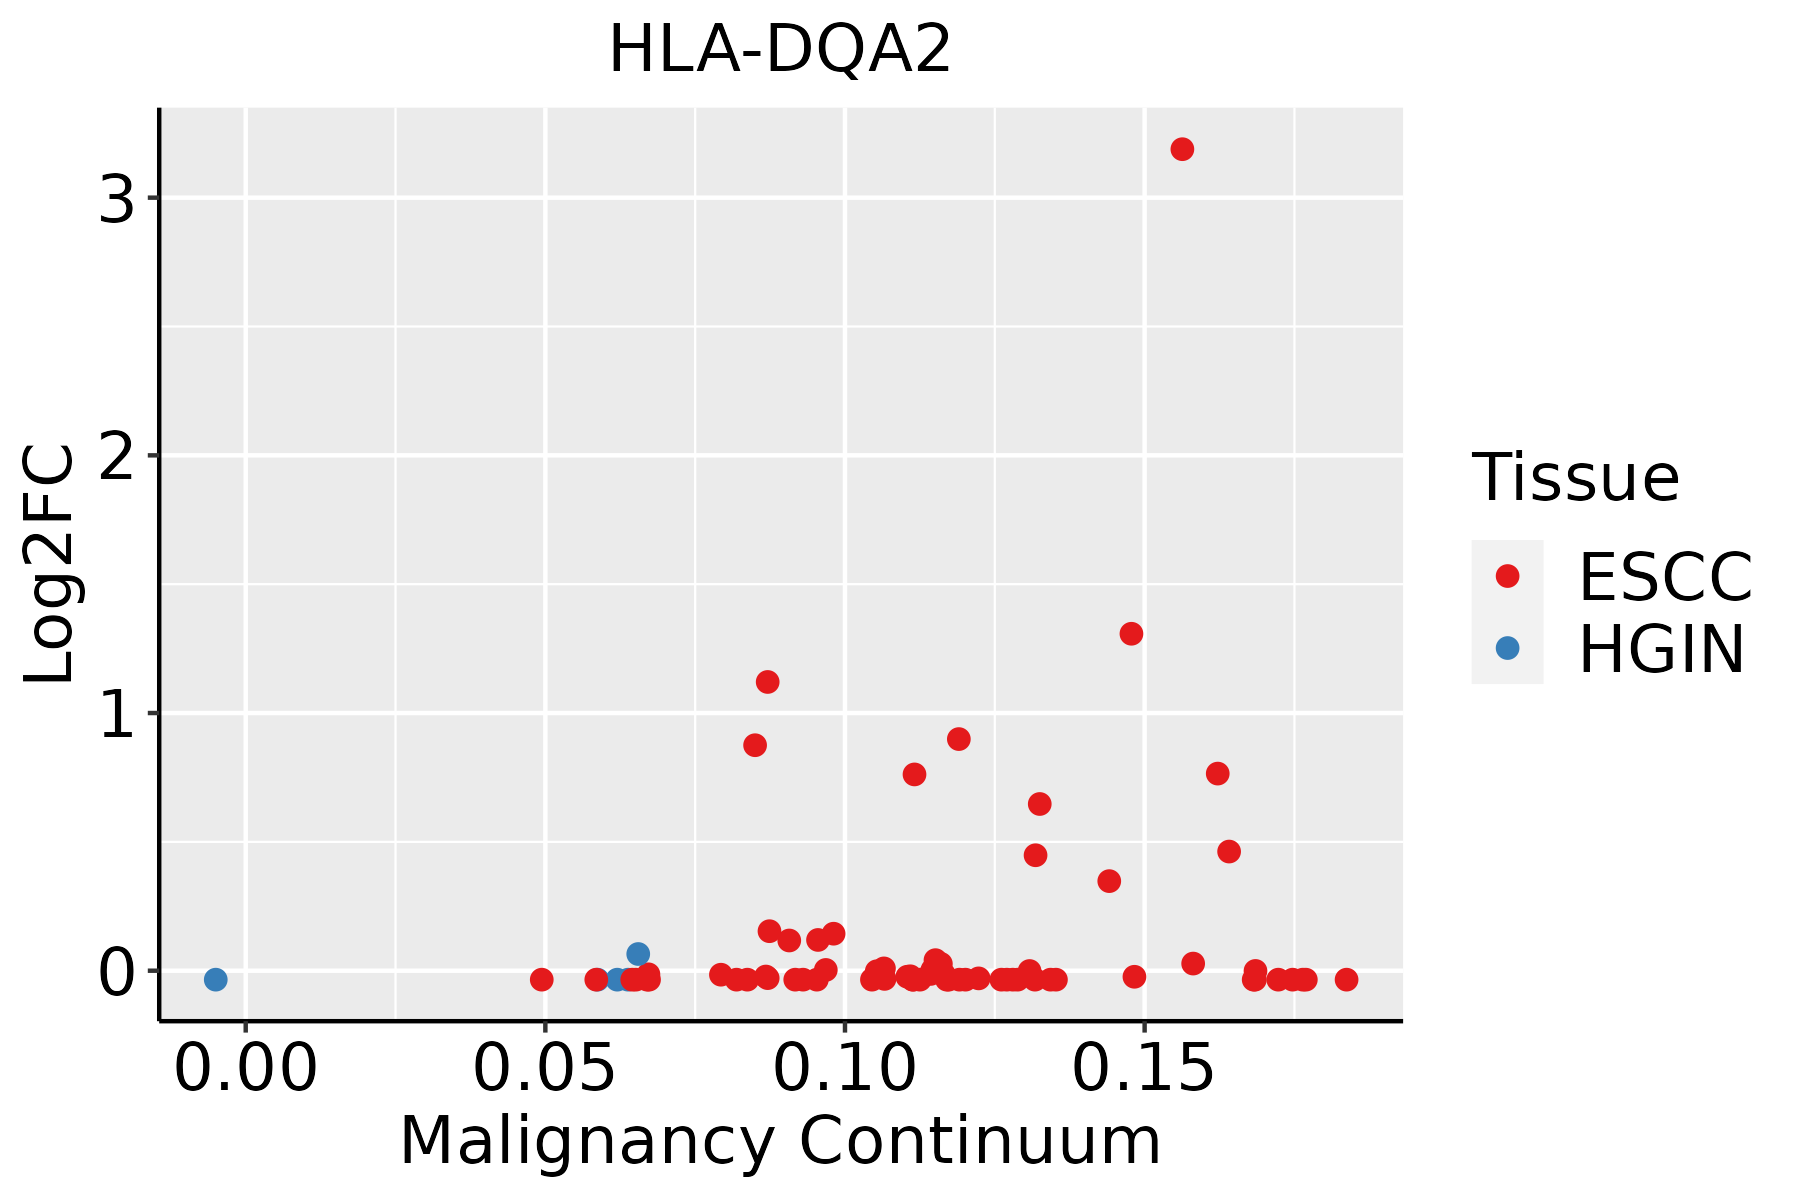 | ESCC: Esophageal squamous cell carcinoma |
| HGIN: High-grade intraepithelial neoplasias | ||
| LGIN: Low-grade intraepithelial neoplasias | ||
| GC | 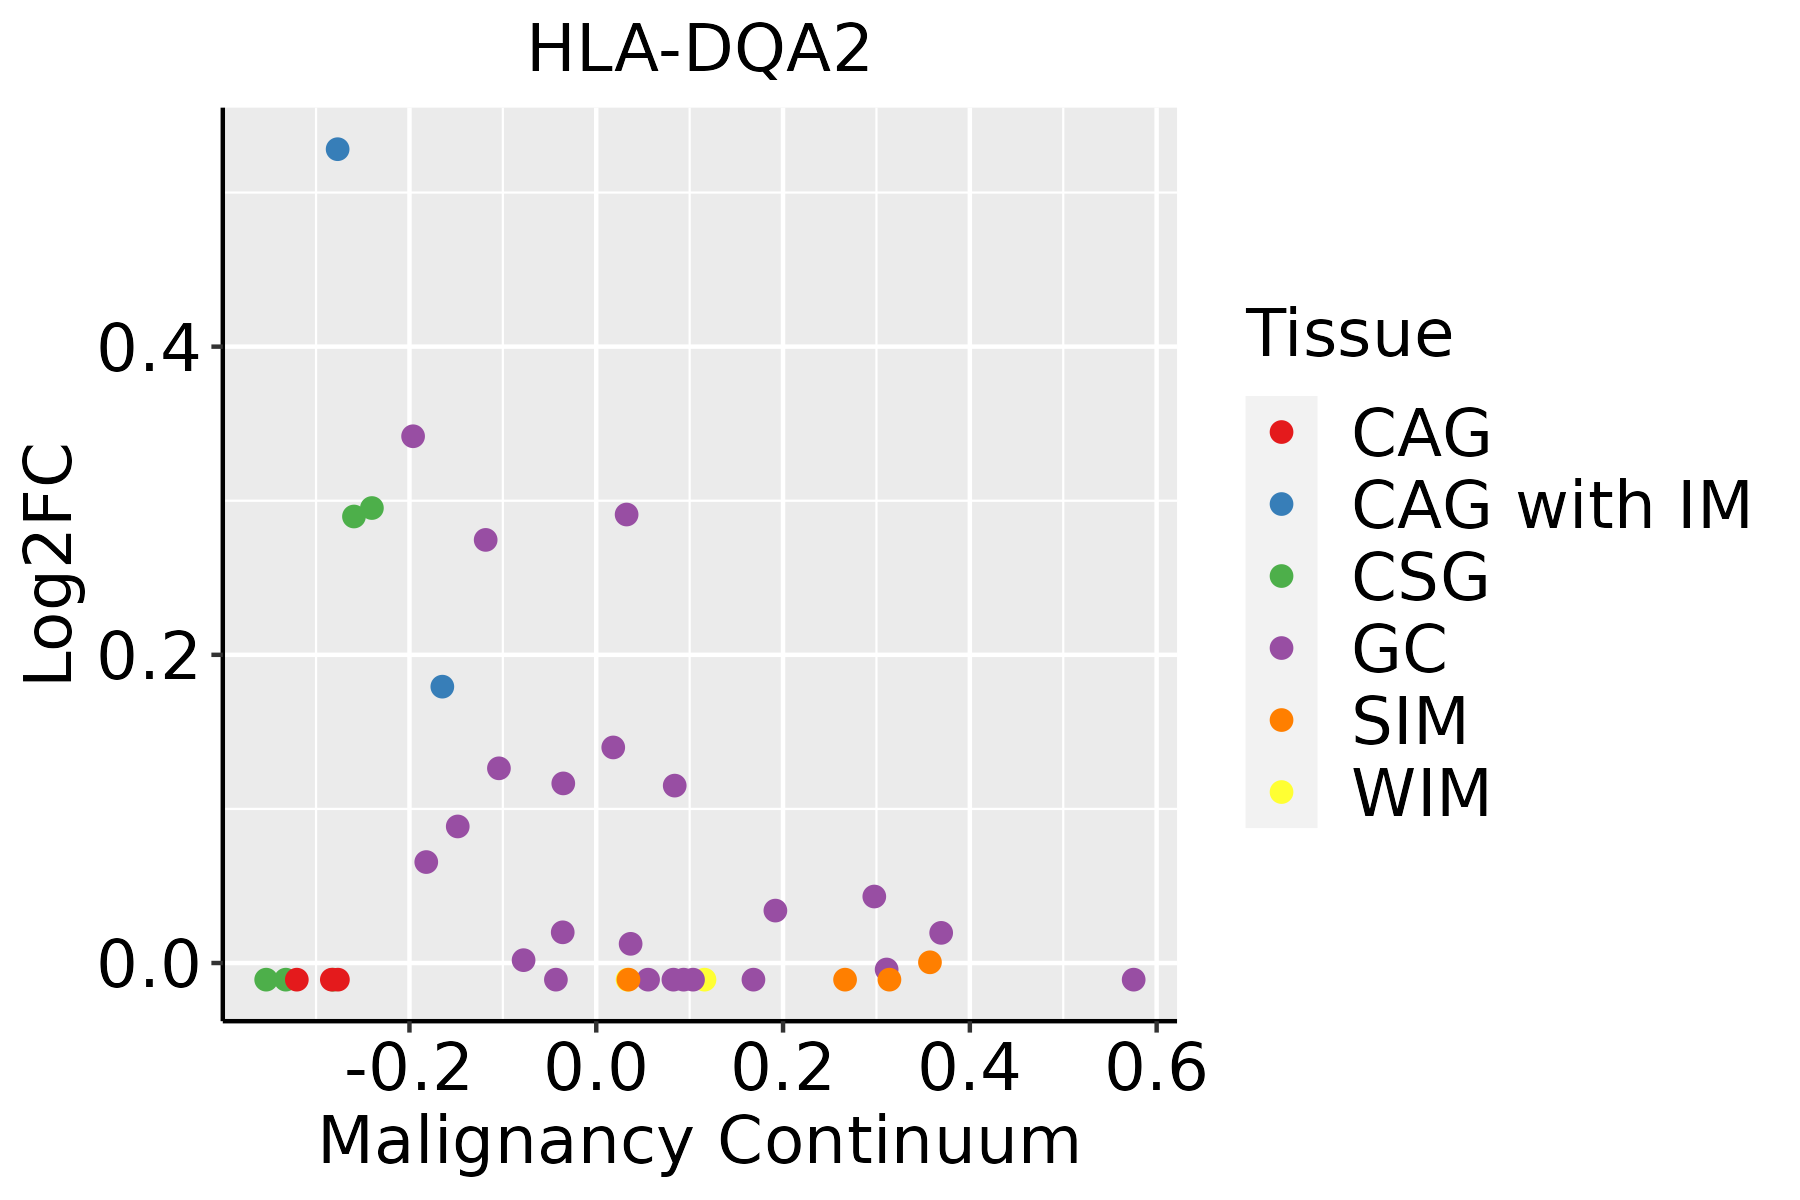 | CAG: Chronic atrophic gastritis |
| CAG with IM: Chronic atrophic gastritis with intestinal metaplasia | ||
| CSG: Chronic superficial gastritis | ||
| GC: Gastric cancer | ||
| SIM: Severe intestinal metaplasia | ||
| WIM: Wild intestinal metaplasia | ||
| Prostate | 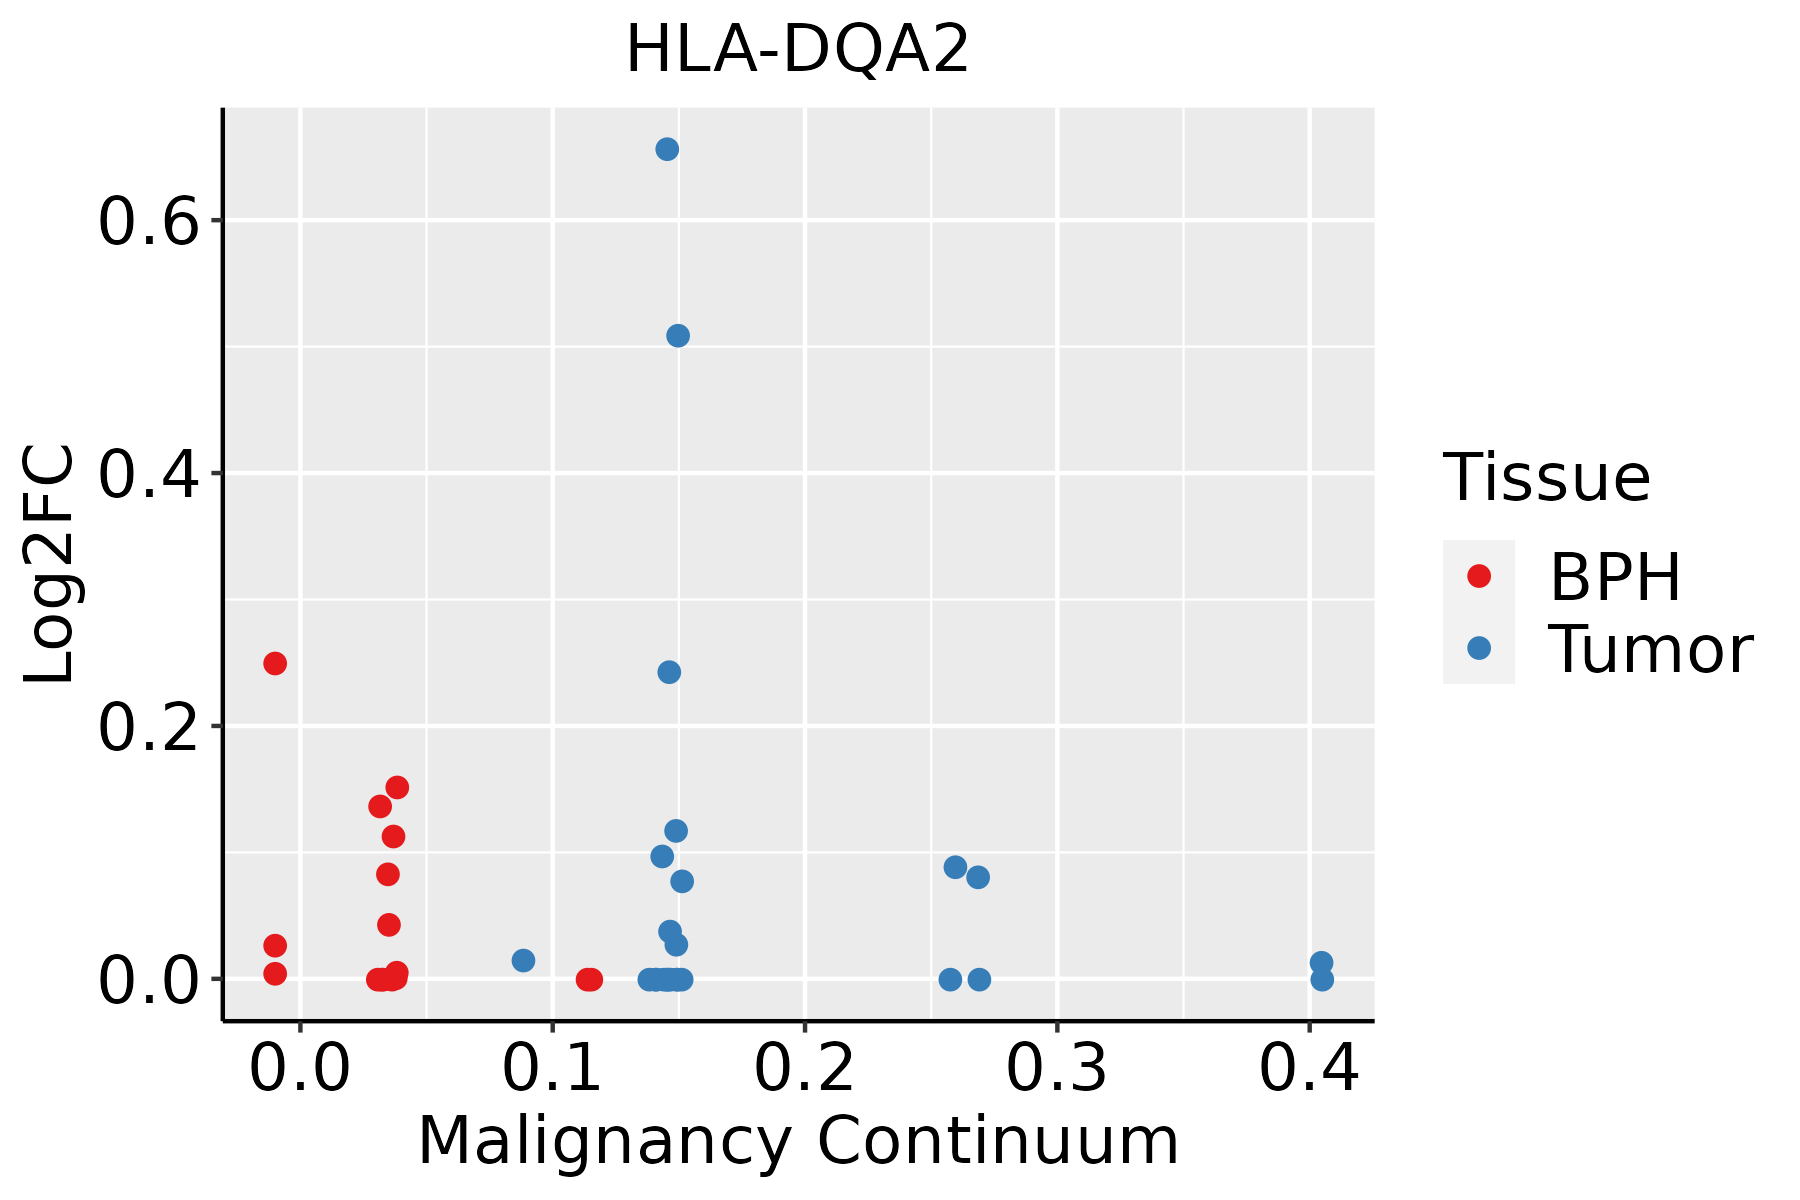 | BPH: Benign Prostatic Hyperplasia |
| Thyroid |  | ATC: Anaplastic thyroid cancer |
| HT: Hashimoto's thyroiditis | ||
| PTC: Papillary thyroid cancer |
| ∗log2FC in expression of this searched gene in stem-like cells from each diseased tissue sample relative to stem-like cells in normal samples in each tissue plotted against the malignancy continuum. Samples are colored based on if they are from different disease stage. |
Top |
Malignant transformation related pathway analysis |
| Find out the enriched GO biological processes and KEGG pathways involved in transition from healthy to precancer to cancer |
| Tissue | Disease Stage | Enriched GO biological Processes |
| Colorectum | AD |  |
| Colorectum | SER |  |
| Colorectum | MSS |  |
| Colorectum | MSI-H |  |
| Colorectum | FAP |  |
| ∗Top 15 enriched GO BP terms are showed in the bar plot of each disease state in each tissue. Each row represents a significant GO biological process which is colored according to the -log10(p.adjust). |
| Page: 1 2 3 4 5 6 7 8 9 |
| GO ID | Tissue | Disease Stage | Description | Gene Ratio | Bg Ratio | pvalue | p.adjust | Count |
| GO:002240710 | Cervix | CC | regulation of cell-cell adhesion | 103/2311 | 448/18723 | 1.78e-10 | 2.87e-08 | 103 |
| GO:004578510 | Cervix | CC | positive regulation of cell adhesion | 101/2311 | 437/18723 | 1.96e-10 | 3.08e-08 | 101 |
| GO:00421108 | Cervix | CC | T cell activation | 107/2311 | 487/18723 | 1.24e-09 | 1.46e-07 | 107 |
| GO:00508638 | Cervix | CC | regulation of T cell activation | 80/2311 | 329/18723 | 1.28e-09 | 1.47e-07 | 80 |
| GO:00071598 | Cervix | CC | leukocyte cell-cell adhesion | 85/2311 | 371/18723 | 8.27e-09 | 7.07e-07 | 85 |
| GO:19030378 | Cervix | CC | regulation of leukocyte cell-cell adhesion | 77/2311 | 336/18723 | 4.08e-08 | 2.54e-06 | 77 |
| GO:000247810 | Cervix | CC | antigen processing and presentation of exogenous peptide antigen | 18/2311 | 38/18723 | 1.20e-07 | 6.06e-06 | 18 |
| GO:004800210 | Cervix | CC | antigen processing and presentation of peptide antigen | 24/2311 | 62/18723 | 1.21e-07 | 6.07e-06 | 24 |
| GO:001988410 | Cervix | CC | antigen processing and presentation of exogenous antigen | 20/2311 | 47/18723 | 2.18e-07 | 9.57e-06 | 20 |
| GO:00023968 | Cervix | CC | MHC protein complex assembly | 12/2311 | 19/18723 | 2.65e-07 | 1.12e-05 | 12 |
| GO:001988210 | Cervix | CC | antigen processing and presentation | 32/2311 | 106/18723 | 8.61e-07 | 3.08e-05 | 32 |
| GO:00025018 | Cervix | CC | peptide antigen assembly with MHC protein complex | 11/2311 | 18/18723 | 1.37e-06 | 4.55e-05 | 11 |
| GO:00025048 | Cervix | CC | antigen processing and presentation of peptide or polysaccharide antigen via MHC class II | 16/2311 | 36/18723 | 1.76e-06 | 5.76e-05 | 16 |
| GO:00023998 | Cervix | CC | MHC class II protein complex assembly | 10/2311 | 16/18723 | 3.18e-06 | 8.77e-05 | 10 |
| GO:00025038 | Cervix | CC | peptide antigen assembly with MHC class II protein complex | 10/2311 | 16/18723 | 3.18e-06 | 8.77e-05 | 10 |
| GO:00198869 | Cervix | CC | antigen processing and presentation of exogenous peptide antigen via MHC class II | 14/2311 | 30/18723 | 3.85e-06 | 1.01e-04 | 14 |
| GO:00024958 | Cervix | CC | antigen processing and presentation of peptide antigen via MHC class II | 15/2311 | 34/18723 | 4.16e-06 | 1.08e-04 | 15 |
| GO:00224099 | Cervix | CC | positive regulation of cell-cell adhesion | 61/2311 | 284/18723 | 9.30e-06 | 2.11e-04 | 61 |
| GO:19030397 | Cervix | CC | positive regulation of leukocyte cell-cell adhesion | 53/2311 | 239/18723 | 1.37e-05 | 2.74e-04 | 53 |
| GO:00508708 | Cervix | CC | positive regulation of T cell activation | 49/2311 | 216/18723 | 1.51e-05 | 2.97e-04 | 49 |
| Page: 1 2 3 4 5 6 7 8 9 10 11 12 13 |
| Pathway ID | Tissue | Disease Stage | Description | Gene Ratio | Bg Ratio | pvalue | p.adjust | qvalue | Count |
| hsa0461220 | Cervix | CC | Antigen processing and presentation | 34/1267 | 78/8465 | 1.06e-09 | 2.14e-08 | 1.26e-08 | 34 |
| hsa0541620 | Cervix | CC | Viral myocarditis | 27/1267 | 60/8465 | 2.43e-08 | 3.57e-07 | 2.11e-07 | 27 |
| hsa0414520 | Cervix | CC | Phagosome | 47/1267 | 152/8465 | 3.95e-07 | 4.26e-06 | 2.52e-06 | 47 |
| hsa0516920 | Cervix | CC | Epstein-Barr virus infection | 57/1267 | 202/8465 | 7.30e-07 | 7.39e-06 | 4.37e-06 | 57 |
| hsa0516620 | Cervix | CC | Human T-cell leukemia virus 1 infection | 61/1267 | 222/8465 | 8.13e-07 | 7.98e-06 | 4.72e-06 | 61 |
| hsa0514514 | Cervix | CC | Toxoplasmosis | 34/1267 | 112/8465 | 2.42e-05 | 1.82e-04 | 1.08e-04 | 34 |
| hsa0494016 | Cervix | CC | Type I diabetes mellitus | 17/1267 | 43/8465 | 7.47e-05 | 5.04e-04 | 2.98e-04 | 17 |
| hsa0533014 | Cervix | CC | Allograft rejection | 15/1267 | 38/8465 | 2.01e-04 | 1.14e-03 | 6.75e-04 | 15 |
| hsa0516414 | Cervix | CC | Influenza A | 43/1267 | 171/8465 | 3.03e-04 | 1.64e-03 | 9.68e-04 | 43 |
| hsa0532314 | Cervix | CC | Rheumatoid arthritis | 27/1267 | 93/8465 | 3.64e-04 | 1.82e-03 | 1.07e-03 | 27 |
| hsa0533212 | Cervix | CC | Graft-versus-host disease | 15/1267 | 42/8465 | 7.12e-04 | 3.25e-03 | 1.92e-03 | 15 |
| hsa05152 | Cervix | CC | Tuberculosis | 42/1267 | 180/8465 | 1.78e-03 | 7.21e-03 | 4.26e-03 | 42 |
| hsa046596 | Cervix | CC | Th17 cell differentiation | 28/1267 | 108/8465 | 1.99e-03 | 7.98e-03 | 4.72e-03 | 28 |
| hsa0514014 | Cervix | CC | Leishmaniasis | 21/1267 | 77/8465 | 3.65e-03 | 1.34e-02 | 7.91e-03 | 21 |
| hsa04658 | Cervix | CC | Th1 and Th2 cell differentiation | 24/1267 | 92/8465 | 3.71e-03 | 1.34e-02 | 7.91e-03 | 24 |
| hsa053107 | Cervix | CC | Asthma | 11/1267 | 31/8465 | 3.82e-03 | 1.36e-02 | 8.03e-03 | 11 |
| hsa045147 | Cervix | CC | Cell adhesion molecules | 36/1267 | 157/8465 | 4.94e-03 | 1.67e-02 | 9.86e-03 | 36 |
| hsa0532012 | Cervix | CC | Autoimmune thyroid disease | 15/1267 | 53/8465 | 9.08e-03 | 2.85e-02 | 1.69e-02 | 15 |
| hsa04612110 | Cervix | CC | Antigen processing and presentation | 34/1267 | 78/8465 | 1.06e-09 | 2.14e-08 | 1.26e-08 | 34 |
| hsa05416110 | Cervix | CC | Viral myocarditis | 27/1267 | 60/8465 | 2.43e-08 | 3.57e-07 | 2.11e-07 | 27 |
| Page: 1 2 3 4 5 6 7 8 9 10 11 12 13 |
Top |
Cell-cell communication analysis |
| Identification of potential cell-cell interactions between two cell types and their ligand-receptor pairs for different disease states |
| Ligand | Receptor | LRpair | Pathway | Tissue | Disease Stage |
| HLA-DQA2 | CD4 | HLA-DQA2_CD4 | MHC-II | Breast | DCIS |
| HLA-DQA2 | CD4 | HLA-DQA2_CD4 | MHC-II | Breast | Healthy |
| HLA-DQA2 | CD4 | HLA-DQA2_CD4 | MHC-II | Breast | IDC |
| HLA-DQA2 | CD4 | HLA-DQA2_CD4 | MHC-II | Cervix | ADJ |
| HLA-DQA2 | CD4 | HLA-DQA2_CD4 | MHC-II | Cervix | CC |
| HLA-DQA2 | CD4 | HLA-DQA2_CD4 | MHC-II | Cervix | Healthy |
| HLA-DQA2 | CD4 | HLA-DQA2_CD4 | MHC-II | Cervix | Precancer |
| HLA-DQA2 | CD4 | HLA-DQA2_CD4 | MHC-II | CRC | AD |
| HLA-DQA2 | CD4 | HLA-DQA2_CD4 | MHC-II | CRC | SER |
| HLA-DQA2 | CD4 | HLA-DQA2_CD4 | MHC-II | Endometrium | AEH |
| HLA-DQA2 | CD4 | HLA-DQA2_CD4 | MHC-II | Endometrium | EEC |
| HLA-DQA2 | CD4 | HLA-DQA2_CD4 | MHC-II | Endometrium | Healthy |
| HLA-DQA2 | CD4 | HLA-DQA2_CD4 | MHC-II | HNSCC | ADJ |
| HLA-DQA2 | CD4 | HLA-DQA2_CD4 | MHC-II | HNSCC | Healthy |
| HLA-DQA2 | CD4 | HLA-DQA2_CD4 | MHC-II | HNSCC | OSCC |
| HLA-DQA2 | CD4 | HLA-DQA2_CD4 | MHC-II | HNSCC | Precancer |
| HLA-DQA2 | CD4 | HLA-DQA2_CD4 | MHC-II | Liver | HCC |
| HLA-DQA2 | CD4 | HLA-DQA2_CD4 | MHC-II | Liver | Healthy |
| HLA-DQA2 | CD4 | HLA-DQA2_CD4 | MHC-II | Liver | Precancer |
| HLA-DQA2 | CD4 | HLA-DQA2_CD4 | MHC-II | Lung | AAH |
| Page: 1 2 |
Top |
Single-cell gene regulatory network inference analysis |
| Find out the significant the regulons (TFs) and the target genes of each regulon across cell types for different disease states |
| TF | Cell Type | Tissue | Disease Stage | Target Gene | RSS | Regulon Activity |
| ∗The dot plots of a searched regulon are shown for all cell subpopulations in each disease state of each tissue based on the regulon specific score inferred using pySCENIC and by calculating the average expression. |
| Page: 1 |
Top |
Somatic mutation of malignant transformation related genes |
| Annotation of somatic variants for genes involved in malignant transformation |
| Hugo Symbol | Variant Class | Variant Classification | dbSNP RS | HGVSc | HGVSp | HGVSp Short | SWISSPROT | BIOTYPE | SIFT | PolyPhen | Tumor Sample Barcode | Tissue | Histology | Sex | Age | Stage | Therapy Types | Drugs | Outcome |
| HLA-DQA2 | SNV | Missense_Mutation | c.37N>A | p.Ala13Thr | p.A13T | P01906 | protein_coding | tolerated(0.88) | benign(0.001) | TCGA-AR-A250-01 | Breast | breast invasive carcinoma | Female | <65 | I/II | Chemotherapy | doxorubicin | SD | |
| HLA-DQA2 | SNV | Missense_Mutation | c.198N>C | p.Glu66Asp | p.E66D | P01906 | protein_coding | deleterious(0) | benign(0.395) | TCGA-B6-A0RU-01 | Breast | breast invasive carcinoma | Female | <65 | I/II | Unknown | Unknown | PD | |
| HLA-DQA2 | insertion | Frame_Shift_Ins | novel | c.490_491insACATATATTCATGTTTGAACAAGGAGTCAAAGTTTAT | p.Leu164HisfsTer17 | p.L164Hfs*17 | P01906 | protein_coding | TCGA-BH-A0HF-01 | Breast | breast invasive carcinoma | Female | >=65 | I/II | Hormone Therapy | arimidex | SD | ||
| HLA-DQA2 | SNV | Missense_Mutation | c.419C>A | p.Pro140His | p.P140H | P01906 | protein_coding | deleterious(0) | probably_damaging(1) | TCGA-AA-3977-01 | Colorectum | colon adenocarcinoma | Male | >=65 | I/II | Unknown | Unknown | SD | |
| HLA-DQA2 | SNV | Missense_Mutation | c.56N>A | p.Ser19Asn | p.S19N | P01906 | protein_coding | tolerated(0.09) | possibly_damaging(0.501) | TCGA-D5-6540-01 | Colorectum | colon adenocarcinoma | Male | >=65 | I/II | Unknown | Unknown | SD | |
| HLA-DQA2 | SNV | Missense_Mutation | c.325A>G | p.Thr109Ala | p.T109A | P01906 | protein_coding | tolerated(0.17) | benign(0.062) | TCGA-G4-6628-01 | Colorectum | colon adenocarcinoma | Male | >=65 | I/II | Unknown | Unknown | SD | |
| HLA-DQA2 | SNV | Missense_Mutation | c.153N>C | p.Glu51Asp | p.E51D | P01906 | protein_coding | tolerated(0.38) | possibly_damaging(0.881) | TCGA-AG-3892-01 | Colorectum | rectum adenocarcinoma | Female | <65 | I/II | Unknown | Unknown | SD | |
| HLA-DQA2 | SNV | Missense_Mutation | novel | c.174N>A | p.Phe58Leu | p.F58L | P01906 | protein_coding | tolerated(0.06) | benign(0.089) | TCGA-AG-A002-01 | Colorectum | rectum adenocarcinoma | Male | <65 | I/II | Unknown | Unknown | SD |
| HLA-DQA2 | SNV | Missense_Mutation | novel | c.19C>A | p.Leu7Met | p.L7M | P01906 | protein_coding | tolerated(0.06) | probably_damaging(0.994) | TCGA-F5-6814-01 | Colorectum | rectum adenocarcinoma | Male | <65 | I/II | Unknown | Unknown | SD |
| HLA-DQA2 | SNV | Missense_Mutation | novel | c.238N>G | p.Phe80Val | p.F80V | P01906 | protein_coding | deleterious(0.03) | probably_damaging(0.996) | TCGA-A5-A1OF-01 | Endometrium | uterine corpus endometrioid carcinoma | Female | <65 | I/II | Unknown | Unknown | SD |
| Page: 1 2 3 |
Top |
Related drugs of malignant transformation related genes |
| Identification of chemicals and drugs interact with genes involved in malignant transfromation |
| (DGIdb 4.0) |
| Entrez ID | Symbol | Category | Interaction Types | Drug Claim Name | Drug Name | PMIDs |
| Page: 1 |

Copyright 2023-Present -The University of Texas Health Science Center at Houston |