| Tissue | Expression Dynamics | Abbreviation |
| Breast | 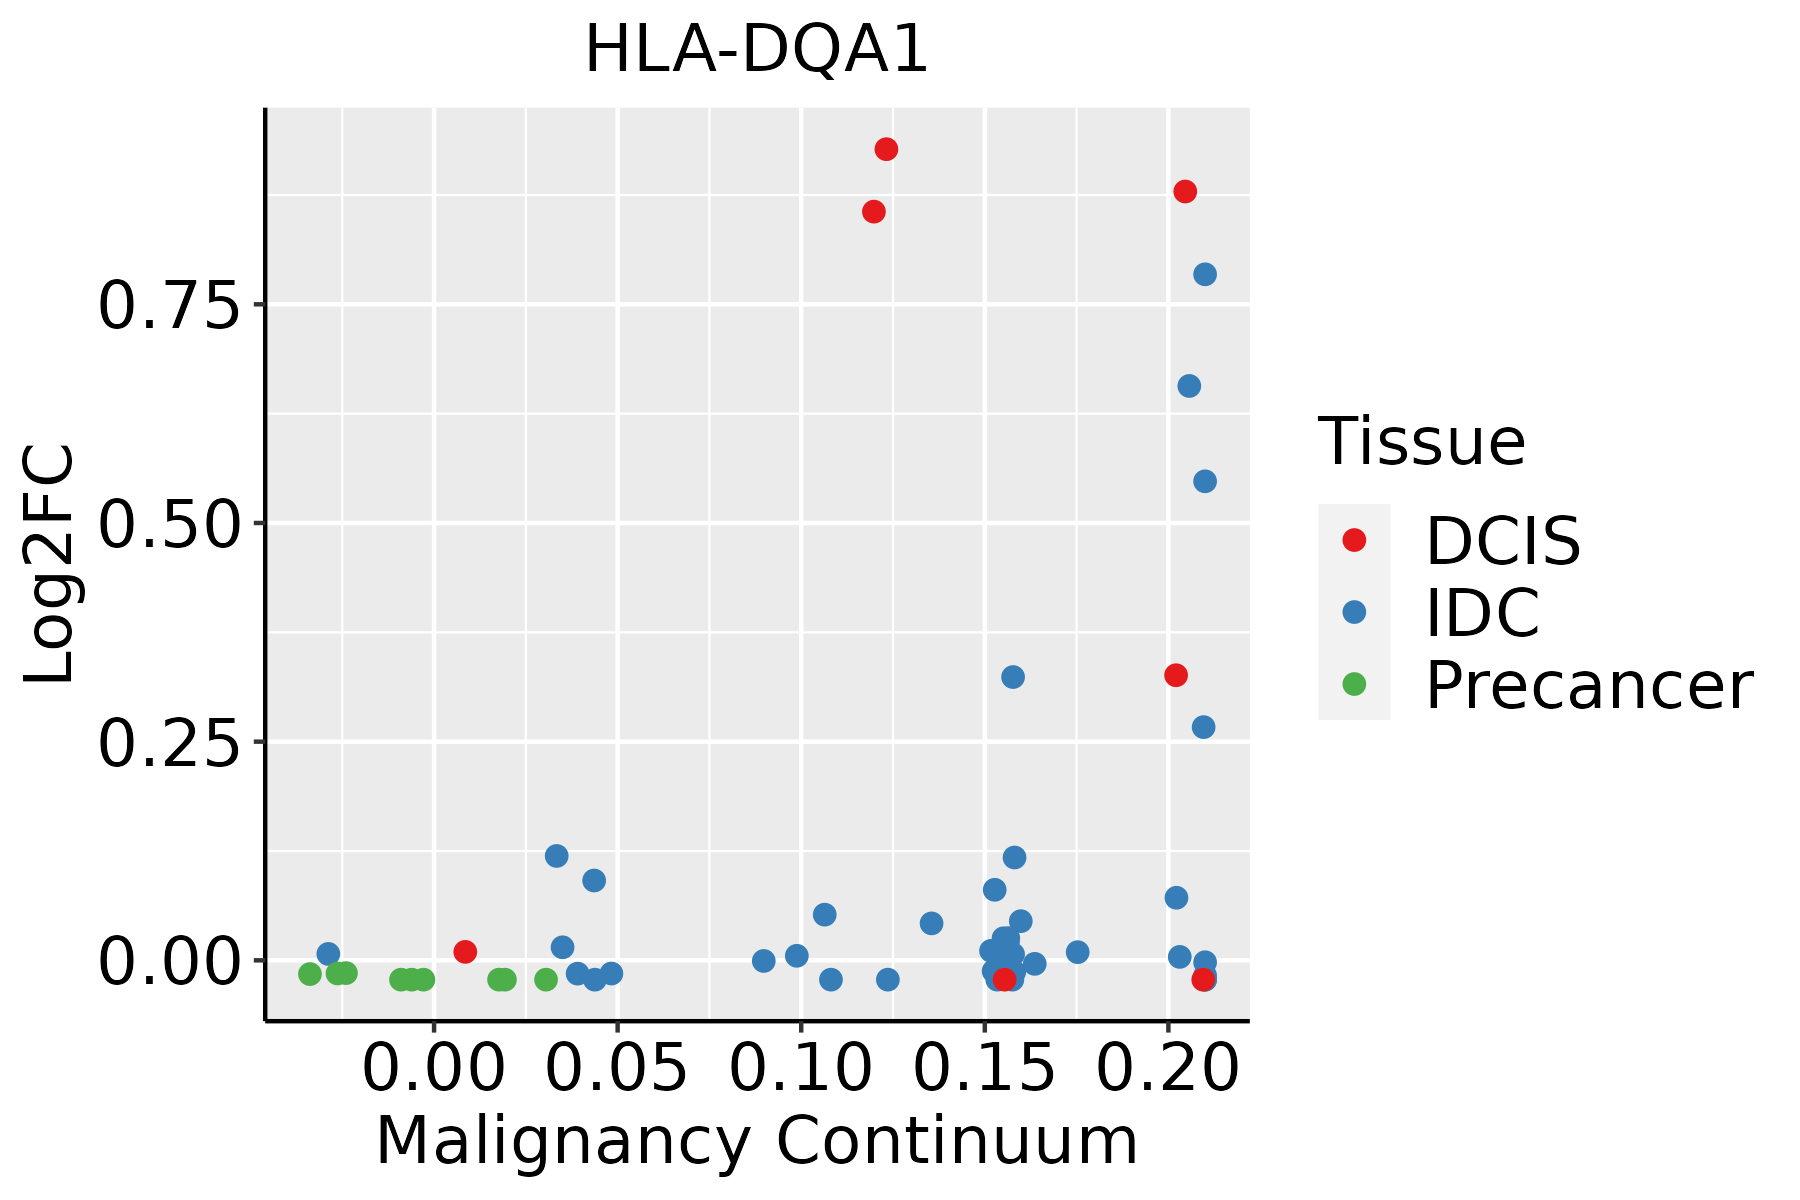 | IDC: Invasive ductal carcinoma |
| DCIS: Ductal carcinoma in situ |
| Precancer(BRCA1-mut): Precancerous lesion from BRCA1 mutation carriers |
| Cervix |  | CC: Cervix cancer |
| HSIL_HPV: HPV-infected high-grade squamous intraepithelial lesions |
| N_HPV: HPV-infected normal cervix |
| Endometrium |  | AEH: Atypical endometrial hyperplasia |
| EEC: Endometrioid Cancer |
| Esophagus | 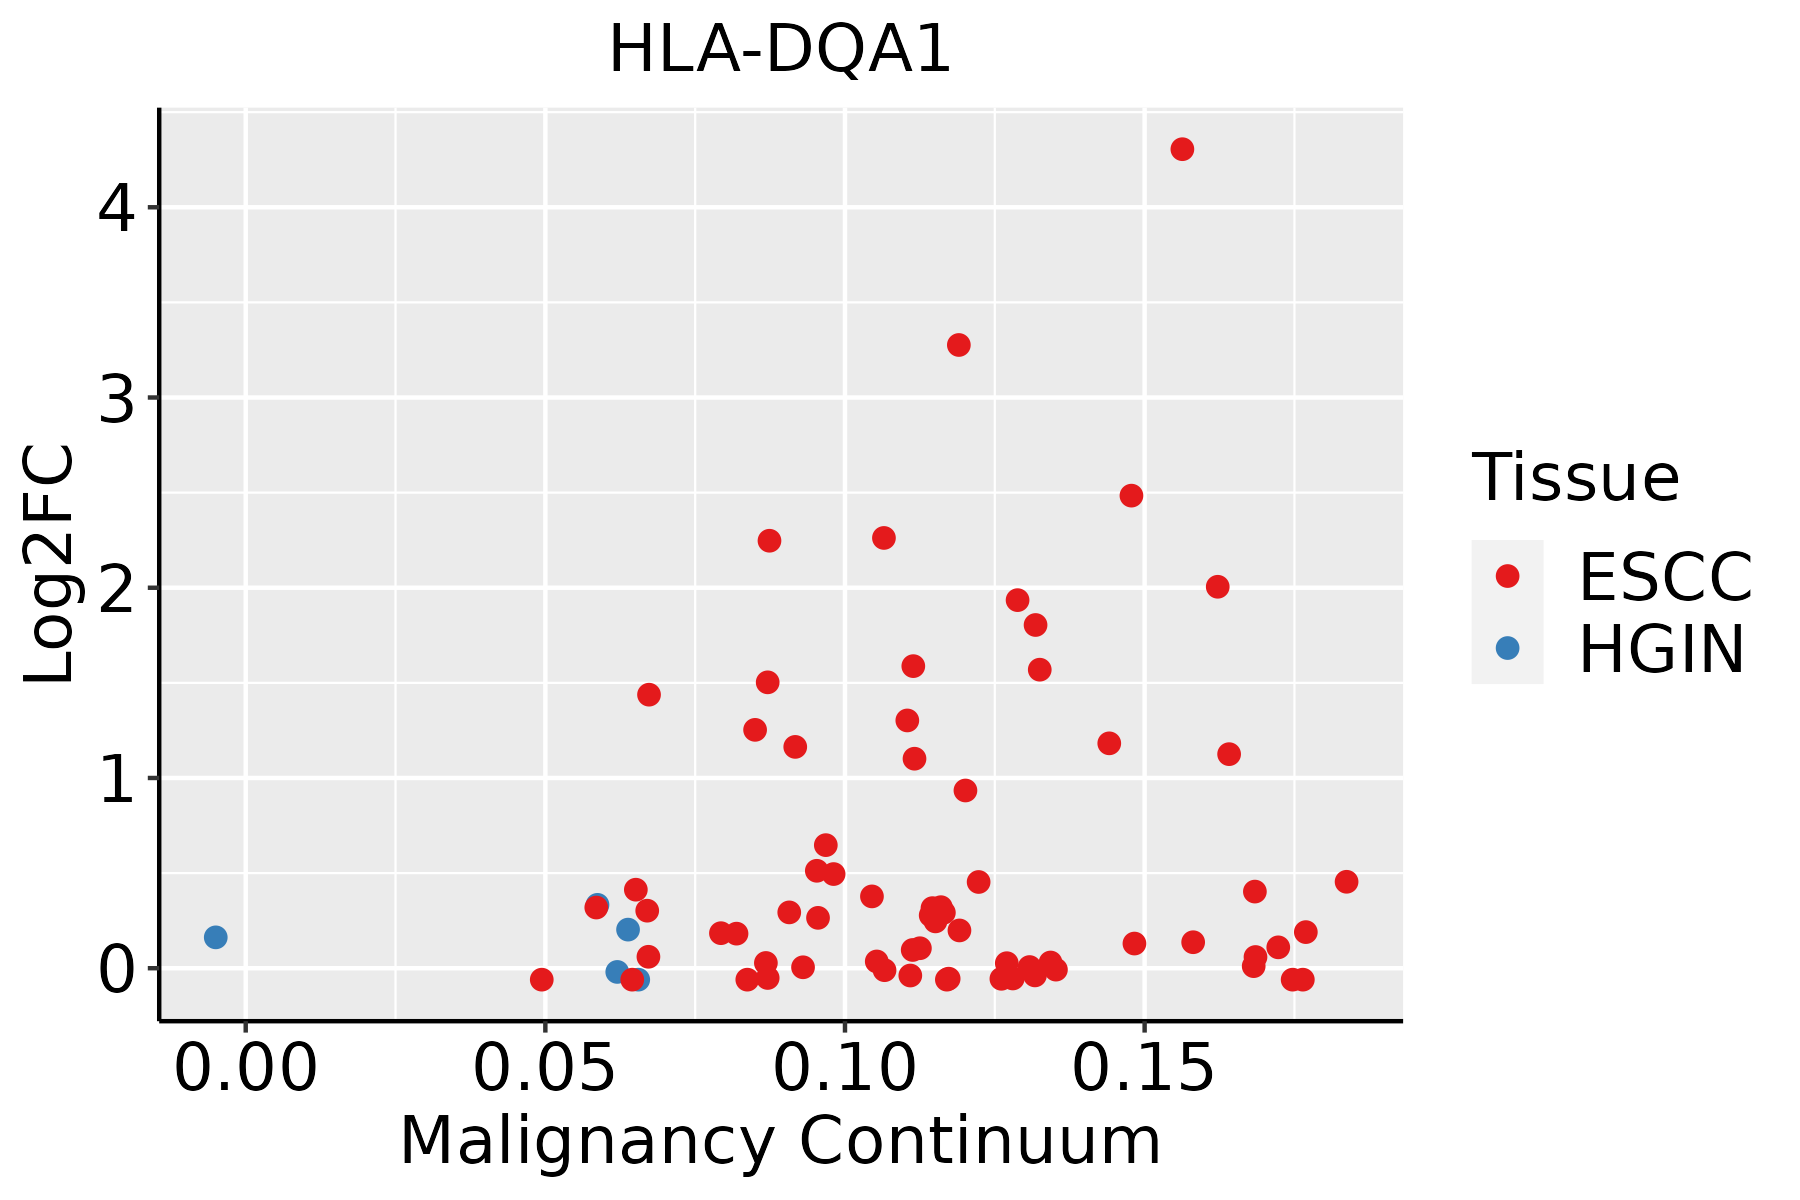 | ESCC: Esophageal squamous cell carcinoma |
| HGIN: High-grade intraepithelial neoplasias |
| LGIN: Low-grade intraepithelial neoplasias |
| GC |  | CAG: Chronic atrophic gastritis |
| CAG with IM: Chronic atrophic gastritis with intestinal metaplasia |
| CSG: Chronic superficial gastritis |
| GC: Gastric cancer |
| SIM: Severe intestinal metaplasia |
| WIM: Wild intestinal metaplasia |
| Liver | 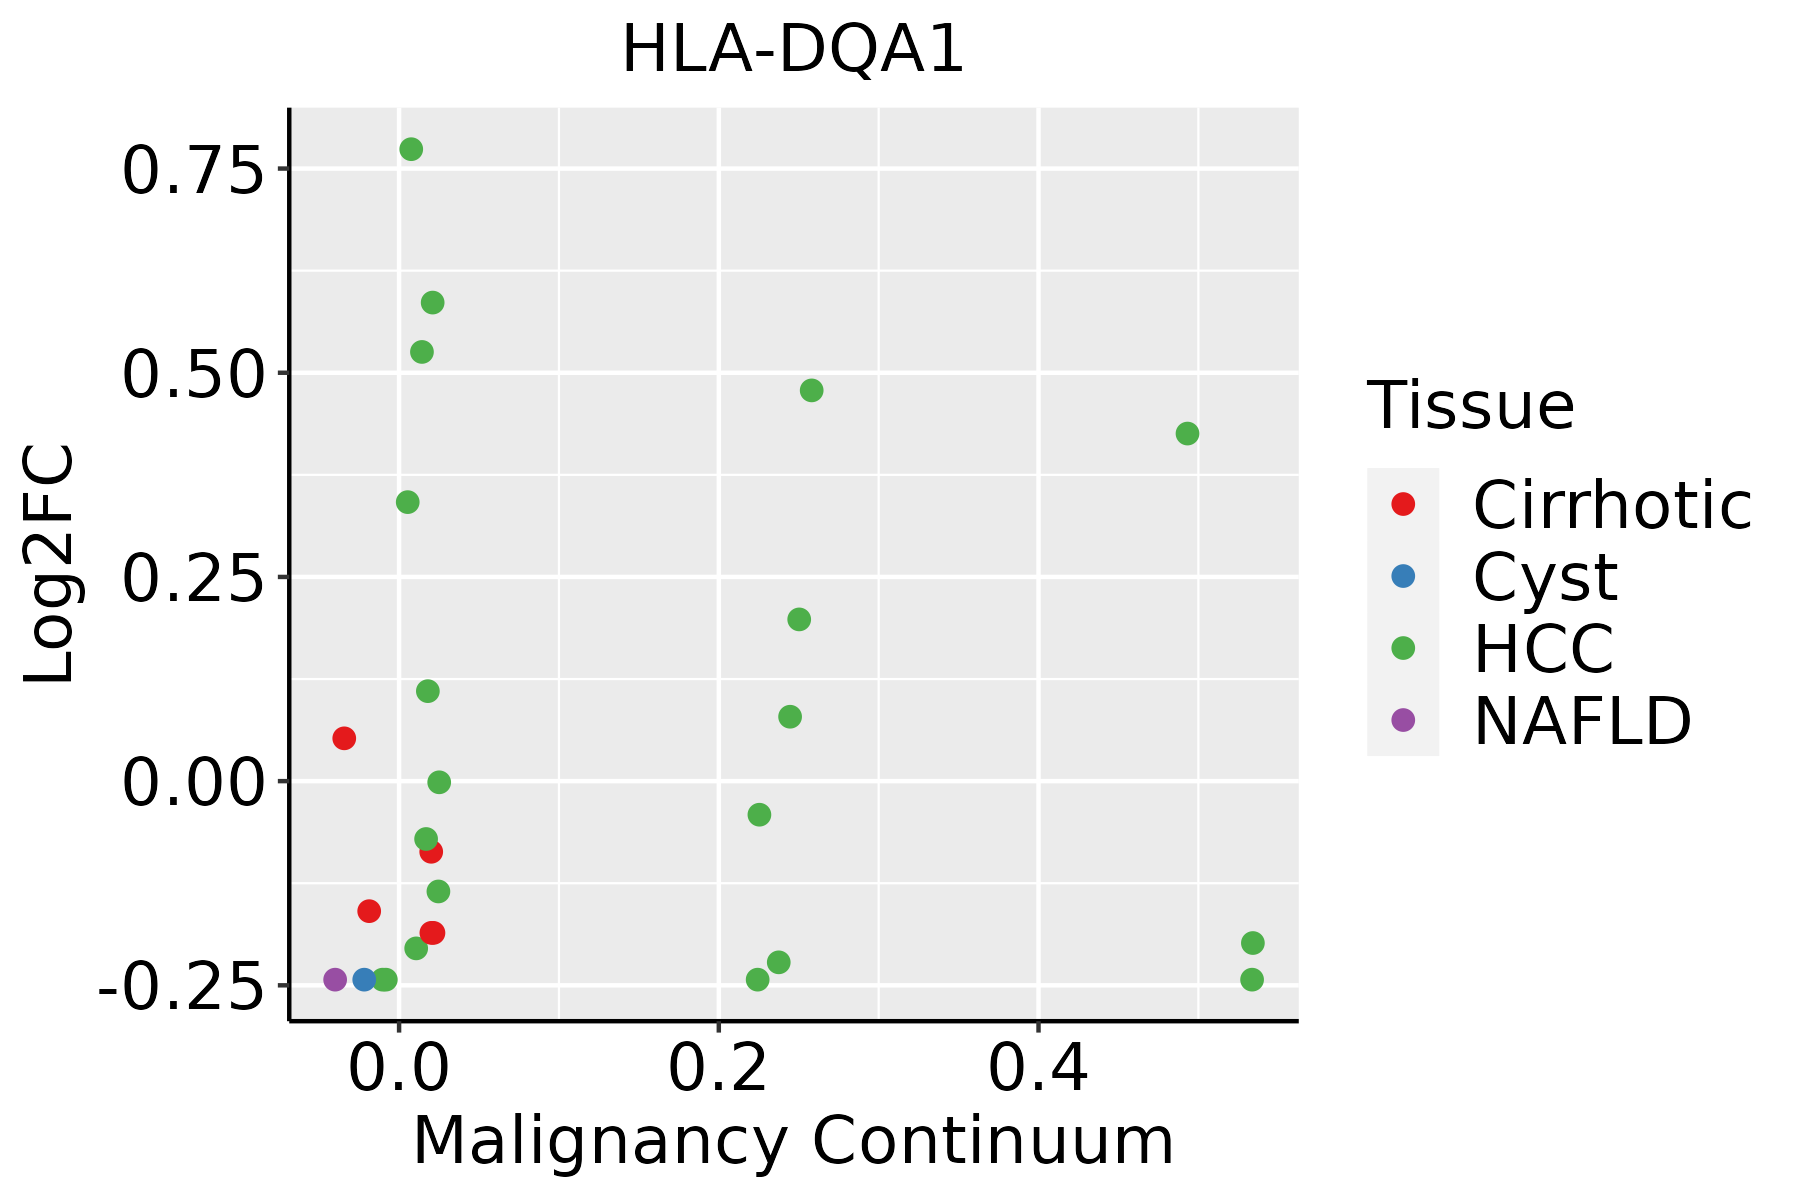 | HCC: Hepatocellular carcinoma |
| NAFLD: Non-alcoholic fatty liver disease |
| Lung |  | AAH: Atypical adenomatous hyperplasia |
| AIS: Adenocarcinoma in situ |
| IAC: Invasive lung adenocarcinoma |
| MIA: Minimally invasive adenocarcinoma |
| Oral Cavity | 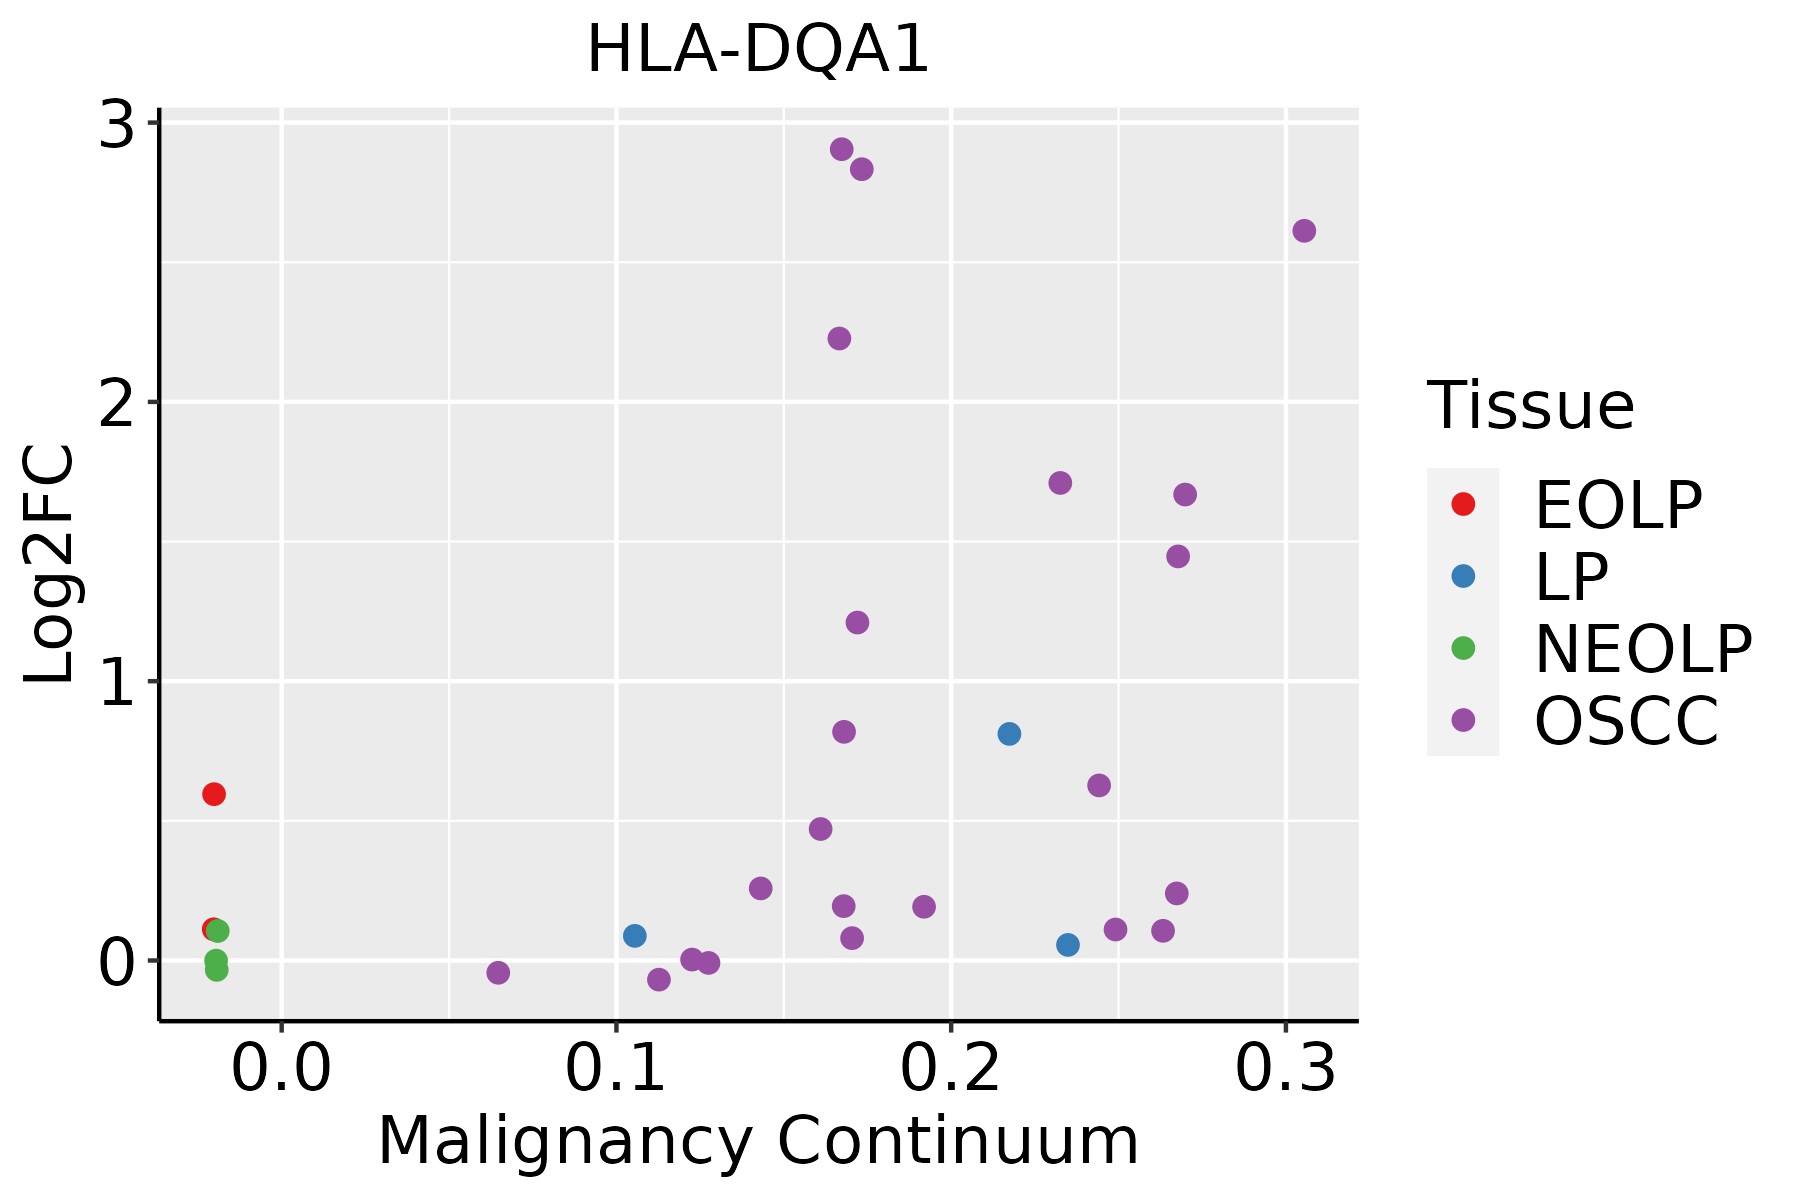 | EOLP: Erosive Oral lichen planus |
| LP: leukoplakia |
| NEOLP: Non-erosive oral lichen planus |
| OSCC: Oral squamous cell carcinoma |
| Skin | 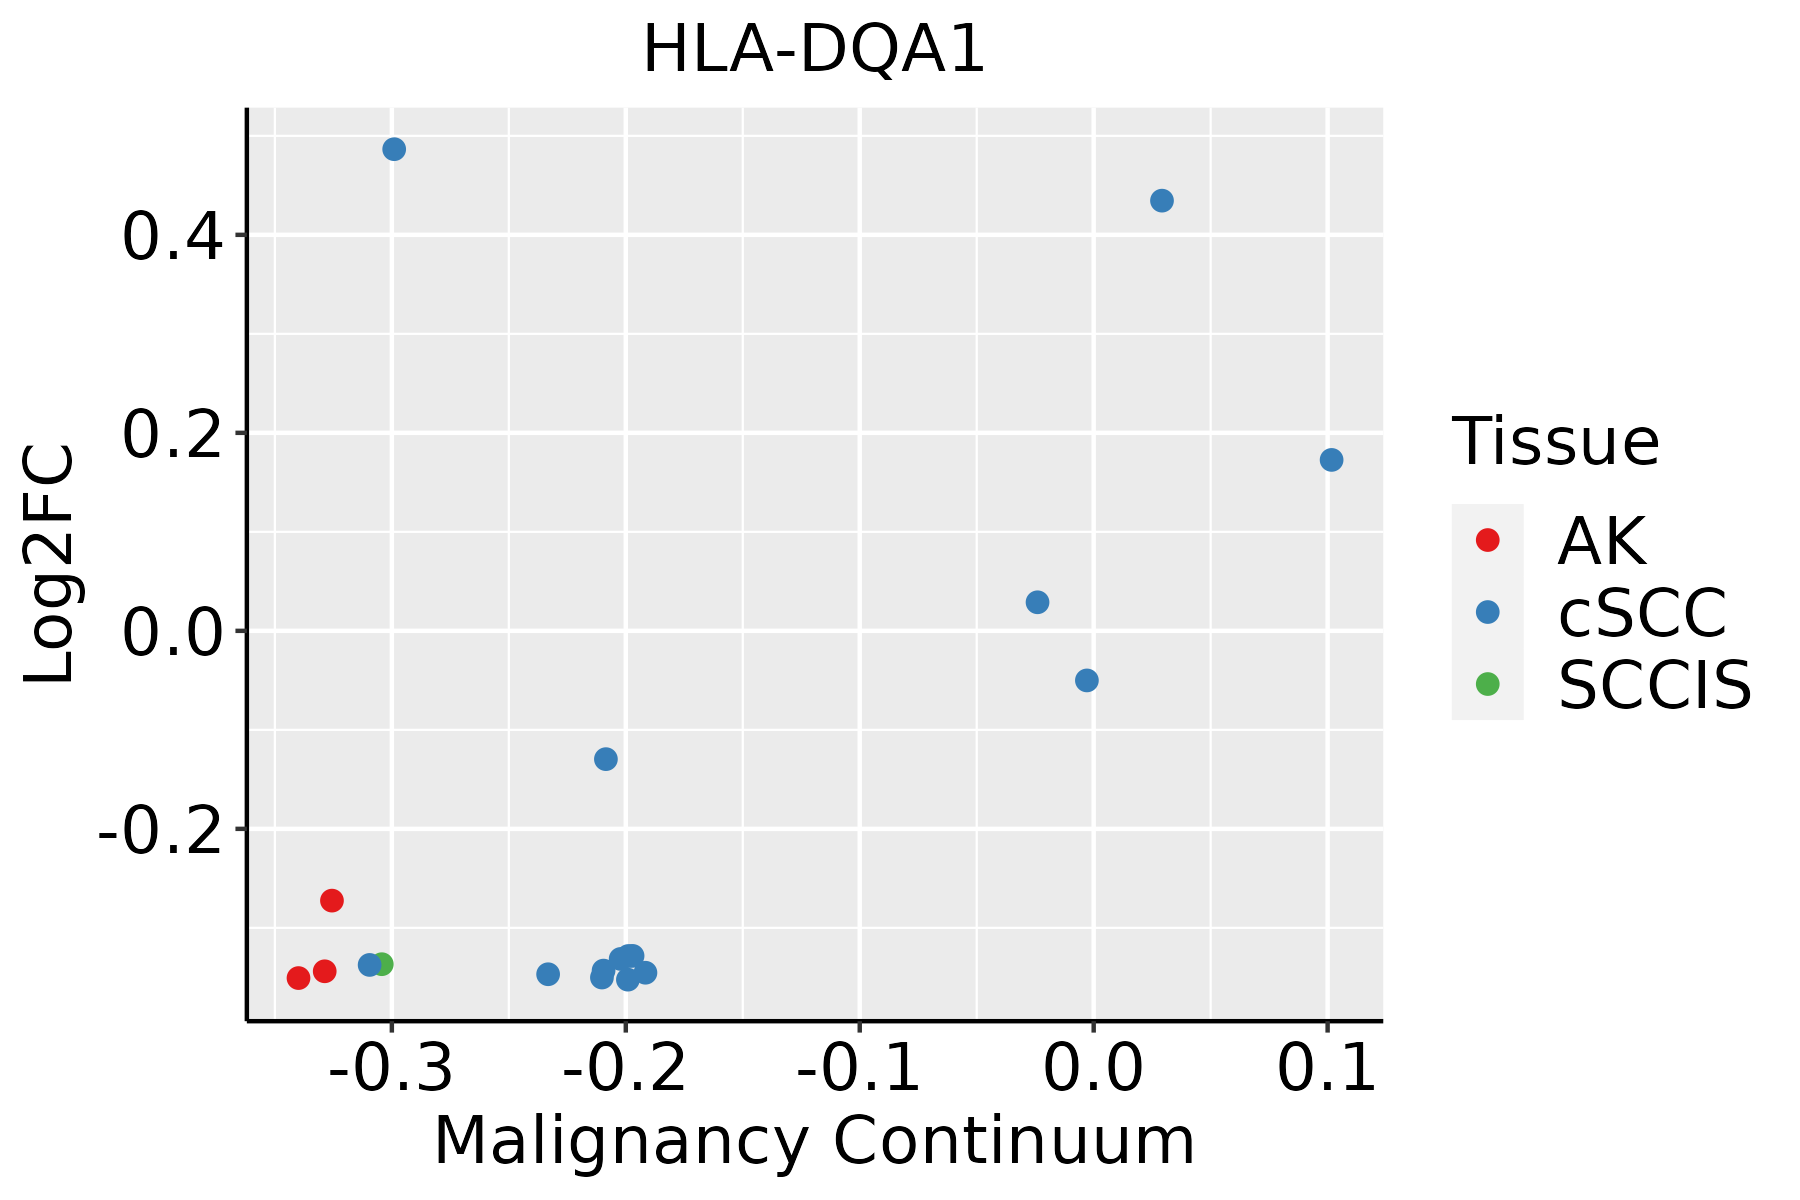 | AK: Actinic keratosis |
| cSCC: Cutaneous squamous cell carcinoma |
| SCCIS:squamous cell carcinoma in situ |
| Thyroid | 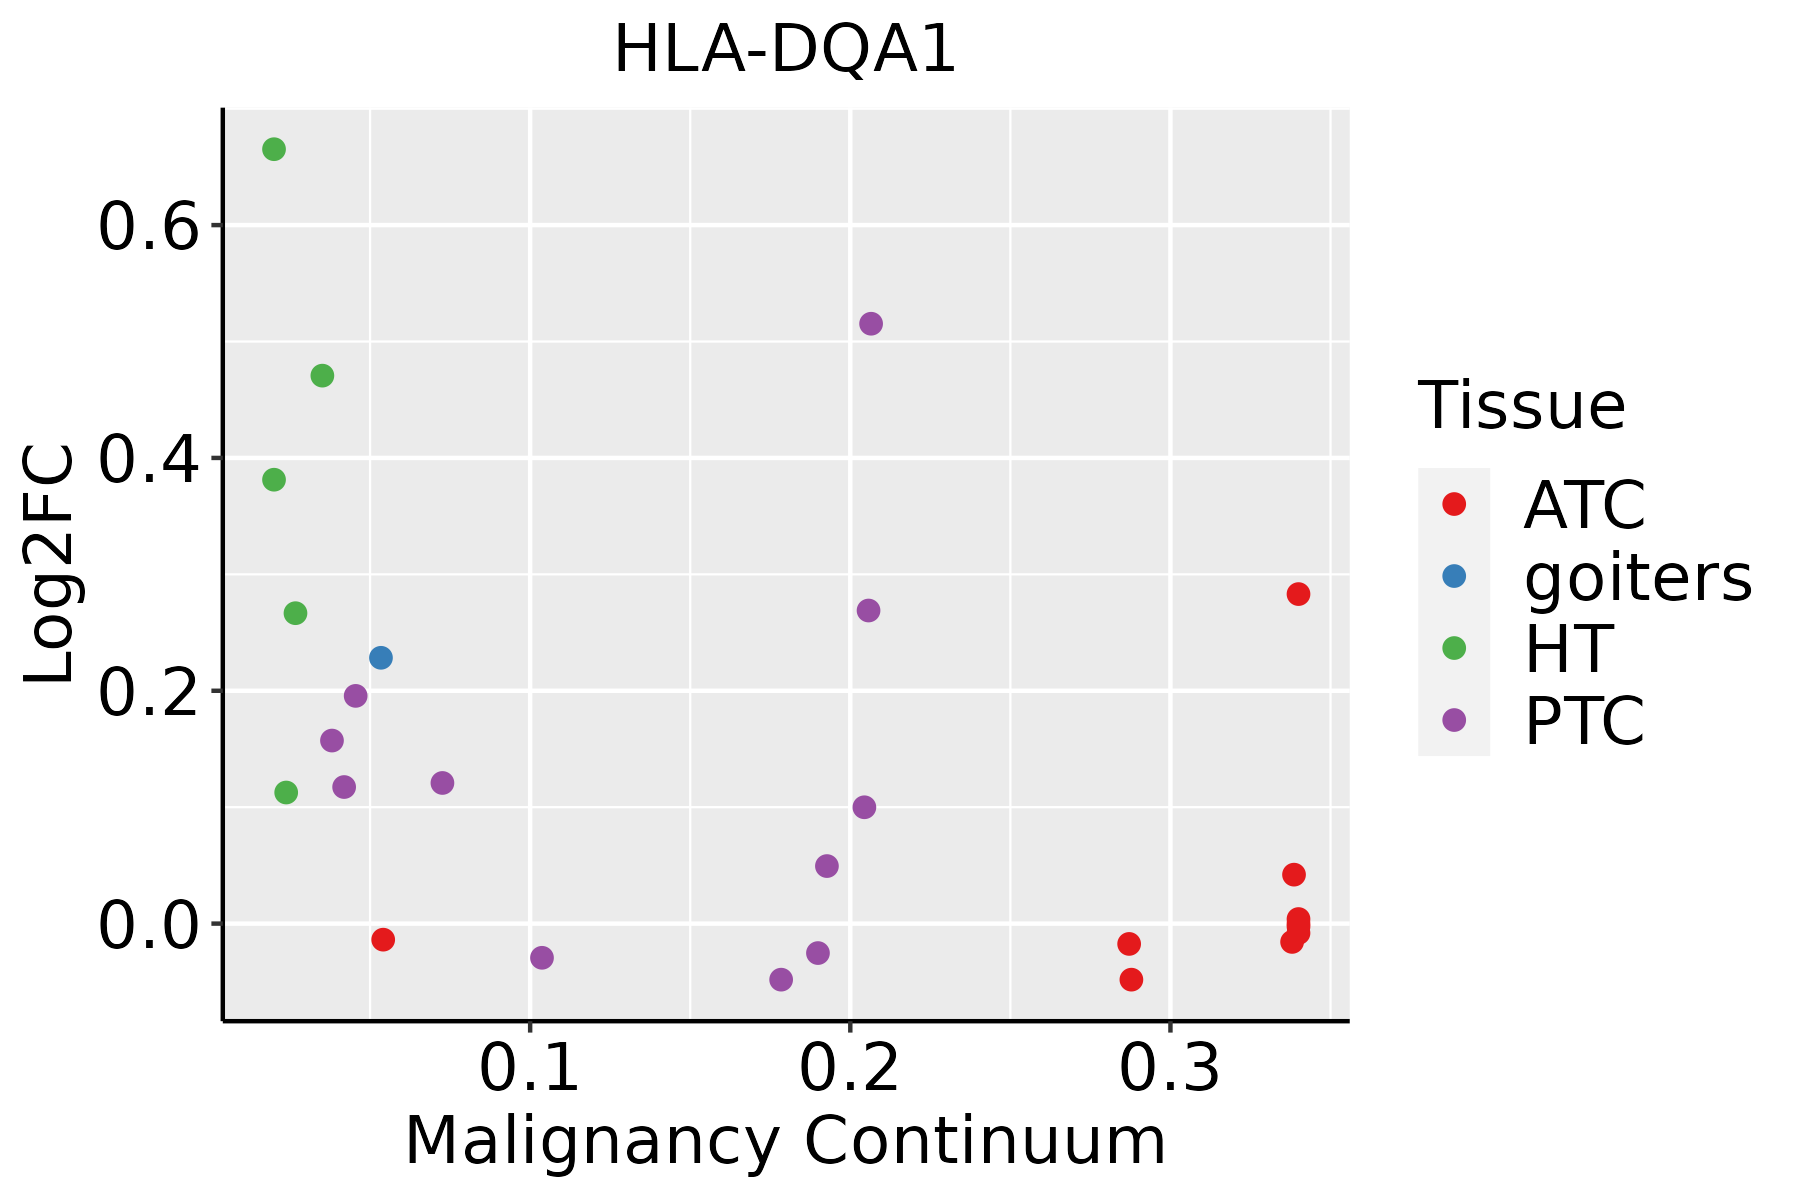 | ATC: Anaplastic thyroid cancer |
| HT: Hashimoto's thyroiditis |
| PTC: Papillary thyroid cancer |
| GO ID | Tissue | Disease Stage | Description | Gene Ratio | Bg Ratio | pvalue | p.adjust | Count |
| GO:004800213 | Breast | IDC | antigen processing and presentation of peptide antigen | 18/1434 | 62/18723 | 5.28e-07 | 2.59e-05 | 18 |
| GO:004578514 | Breast | IDC | positive regulation of cell adhesion | 62/1434 | 437/18723 | 1.70e-06 | 7.16e-05 | 62 |
| GO:000250112 | Breast | IDC | peptide antigen assembly with MHC protein complex | 9/1434 | 18/18723 | 2.28e-06 | 9.05e-05 | 9 |
| GO:000247813 | Breast | IDC | antigen processing and presentation of exogenous peptide antigen | 13/1434 | 38/18723 | 2.60e-06 | 1.01e-04 | 13 |
| GO:000239612 | Breast | IDC | MHC protein complex assembly | 9/1434 | 19/18723 | 4.03e-06 | 1.43e-04 | 9 |
| GO:00023997 | Breast | IDC | MHC class II protein complex assembly | 8/1434 | 16/18723 | 8.56e-06 | 2.47e-04 | 8 |
| GO:00025037 | Breast | IDC | peptide antigen assembly with MHC class II protein complex | 8/1434 | 16/18723 | 8.56e-06 | 2.47e-04 | 8 |
| GO:004211012 | Breast | IDC | T cell activation | 64/1434 | 487/18723 | 1.49e-05 | 3.77e-04 | 64 |
| GO:005086311 | Breast | IDC | regulation of T cell activation | 47/1434 | 329/18723 | 2.49e-05 | 5.91e-04 | 47 |
| GO:00024957 | Breast | IDC | antigen processing and presentation of peptide antigen via MHC class II | 11/1434 | 34/18723 | 2.81e-05 | 6.58e-04 | 11 |
| GO:001988413 | Breast | IDC | antigen processing and presentation of exogenous antigen | 13/1434 | 47/18723 | 3.53e-05 | 8.08e-04 | 13 |
| GO:005087011 | Breast | IDC | positive regulation of T cell activation | 34/1434 | 216/18723 | 4.59e-05 | 1.03e-03 | 34 |
| GO:001988613 | Breast | IDC | antigen processing and presentation of exogenous peptide antigen via MHC class II | 10/1434 | 30/18723 | 4.87e-05 | 1.07e-03 | 10 |
| GO:00025047 | Breast | IDC | antigen processing and presentation of peptide or polysaccharide antigen via MHC class II | 11/1434 | 36/18723 | 5.13e-05 | 1.10e-03 | 11 |
| GO:000715912 | Breast | IDC | leukocyte cell-cell adhesion | 49/1434 | 371/18723 | 1.27e-04 | 2.33e-03 | 49 |
| GO:00198829 | Breast | IDC | antigen processing and presentation | 20/1434 | 106/18723 | 1.41e-04 | 2.49e-03 | 20 |
| GO:190303911 | Breast | IDC | positive regulation of leukocyte cell-cell adhesion | 35/1434 | 239/18723 | 1.58e-04 | 2.73e-03 | 35 |
| GO:190303711 | Breast | IDC | regulation of leukocyte cell-cell adhesion | 45/1434 | 336/18723 | 1.72e-04 | 2.92e-03 | 45 |
| GO:002240712 | Breast | IDC | regulation of cell-cell adhesion | 55/1434 | 448/18723 | 3.43e-04 | 5.07e-03 | 55 |
| GO:002240912 | Breast | IDC | positive regulation of cell-cell adhesion | 38/1434 | 284/18723 | 5.40e-04 | 6.96e-03 | 38 |
| Pathway ID | Tissue | Disease Stage | Description | Gene Ratio | Bg Ratio | pvalue | p.adjust | qvalue | Count |
| hsa0516922 | Breast | IDC | Epstein-Barr virus infection | 45/867 | 202/8465 | 3.16e-07 | 6.05e-06 | 4.52e-06 | 45 |
| hsa0414522 | Breast | IDC | Phagosome | 34/867 | 152/8465 | 8.00e-06 | 9.99e-05 | 7.48e-05 | 34 |
| hsa0516624 | Breast | IDC | Human T-cell leukemia virus 1 infection | 40/867 | 222/8465 | 2.52e-04 | 2.21e-03 | 1.66e-03 | 40 |
| hsa0514012 | Breast | IDC | Leishmaniasis | 16/867 | 77/8465 | 4.35e-03 | 2.57e-02 | 1.92e-02 | 16 |
| hsa0532010 | Breast | IDC | Autoimmune thyroid disease | 12/867 | 53/8465 | 6.29e-03 | 3.30e-02 | 2.47e-02 | 12 |
| hsa0516932 | Breast | IDC | Epstein-Barr virus infection | 45/867 | 202/8465 | 3.16e-07 | 6.05e-06 | 4.52e-06 | 45 |
| hsa0414532 | Breast | IDC | Phagosome | 34/867 | 152/8465 | 8.00e-06 | 9.99e-05 | 7.48e-05 | 34 |
| hsa0516634 | Breast | IDC | Human T-cell leukemia virus 1 infection | 40/867 | 222/8465 | 2.52e-04 | 2.21e-03 | 1.66e-03 | 40 |
| hsa0514013 | Breast | IDC | Leishmaniasis | 16/867 | 77/8465 | 4.35e-03 | 2.57e-02 | 1.92e-02 | 16 |
| hsa0532011 | Breast | IDC | Autoimmune thyroid disease | 12/867 | 53/8465 | 6.29e-03 | 3.30e-02 | 2.47e-02 | 12 |
| hsa0516941 | Breast | DCIS | Epstein-Barr virus infection | 46/846 | 202/8465 | 5.60e-08 | 1.13e-06 | 8.33e-07 | 46 |
| hsa0461242 | Breast | DCIS | Antigen processing and presentation | 25/846 | 78/8465 | 6.75e-08 | 1.28e-06 | 9.45e-07 | 25 |
| hsa0414541 | Breast | DCIS | Phagosome | 35/846 | 152/8465 | 1.67e-06 | 2.45e-05 | 1.81e-05 | 35 |
| hsa0541642 | Breast | DCIS | Viral myocarditis | 19/846 | 60/8465 | 3.12e-06 | 4.20e-05 | 3.09e-05 | 19 |
| hsa0516642 | Breast | DCIS | Human T-cell leukemia virus 1 infection | 41/846 | 222/8465 | 7.03e-05 | 6.88e-04 | 5.07e-04 | 41 |
| hsa0494021 | Breast | DCIS | Type I diabetes mellitus | 13/846 | 43/8465 | 1.91e-04 | 1.72e-03 | 1.27e-03 | 13 |
| hsa0533021 | Breast | DCIS | Allograft rejection | 12/846 | 38/8465 | 2.13e-04 | 1.86e-03 | 1.37e-03 | 12 |
| hsa0532341 | Breast | DCIS | Rheumatoid arthritis | 21/846 | 93/8465 | 2.64e-04 | 2.24e-03 | 1.65e-03 | 21 |
| hsa0533221 | Breast | DCIS | Graft-versus-host disease | 12/846 | 42/8465 | 5.98e-04 | 4.49e-03 | 3.31e-03 | 12 |
| hsa0514021 | Breast | DCIS | Leishmaniasis | 17/846 | 77/8465 | 1.29e-03 | 9.06e-03 | 6.67e-03 | 17 |
| Hugo Symbol | Variant Class | Variant Classification | dbSNP RS | HGVSc | HGVSp | HGVSp Short | SWISSPROT | BIOTYPE | SIFT | PolyPhen | Tumor Sample Barcode | Tissue | Histology | Sex | Age | Stage | Therapy Types | Drugs | Outcome |
| HLA-DQA1 | SNV | Missense_Mutation | | c.151G>C | p.Glu51Gln | p.E51Q | P01909 | protein_coding | deleterious(0.03) | probably_damaging(1) | TCGA-JX-A3Q0-01 | Cervix | cervical & endocervical cancer | Female | <65 | III/IV | Unknown | Unknown | SD |
| HLA-DQA1 | SNV | Missense_Mutation | | c.157G>C | p.Asp53His | p.D53H | P01909 | protein_coding | deleterious(0) | probably_damaging(1) | TCGA-Q1-A73O-01 | Cervix | cervical & endocervical cancer | Female | <65 | I/II | Chemotherapy | cisplatin | CR |
| HLA-DQA1 | SNV | Missense_Mutation | rs368821483 | c.367N>A | p.Val123Met | p.V123M | P01909 | protein_coding | deleterious(0.01) | benign(0.078) | TCGA-EI-6509-01 | Colorectum | rectum adenocarcinoma | Male | <65 | III/IV | Chemotherapy | folfox | PD |
| HLA-DQA1 | SNV | Missense_Mutation | novel | c.352N>C | p.Phe118Leu | p.F118L | P01909 | protein_coding | tolerated(0.4) | benign(0.062) | TCGA-A5-A0G2-01 | Endometrium | uterine corpus endometrioid carcinoma | Female | <65 | III/IV | Unknown | Unknown | SD |
| HLA-DQA1 | SNV | Missense_Mutation | | c.155N>G | p.Phe52Cys | p.F52C | P01909 | protein_coding | deleterious(0) | probably_damaging(0.997) | TCGA-AX-A0J0-01 | Endometrium | uterine corpus endometrioid carcinoma | Female | <65 | I/II | Unknown | Unknown | SD |
| HLA-DQA1 | SNV | Missense_Mutation | | c.621N>T | p.Glu207Asp | p.E207D | P01909 | protein_coding | tolerated(0.1) | benign(0.003) | TCGA-B5-A1MR-01 | Endometrium | uterine corpus endometrioid carcinoma | Female | >=65 | III/IV | Unknown | Unknown | SD |
| HLA-DQA1 | SNV | Missense_Mutation | novel | c.596N>T | p.Pro199Leu | p.P199L | P01909 | protein_coding | deleterious(0.02) | benign(0.426) | TCGA-E6-A1LX-01 | Endometrium | uterine corpus endometrioid carcinoma | Female | <65 | I/II | Unknown | Unknown | SD |
| HLA-DQA1 | SNV | Missense_Mutation | novel | c.505N>A | p.His169Asn | p.H169N | P01909 | protein_coding | tolerated(0.19) | possibly_damaging(0.629) | TCGA-EO-A22X-01 | Endometrium | uterine corpus endometrioid carcinoma | Female | <65 | III/IV | Unspecific | Carboplatin | Complete Response |
| HLA-DQA1 | SNV | Missense_Mutation | novel | c.481N>G | p.Thr161Ala | p.T161A | P01909 | protein_coding | deleterious(0.02) | possibly_damaging(0.471) | TCGA-EO-A3B0-01 | Endometrium | uterine corpus endometrioid carcinoma | Female | <65 | III/IV | Unknown | Unknown | SD |
| HLA-DQA1 | SNV | Missense_Mutation | novel | c.727N>A | p.Leu243Met | p.L243M | P01909 | protein_coding | tolerated(0.49) | probably_damaging(0.979) | TCGA-FI-A2F4-01 | Endometrium | uterine corpus endometrioid carcinoma | Female | <65 | I/II | Unknown | Unknown | SD |


