
|
|||||
|
 | |
| |
| |
| |
| |
| |
|
Gene: HLA-DPB1 |
Gene summary for HLA-DPB1 |
| Gene information | Species | Human | Gene symbol | HLA-DPB1 | Gene ID | 3115 |
| Gene name | major histocompatibility complex, class II, DP beta 1 | |
| Gene Alias | DPB1 | |
| Cytomap | 6p21.32 | |
| Gene Type | protein-coding | GO ID | GO:0001775 | UniProtAcc | I4EC15 |
Top |
Malignant transformation analysis |
| Identification of the aberrant gene expression in precancerous and cancerous lesions by comparing the gene expression of stem-like cells in diseased tissues with normal stem cells |
| Entrez ID | Symbol | Replicates | Species | Organ | Tissue | Adj P-value | Log2FC | Malignancy |
| 3115 | HLA-DPB1 | GSM4909285 | Human | Breast | IDC | 1.88e-03 | -1.23e-01 | 0.21 |
| 3115 | HLA-DPB1 | GSM4909287 | Human | Breast | IDC | 3.33e-09 | 4.91e-01 | 0.2057 |
| 3115 | HLA-DPB1 | GSM4909296 | Human | Breast | IDC | 3.01e-03 | -9.61e-02 | 0.1524 |
| 3115 | HLA-DPB1 | GSM4909311 | Human | Breast | IDC | 4.04e-06 | -2.64e-02 | 0.1534 |
| 3115 | HLA-DPB1 | GSM4909312 | Human | Breast | IDC | 7.44e-03 | -5.02e-02 | 0.1552 |
| 3115 | HLA-DPB1 | GSM4909315 | Human | Breast | IDC | 1.39e-04 | -1.22e-01 | 0.21 |
| 3115 | HLA-DPB1 | GSM4909319 | Human | Breast | IDC | 3.73e-13 | 5.53e-02 | 0.1563 |
| 3115 | HLA-DPB1 | brca1 | Human | Breast | Precancer | 2.08e-03 | -1.28e-01 | -0.0338 |
| 3115 | HLA-DPB1 | M1 | Human | Breast | IDC | 1.02e-11 | 5.89e-01 | 0.1577 |
| 3115 | HLA-DPB1 | NCCBC11 | Human | Breast | DCIS | 3.08e-11 | 1.01e+00 | 0.1232 |
| 3115 | HLA-DPB1 | NCCBC14 | Human | Breast | DCIS | 1.53e-12 | 5.99e-01 | 0.2021 |
| 3115 | HLA-DPB1 | NCCBC3 | Human | Breast | DCIS | 1.40e-57 | 1.35e+00 | 0.1198 |
| 3115 | HLA-DPB1 | NCCBC5 | Human | Breast | DCIS | 1.91e-22 | 8.62e-01 | 0.2046 |
| 3115 | HLA-DPB1 | P2 | Human | Breast | IDC | 7.49e-19 | 8.22e-01 | 0.21 |
| 3115 | HLA-DPB1 | DCIS2 | Human | Breast | DCIS | 5.72e-24 | 1.17e-01 | 0.0085 |
| 3115 | HLA-DPB1 | CA_HPV_1 | Human | Cervix | CC | 1.26e-07 | 6.17e-01 | 0.0264 |
| 3115 | HLA-DPB1 | HSIL_HPV_1 | Human | Cervix | HSIL_HPV | 2.21e-02 | 2.35e-01 | 0.0116 |
| 3115 | HLA-DPB1 | N_HPV_2 | Human | Cervix | N_HPV | 7.42e-04 | -3.17e-02 | -0.0131 |
| 3115 | HLA-DPB1 | CCI_1 | Human | Cervix | CC | 3.81e-12 | -1.06e+00 | 0.528 |
| 3115 | HLA-DPB1 | CCI_2 | Human | Cervix | CC | 1.53e-02 | -7.81e-01 | 0.5249 |
| Page: 1 2 3 4 5 6 7 8 9 10 |
| Tissue | Expression Dynamics | Abbreviation |
| Breast |  | IDC: Invasive ductal carcinoma |
| DCIS: Ductal carcinoma in situ | ||
| Precancer(BRCA1-mut): Precancerous lesion from BRCA1 mutation carriers | ||
| Cervix | 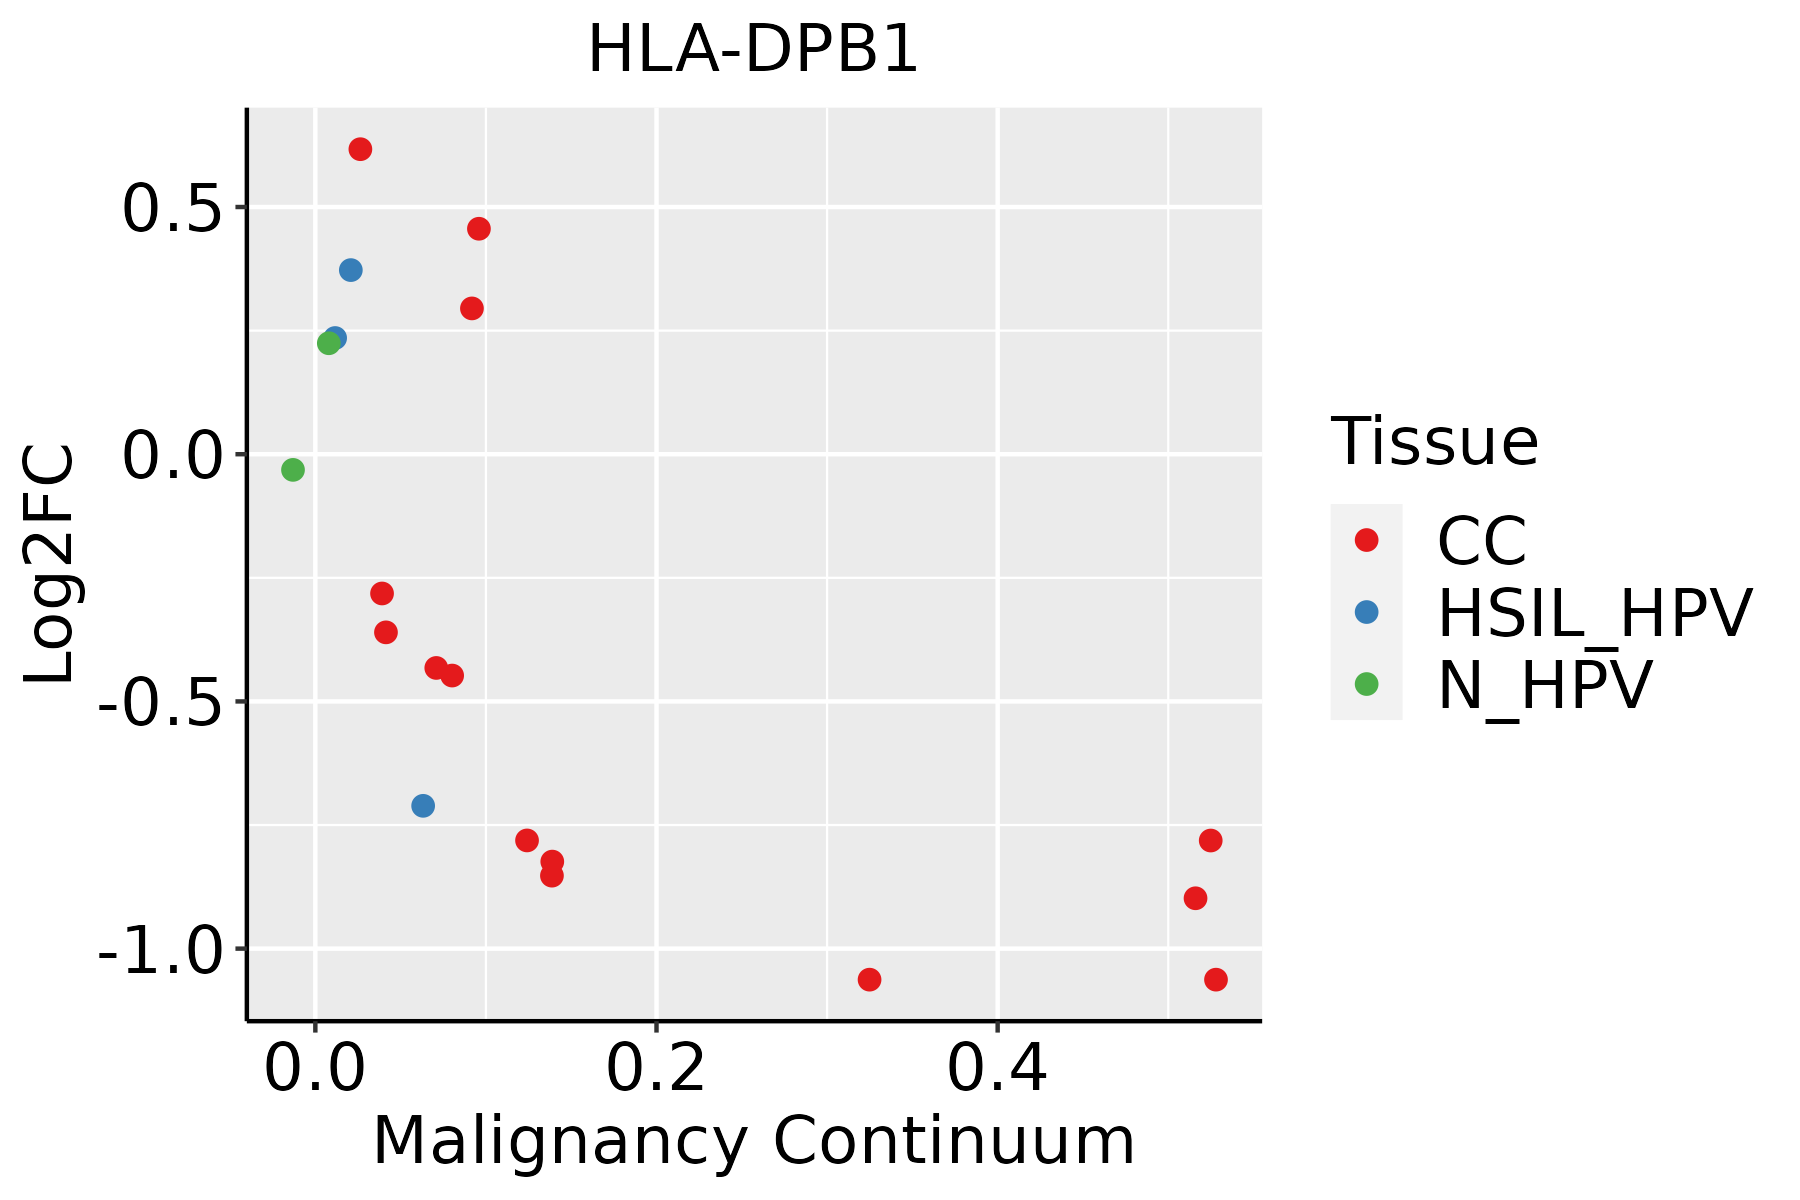 | CC: Cervix cancer |
| HSIL_HPV: HPV-infected high-grade squamous intraepithelial lesions | ||
| N_HPV: HPV-infected normal cervix | ||
| Endometrium | 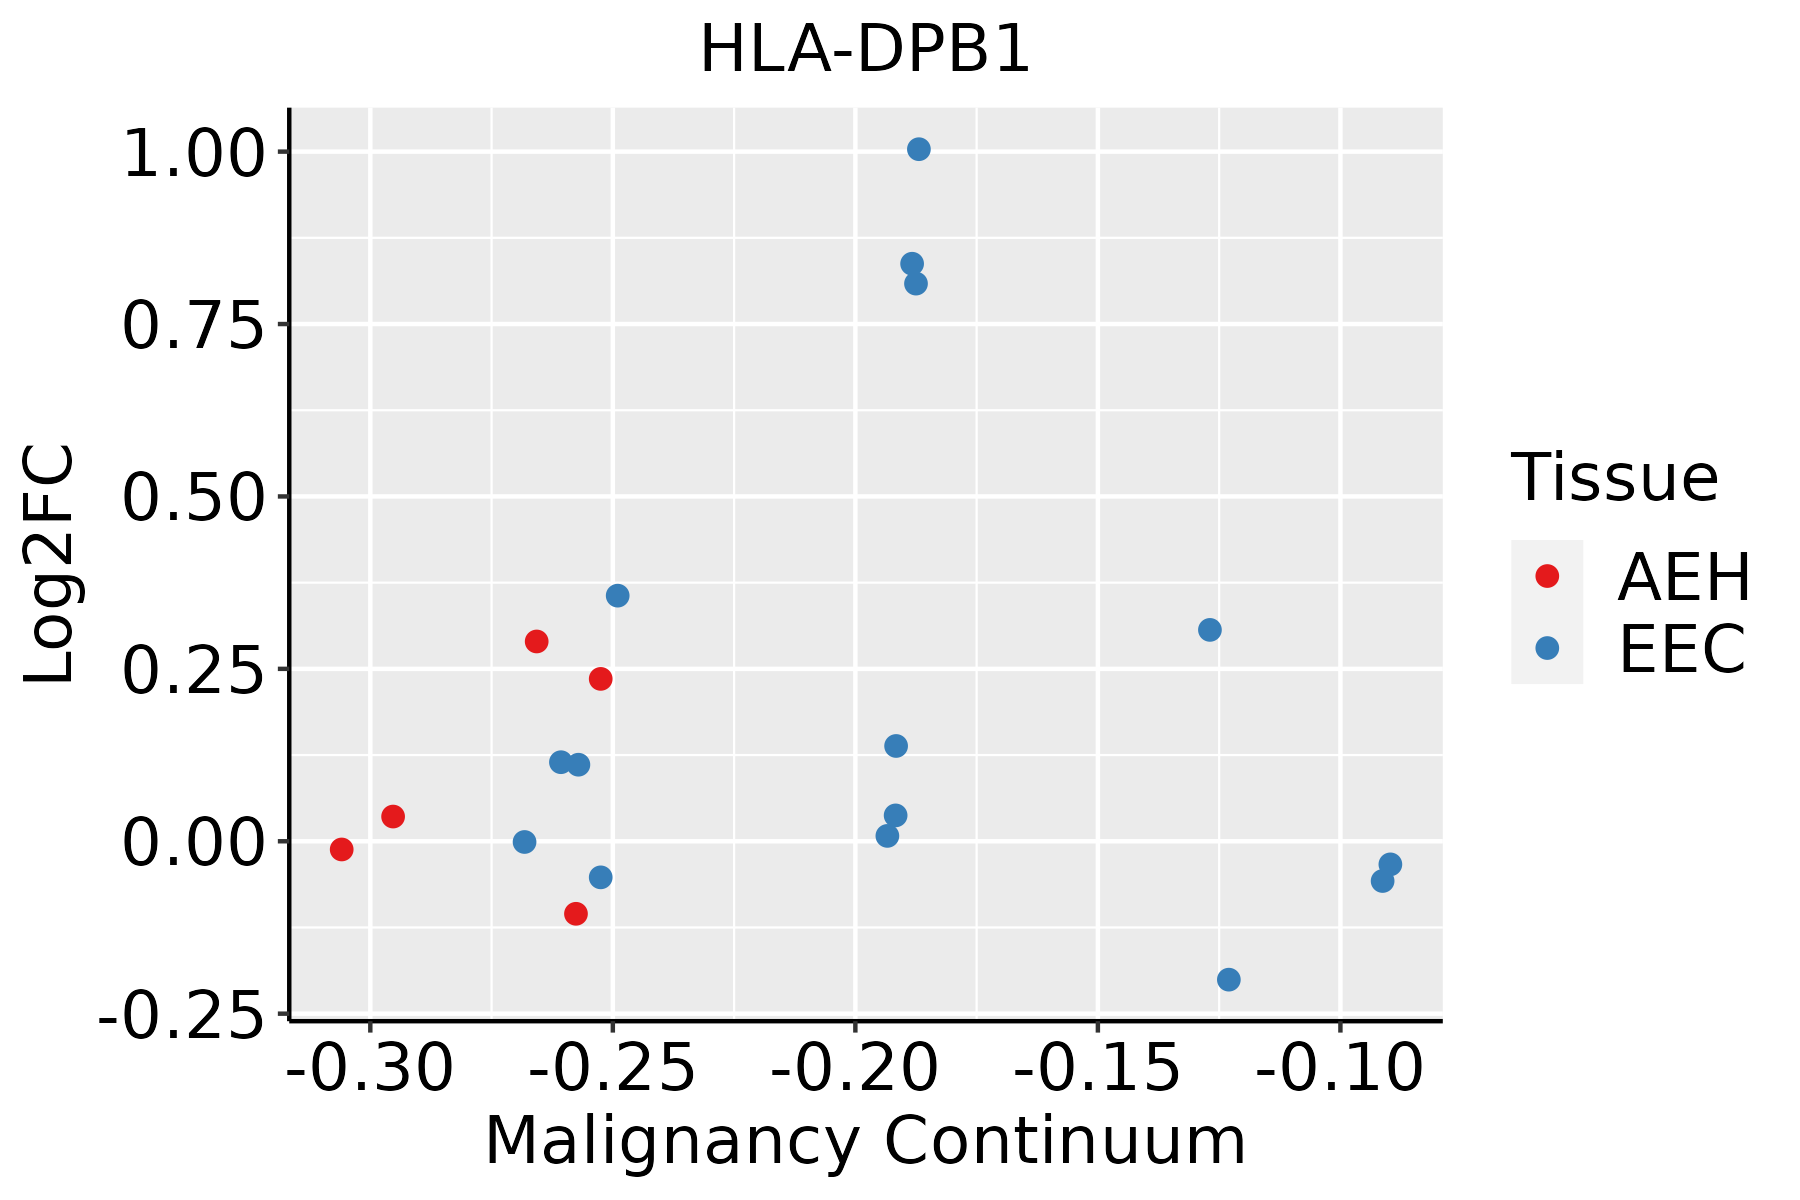 | AEH: Atypical endometrial hyperplasia |
| EEC: Endometrioid Cancer | ||
| Esophagus | 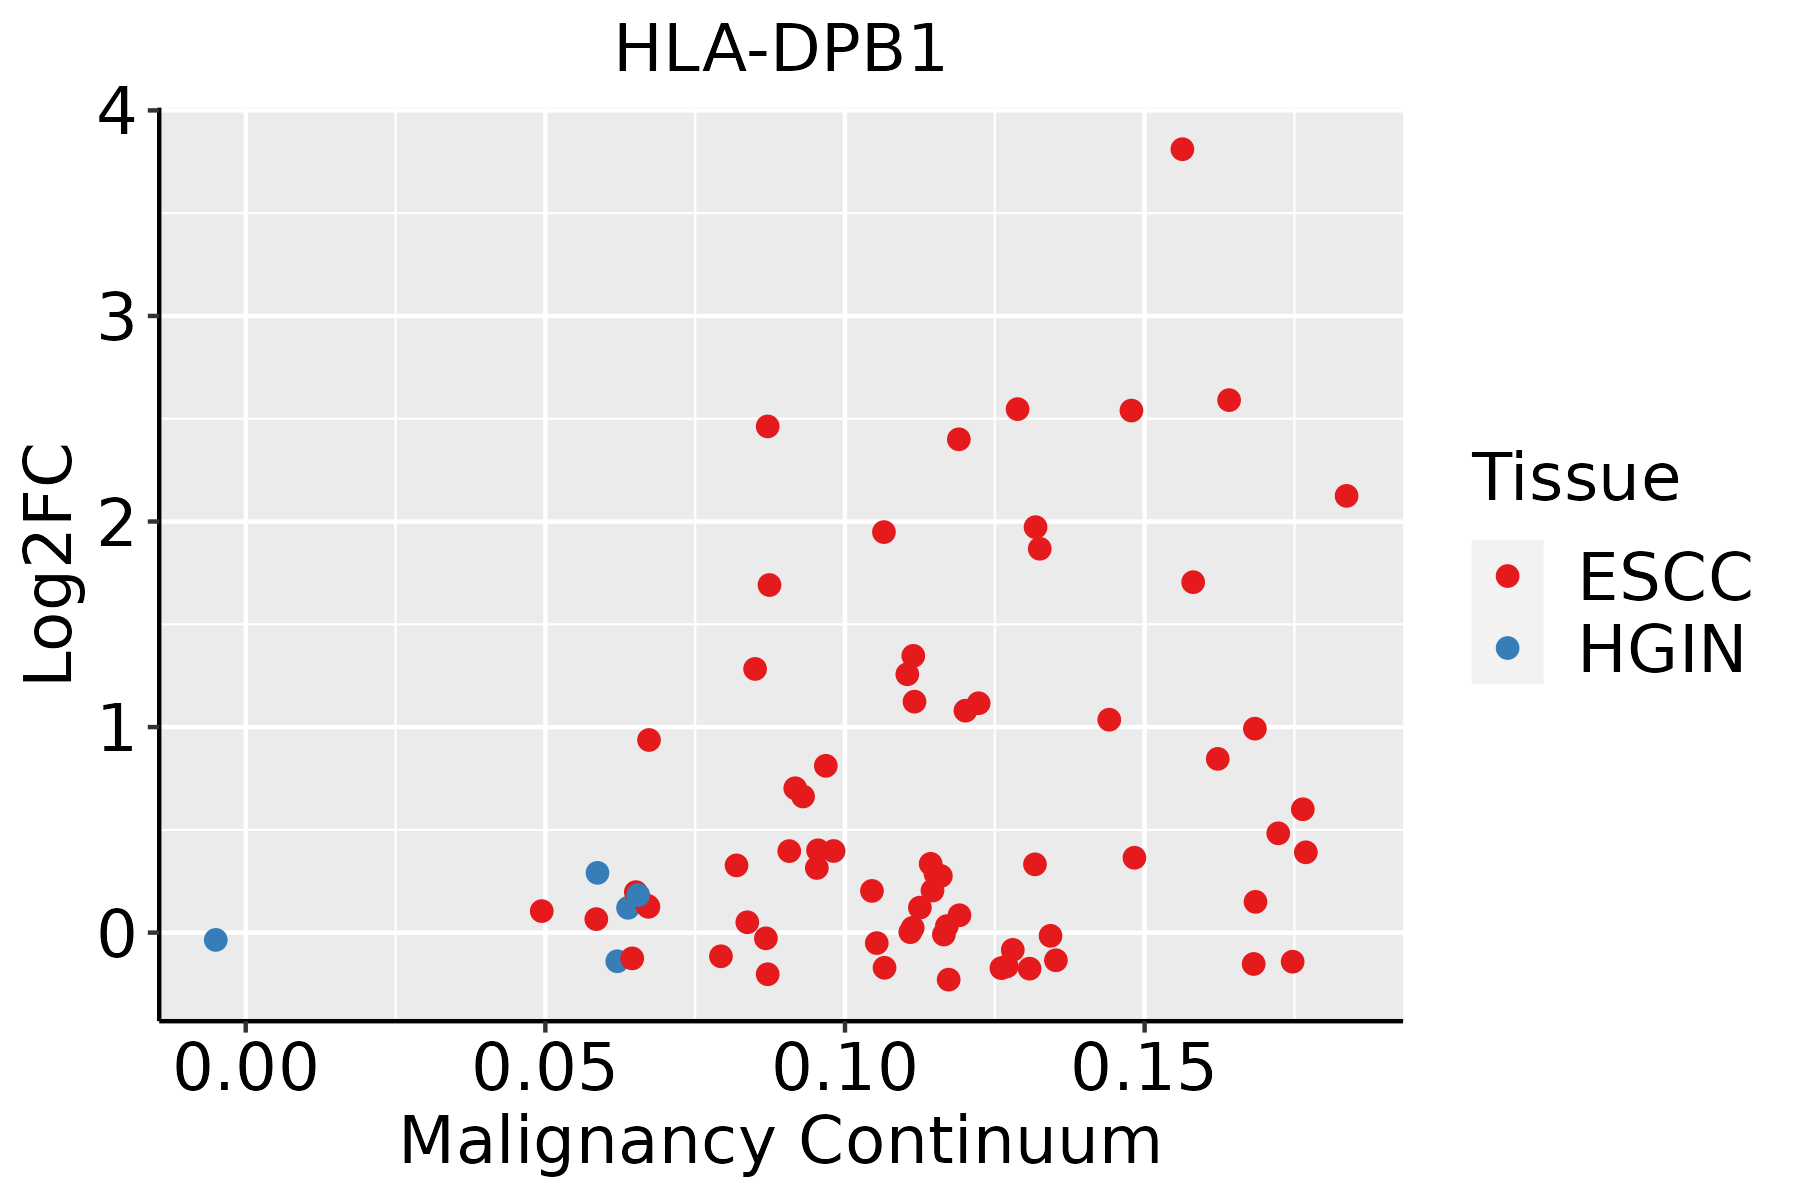 | ESCC: Esophageal squamous cell carcinoma |
| HGIN: High-grade intraepithelial neoplasias | ||
| LGIN: Low-grade intraepithelial neoplasias | ||
| GC | 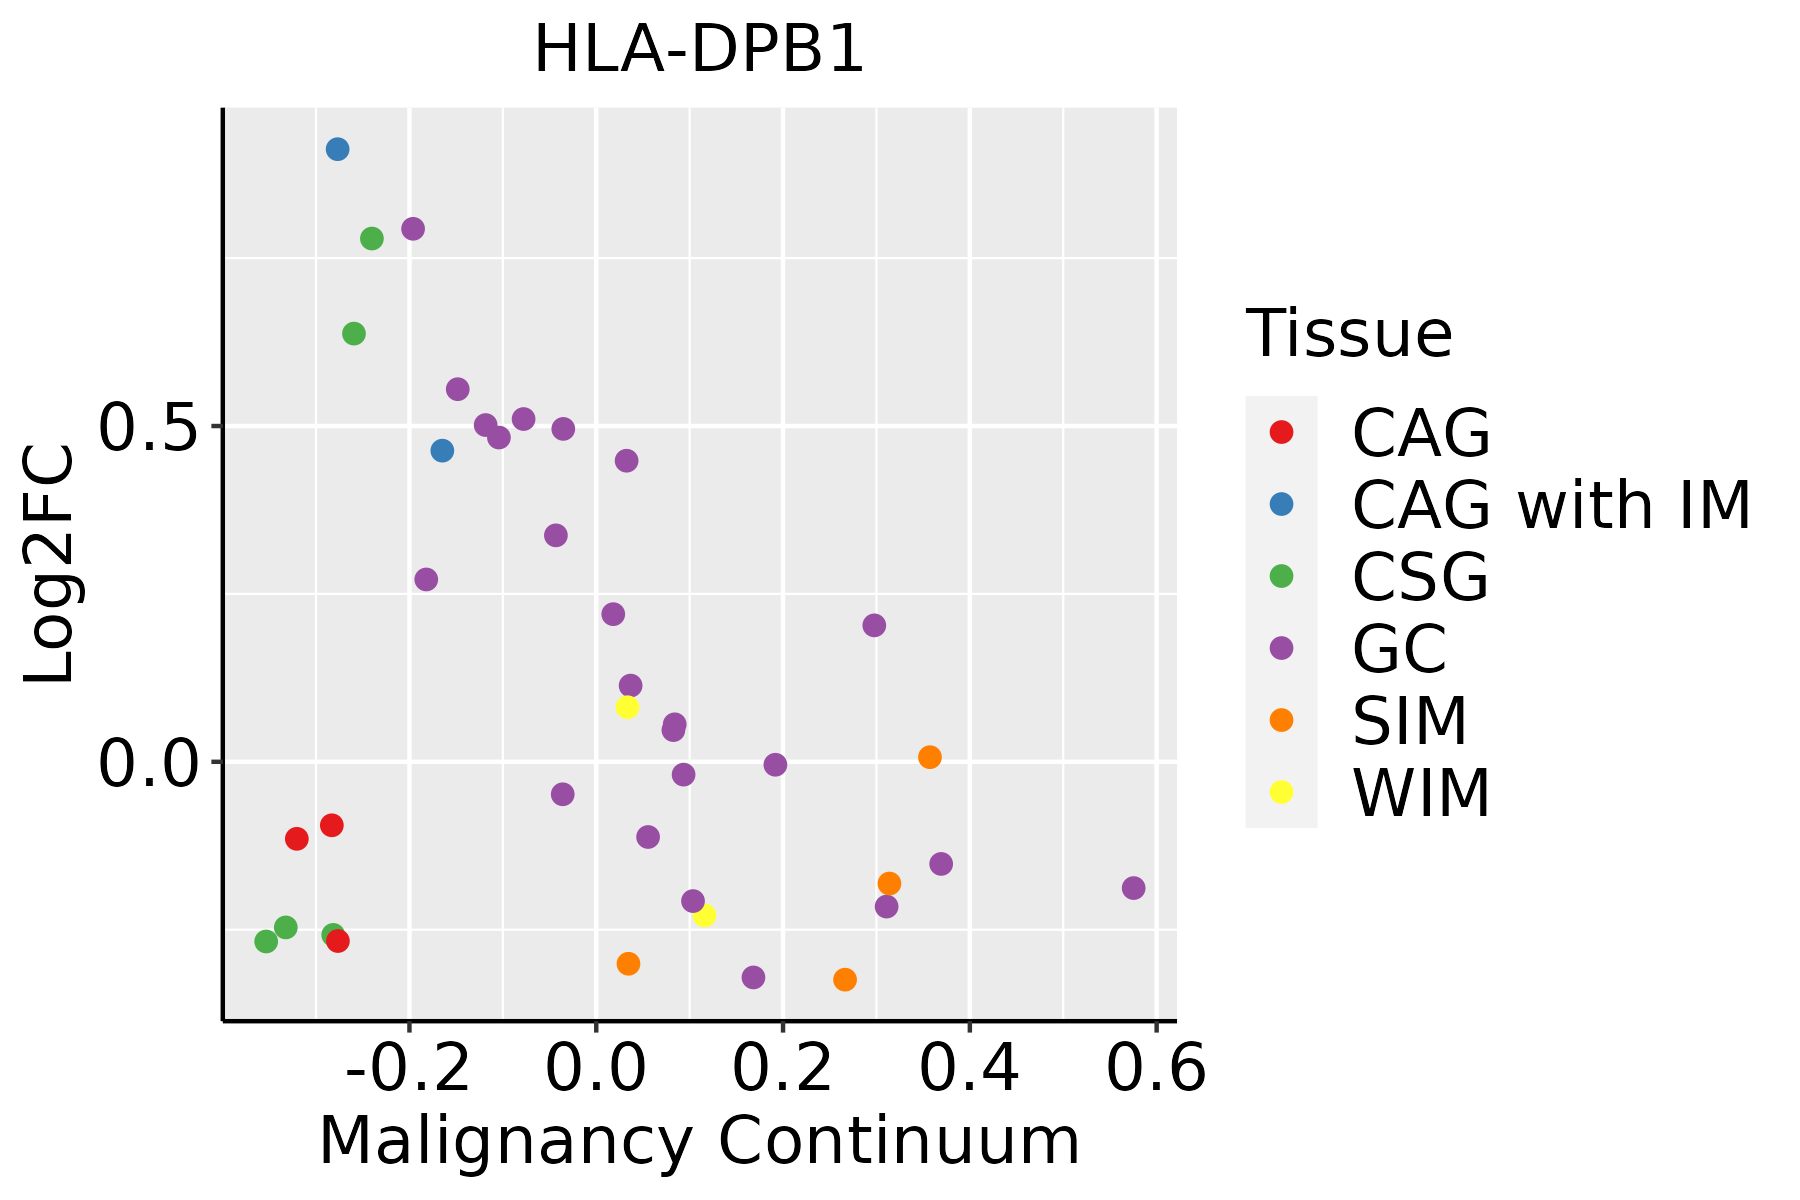 | CAG: Chronic atrophic gastritis |
| CAG with IM: Chronic atrophic gastritis with intestinal metaplasia | ||
| CSG: Chronic superficial gastritis | ||
| GC: Gastric cancer | ||
| SIM: Severe intestinal metaplasia | ||
| WIM: Wild intestinal metaplasia | ||
| Liver |  | HCC: Hepatocellular carcinoma |
| NAFLD: Non-alcoholic fatty liver disease | ||
| Lung |  | AAH: Atypical adenomatous hyperplasia |
| AIS: Adenocarcinoma in situ | ||
| IAC: Invasive lung adenocarcinoma | ||
| MIA: Minimally invasive adenocarcinoma | ||
| Oral Cavity | 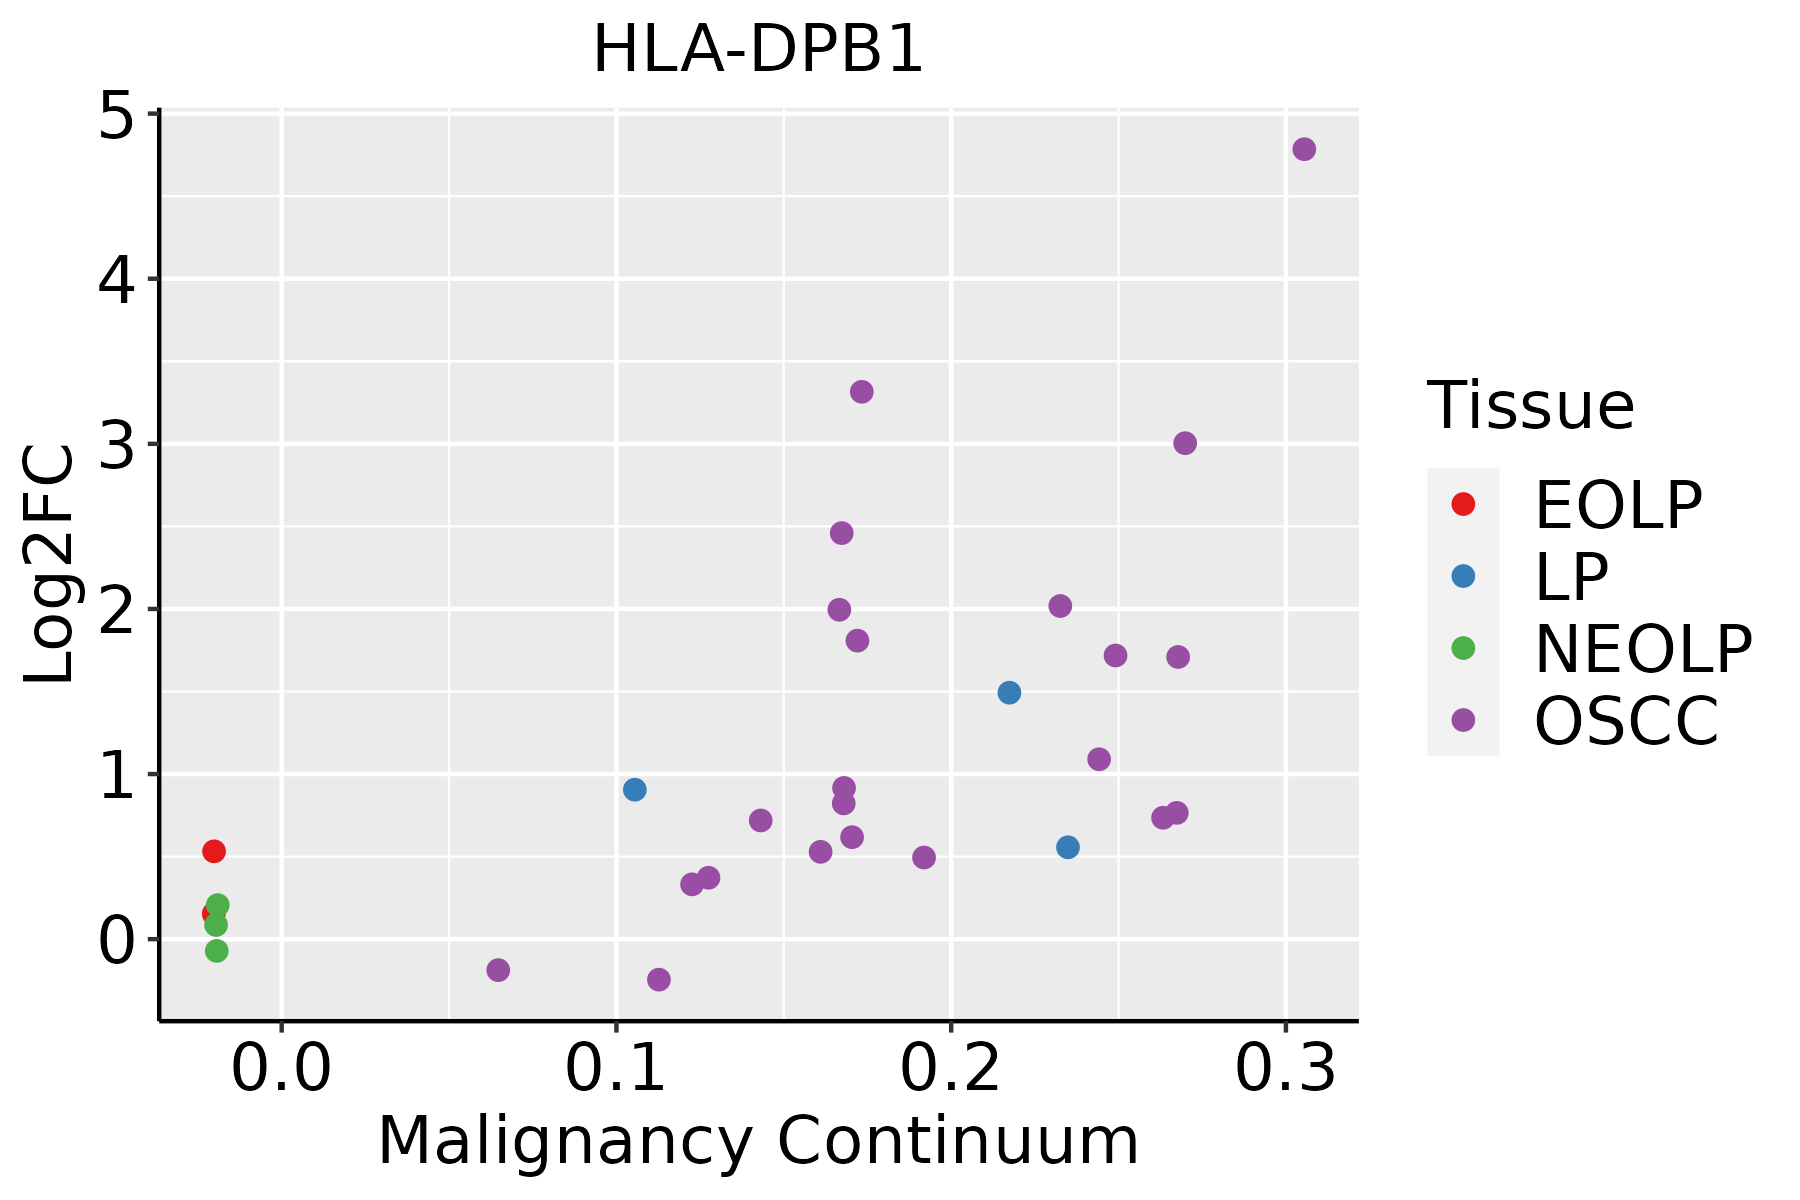 | EOLP: Erosive Oral lichen planus |
| LP: leukoplakia | ||
| NEOLP: Non-erosive oral lichen planus | ||
| OSCC: Oral squamous cell carcinoma | ||
| Prostate |  | BPH: Benign Prostatic Hyperplasia |
| Skin | 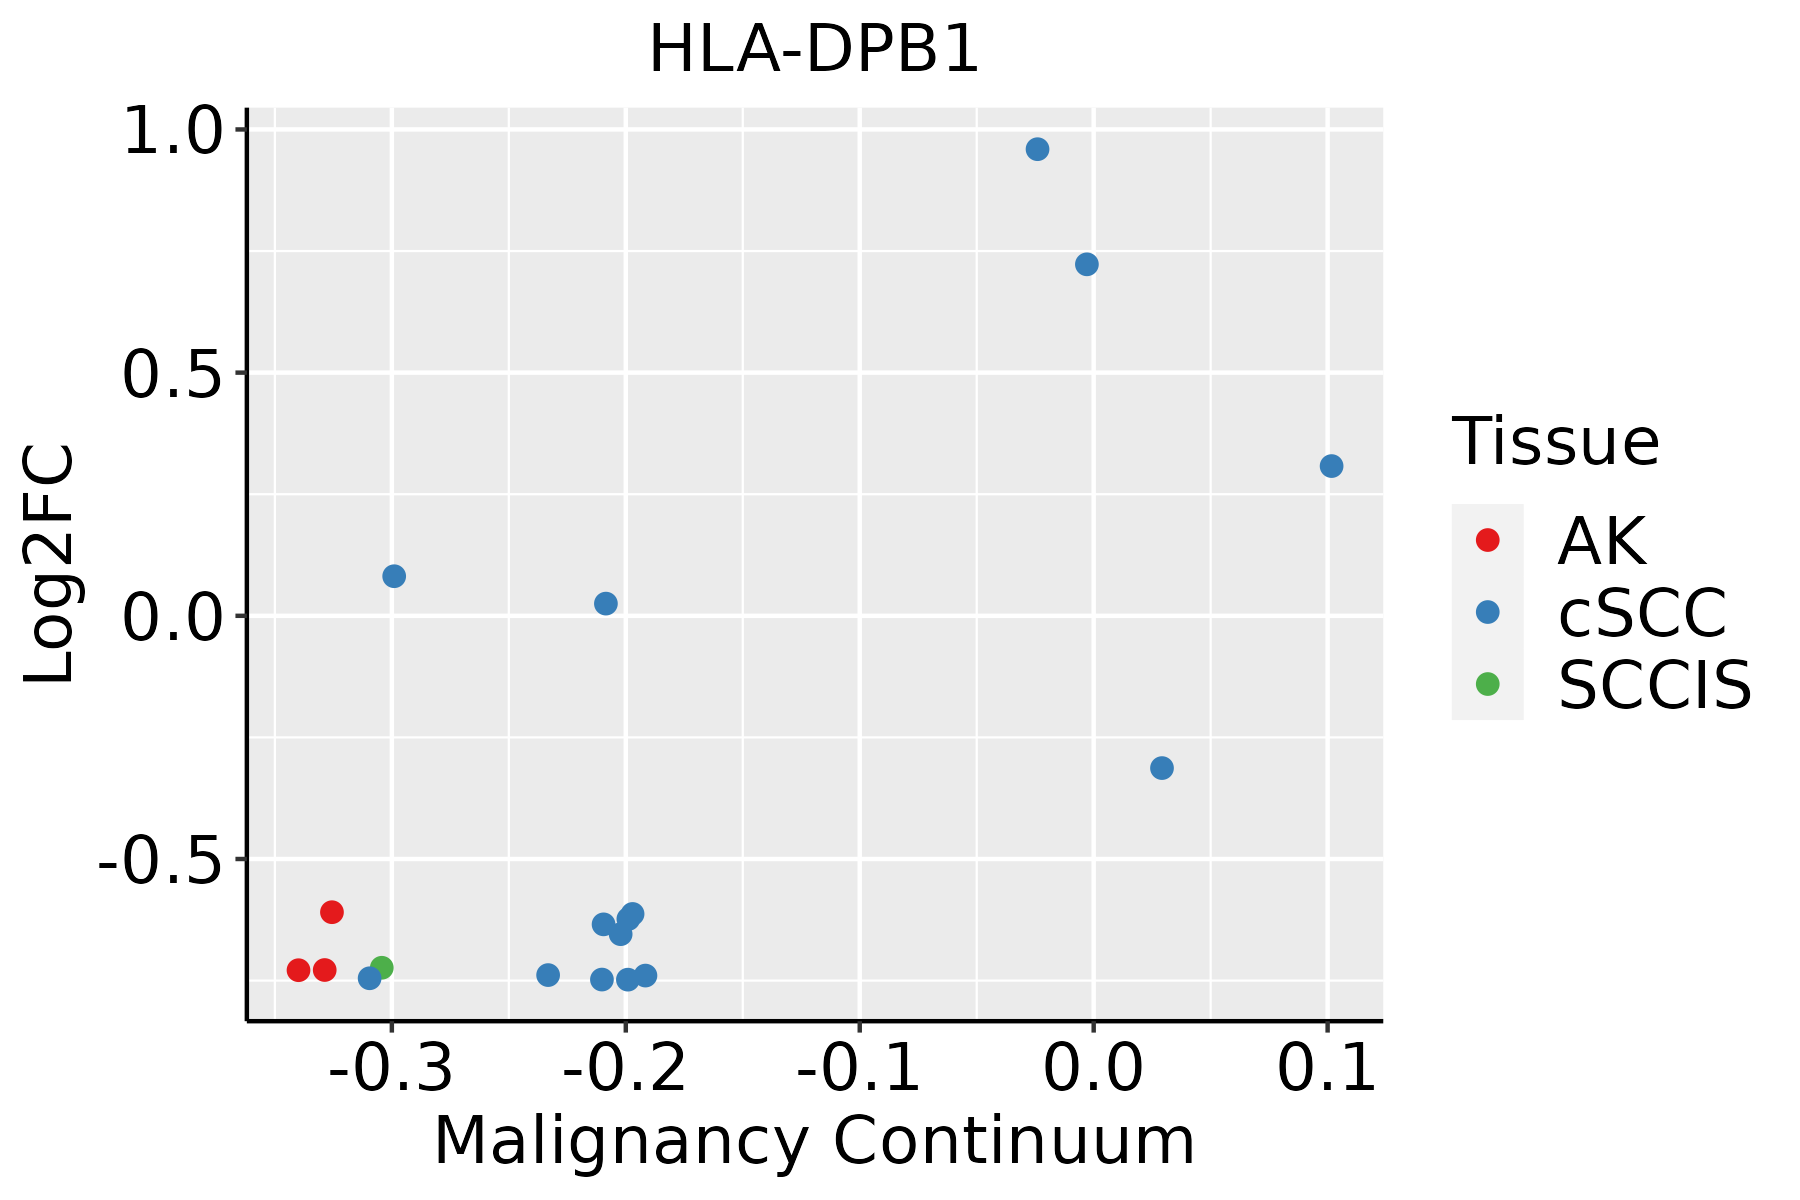 | AK: Actinic keratosis |
| cSCC: Cutaneous squamous cell carcinoma | ||
| SCCIS:squamous cell carcinoma in situ | ||
| Thyroid | 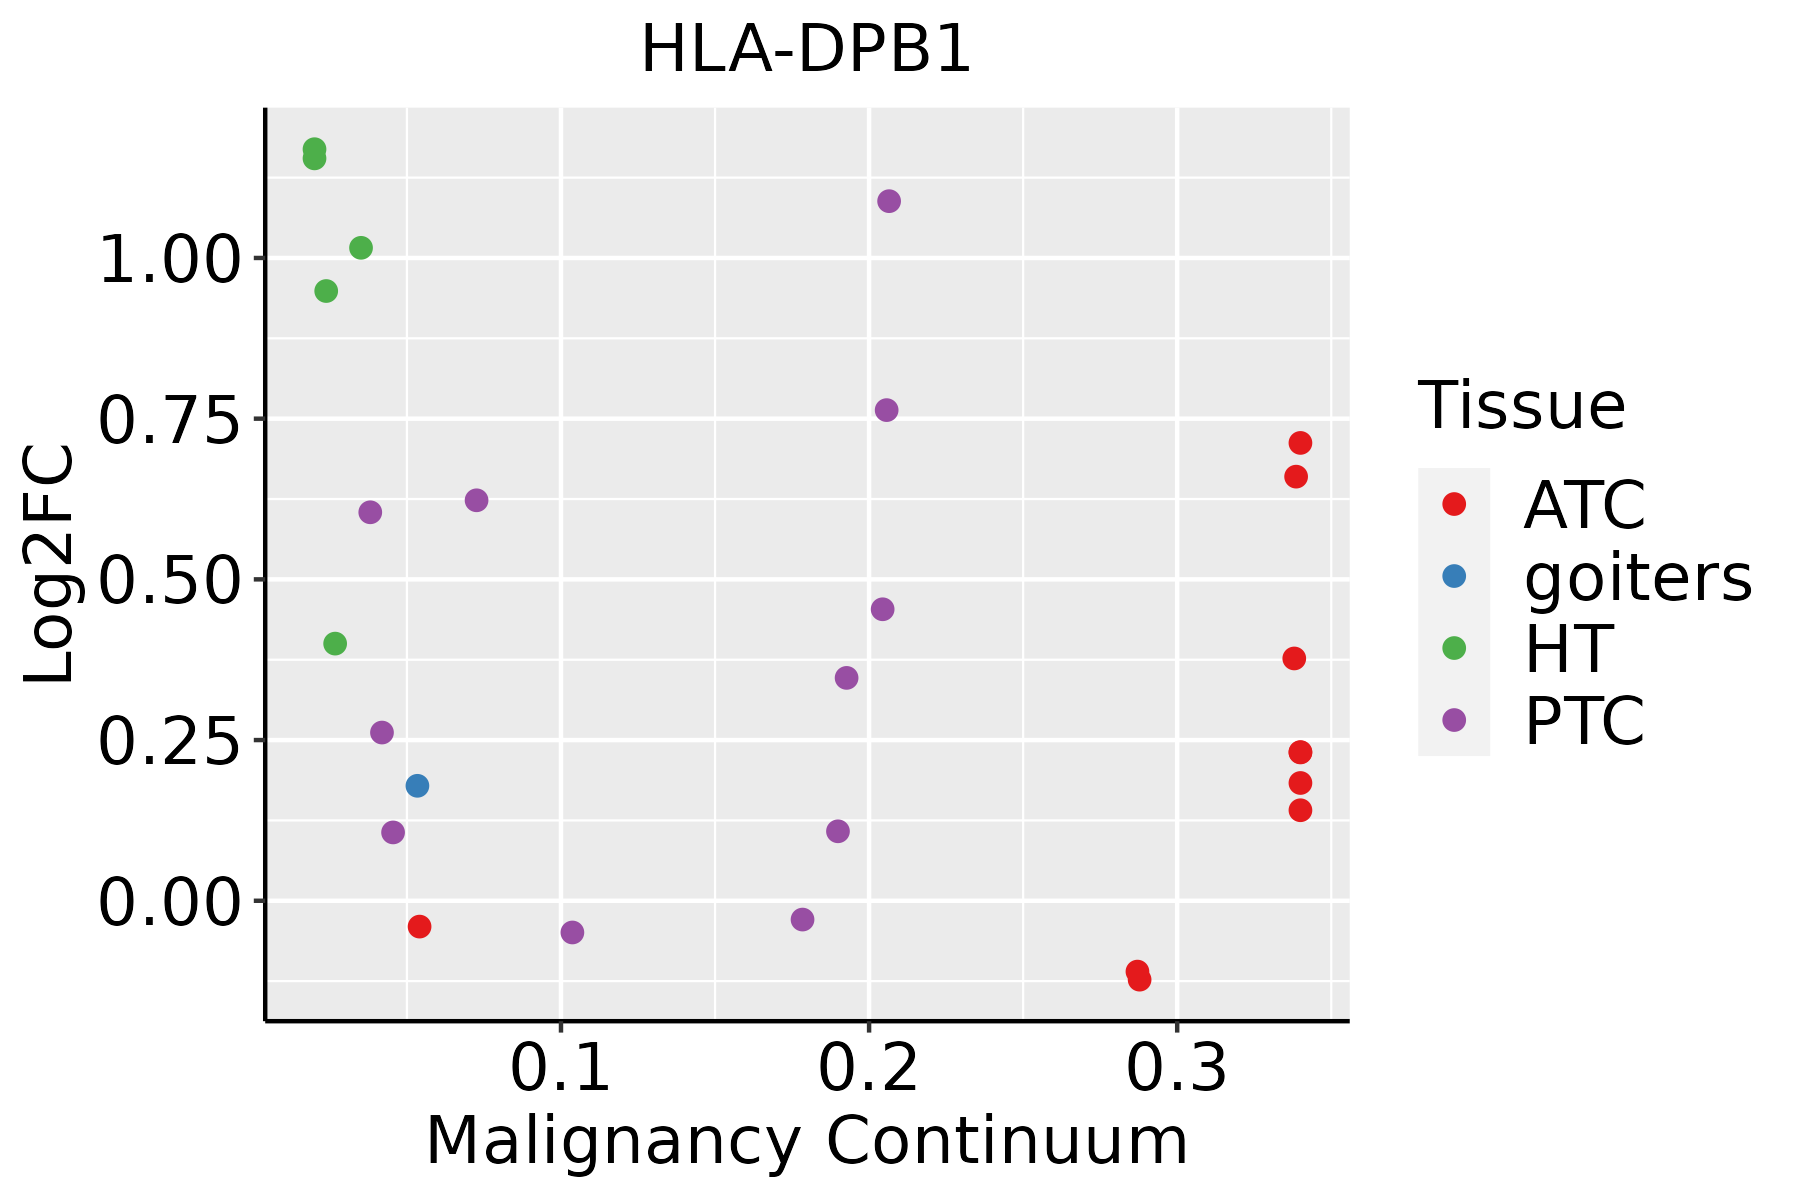 | ATC: Anaplastic thyroid cancer |
| HT: Hashimoto's thyroiditis | ||
| PTC: Papillary thyroid cancer |
| ∗log2FC in expression of this searched gene in stem-like cells from each diseased tissue sample relative to stem-like cells in normal samples in each tissue plotted against the malignancy continuum. Samples are colored based on if they are from different disease stage. |
Top |
Malignant transformation related pathway analysis |
| Find out the enriched GO biological processes and KEGG pathways involved in transition from healthy to precancer to cancer |
| Tissue | Disease Stage | Enriched GO biological Processes |
| Colorectum | AD |  |
| Colorectum | SER |  |
| Colorectum | MSS |  |
| Colorectum | MSI-H |  |
| Colorectum | FAP |  |
| ∗Top 15 enriched GO BP terms are showed in the bar plot of each disease state in each tissue. Each row represents a significant GO biological process which is colored according to the -log10(p.adjust). |
| Page: 1 2 3 4 5 6 7 8 9 |
| GO ID | Tissue | Disease Stage | Description | Gene Ratio | Bg Ratio | pvalue | p.adjust | Count |
| GO:00457859 | Breast | Precancer | positive regulation of cell adhesion | 52/1080 | 437/18723 | 5.74e-07 | 2.49e-05 | 52 |
| GO:00018196 | Breast | Precancer | positive regulation of cytokine production | 52/1080 | 467/18723 | 4.18e-06 | 1.29e-04 | 52 |
| GO:00421107 | Breast | Precancer | T cell activation | 52/1080 | 487/18723 | 1.37e-05 | 3.42e-04 | 52 |
| GO:00508707 | Breast | Precancer | positive regulation of T cell activation | 29/1080 | 216/18723 | 1.94e-05 | 4.58e-04 | 29 |
| GO:19030396 | Breast | Precancer | positive regulation of leukocyte cell-cell adhesion | 30/1080 | 239/18723 | 5.13e-05 | 1.07e-03 | 30 |
| GO:00508637 | Breast | Precancer | regulation of T cell activation | 37/1080 | 329/18723 | 8.04e-05 | 1.56e-03 | 37 |
| GO:00224098 | Breast | Precancer | positive regulation of cell-cell adhesion | 33/1080 | 284/18723 | 1.03e-04 | 1.89e-03 | 33 |
| GO:00071597 | Breast | Precancer | leukocyte cell-cell adhesion | 40/1080 | 371/18723 | 1.07e-04 | 1.94e-03 | 40 |
| GO:00480029 | Breast | Precancer | antigen processing and presentation of peptide antigen | 12/1080 | 62/18723 | 1.89e-04 | 3.04e-03 | 12 |
| GO:00224079 | Breast | Precancer | regulation of cell-cell adhesion | 45/1080 | 448/18723 | 2.12e-04 | 3.30e-03 | 45 |
| GO:19030377 | Breast | Precancer | regulation of leukocyte cell-cell adhesion | 36/1080 | 336/18723 | 2.61e-04 | 3.84e-03 | 36 |
| GO:00420987 | Breast | Precancer | T cell proliferation | 23/1080 | 199/18723 | 1.17e-03 | 1.27e-02 | 23 |
| GO:00024789 | Breast | Precancer | antigen processing and presentation of exogenous peptide antigen | 8/1080 | 38/18723 | 1.24e-03 | 1.32e-02 | 8 |
| GO:00421023 | Breast | Precancer | positive regulation of T cell proliferation | 14/1080 | 101/18723 | 1.94e-03 | 1.88e-02 | 14 |
| GO:00421296 | Breast | Precancer | regulation of T cell proliferation | 20/1080 | 171/18723 | 2.07e-03 | 1.97e-02 | 20 |
| GO:00506712 | Breast | Precancer | positive regulation of lymphocyte proliferation | 17/1080 | 137/18723 | 2.32e-03 | 2.16e-02 | 17 |
| GO:00329462 | Breast | Precancer | positive regulation of mononuclear cell proliferation | 17/1080 | 138/18723 | 2.51e-03 | 2.29e-02 | 17 |
| GO:00025017 | Breast | Precancer | peptide antigen assembly with MHC protein complex | 5/1080 | 18/18723 | 2.88e-03 | 2.49e-02 | 5 |
| GO:00023967 | Breast | Precancer | MHC protein complex assembly | 5/1080 | 19/18723 | 3.73e-03 | 3.04e-02 | 5 |
| GO:00508523 | Breast | Precancer | T cell receptor signaling pathway | 15/1080 | 123/18723 | 4.80e-03 | 3.64e-02 | 15 |
| Page: 1 2 3 4 5 6 7 8 9 10 11 12 13 14 15 16 17 18 19 20 21 22 23 24 25 26 27 28 29 30 31 32 33 34 35 36 37 38 39 |
| Pathway ID | Tissue | Disease Stage | Description | Gene Ratio | Bg Ratio | pvalue | p.adjust | qvalue | Count |
| hsa0461218 | Breast | Precancer | Antigen processing and presentation | 19/684 | 78/8465 | 9.61e-06 | 1.12e-04 | 8.62e-05 | 19 |
| hsa0516918 | Breast | Precancer | Epstein-Barr virus infection | 35/684 | 202/8465 | 1.15e-05 | 1.26e-04 | 9.64e-05 | 35 |
| hsa0414518 | Breast | Precancer | Phagosome | 27/684 | 152/8465 | 7.37e-05 | 6.85e-04 | 5.25e-04 | 27 |
| hsa0532312 | Breast | Precancer | Rheumatoid arthritis | 19/684 | 93/8465 | 1.30e-04 | 1.14e-03 | 8.73e-04 | 19 |
| hsa0541618 | Breast | Precancer | Viral myocarditis | 14/684 | 60/8465 | 2.32e-04 | 1.98e-03 | 1.52e-03 | 14 |
| hsa0516618 | Breast | Precancer | Human T-cell leukemia virus 1 infection | 33/684 | 222/8465 | 4.29e-04 | 3.31e-03 | 2.53e-03 | 33 |
| hsa0461219 | Breast | Precancer | Antigen processing and presentation | 19/684 | 78/8465 | 9.61e-06 | 1.12e-04 | 8.62e-05 | 19 |
| hsa0516919 | Breast | Precancer | Epstein-Barr virus infection | 35/684 | 202/8465 | 1.15e-05 | 1.26e-04 | 9.64e-05 | 35 |
| hsa0414519 | Breast | Precancer | Phagosome | 27/684 | 152/8465 | 7.37e-05 | 6.85e-04 | 5.25e-04 | 27 |
| hsa0532313 | Breast | Precancer | Rheumatoid arthritis | 19/684 | 93/8465 | 1.30e-04 | 1.14e-03 | 8.73e-04 | 19 |
| hsa0541619 | Breast | Precancer | Viral myocarditis | 14/684 | 60/8465 | 2.32e-04 | 1.98e-03 | 1.52e-03 | 14 |
| hsa0516619 | Breast | Precancer | Human T-cell leukemia virus 1 infection | 33/684 | 222/8465 | 4.29e-04 | 3.31e-03 | 2.53e-03 | 33 |
| hsa0516922 | Breast | IDC | Epstein-Barr virus infection | 45/867 | 202/8465 | 3.16e-07 | 6.05e-06 | 4.52e-06 | 45 |
| hsa0461223 | Breast | IDC | Antigen processing and presentation | 24/867 | 78/8465 | 4.61e-07 | 8.33e-06 | 6.23e-06 | 24 |
| hsa0414522 | Breast | IDC | Phagosome | 34/867 | 152/8465 | 8.00e-06 | 9.99e-05 | 7.48e-05 | 34 |
| hsa0541623 | Breast | IDC | Viral myocarditis | 18/867 | 60/8465 | 1.85e-05 | 2.01e-04 | 1.50e-04 | 18 |
| hsa0516624 | Breast | IDC | Human T-cell leukemia virus 1 infection | 40/867 | 222/8465 | 2.52e-04 | 2.21e-03 | 1.66e-03 | 40 |
| hsa0532321 | Breast | IDC | Rheumatoid arthritis | 21/867 | 93/8465 | 3.69e-04 | 3.15e-03 | 2.36e-03 | 21 |
| hsa0494014 | Breast | IDC | Type I diabetes mellitus | 12/867 | 43/8465 | 9.40e-04 | 7.28e-03 | 5.44e-03 | 12 |
| hsa0533012 | Breast | IDC | Allograft rejection | 11/867 | 38/8465 | 1.09e-03 | 8.26e-03 | 6.18e-03 | 11 |
| Page: 1 2 3 4 5 6 7 8 9 10 11 12 13 14 15 16 17 18 19 20 21 22 23 24 25 |
Top |
Cell-cell communication analysis |
| Identification of potential cell-cell interactions between two cell types and their ligand-receptor pairs for different disease states |
| Ligand | Receptor | LRpair | Pathway | Tissue | Disease Stage |
| HLA-DPB1 | CD4 | HLA-DPB1_CD4 | MHC-II | Breast | DCIS |
| HLA-DPB1 | CD4 | HLA-DPB1_CD4 | MHC-II | Breast | Healthy |
| HLA-DPB1 | CD4 | HLA-DPB1_CD4 | MHC-II | Breast | IDC |
| HLA-DPB1 | CD4 | HLA-DPB1_CD4 | MHC-II | Cervix | ADJ |
| HLA-DPB1 | CD4 | HLA-DPB1_CD4 | MHC-II | Cervix | CC |
| HLA-DPB1 | CD4 | HLA-DPB1_CD4 | MHC-II | Cervix | Healthy |
| HLA-DPB1 | CD4 | HLA-DPB1_CD4 | MHC-II | Cervix | Precancer |
| HLA-DPB1 | CD4 | HLA-DPB1_CD4 | MHC-II | CRC | AD |
| HLA-DPB1 | CD4 | HLA-DPB1_CD4 | MHC-II | CRC | ADJ |
| HLA-DPB1 | CD4 | HLA-DPB1_CD4 | MHC-II | CRC | FAP |
| HLA-DPB1 | CD4 | HLA-DPB1_CD4 | MHC-II | CRC | MSI-H |
| HLA-DPB1 | CD4 | HLA-DPB1_CD4 | MHC-II | CRC | MSS |
| HLA-DPB1 | CD4 | HLA-DPB1_CD4 | MHC-II | CRC | SER |
| HLA-DPB1 | CD4 | HLA-DPB1_CD4 | MHC-II | Endometrium | ADJ |
| HLA-DPB1 | CD4 | HLA-DPB1_CD4 | MHC-II | Endometrium | AEH |
| HLA-DPB1 | CD4 | HLA-DPB1_CD4 | MHC-II | Endometrium | EEC |
| HLA-DPB1 | CD4 | HLA-DPB1_CD4 | MHC-II | Endometrium | Healthy |
| HLA-DPB1 | CD4 | HLA-DPB1_CD4 | MHC-II | HNSCC | ADJ |
| HLA-DPB1 | CD4 | HLA-DPB1_CD4 | MHC-II | HNSCC | Healthy |
| HLA-DPB1 | CD4 | HLA-DPB1_CD4 | MHC-II | HNSCC | OSCC |
| Page: 1 2 3 |
Top |
Single-cell gene regulatory network inference analysis |
| Find out the significant the regulons (TFs) and the target genes of each regulon across cell types for different disease states |
| TF | Cell Type | Tissue | Disease Stage | Target Gene | RSS | Regulon Activity |
| ∗The dot plots of a searched regulon are shown for all cell subpopulations in each disease state of each tissue based on the regulon specific score inferred using pySCENIC and by calculating the average expression. |
| Page: 1 |
Top |
Somatic mutation of malignant transformation related genes |
| Annotation of somatic variants for genes involved in malignant transformation |
| Hugo Symbol | Variant Class | Variant Classification | dbSNP RS | HGVSc | HGVSp | HGVSp Short | SWISSPROT | BIOTYPE | SIFT | PolyPhen | Tumor Sample Barcode | Tissue | Histology | Sex | Age | Stage | Therapy Types | Drugs | Outcome |
| HLA-DPB1 | SNV | Missense_Mutation | novel | c.137C>T | p.Ala46Val | p.A46V | P04440 | protein_coding | deleterious(0.01) | benign(0.35) | TCGA-2W-A8YY-01 | Cervix | cervical & endocervical cancer | Female | <65 | I/II | Chemotherapy | cisplatin | CR |
| HLA-DPB1 | SNV | Missense_Mutation | c.743N>A | p.Arg248Lys | p.R248K | P04440 | protein_coding | tolerated(0.28) | benign(0.257) | TCGA-AA-3663-01 | Colorectum | colon adenocarcinoma | Male | <65 | I/II | Unknown | Unknown | SD | |
| HLA-DPB1 | SNV | Missense_Mutation | novel | c.102N>T | p.Glu34Asp | p.E34D | P04440 | protein_coding | tolerated(0.18) | benign(0) | TCGA-AA-A010-01 | Colorectum | colon adenocarcinoma | Female | <65 | I/II | Chemotherapy | folinic | CR |
| HLA-DPB1 | SNV | Missense_Mutation | c.244N>T | p.Arg82Trp | p.R82W | P04440 | protein_coding | deleterious(0) | probably_damaging(0.998) | TCGA-AZ-6598-01 | Colorectum | colon adenocarcinoma | Female | >=65 | I/II | Unknown | Unknown | SD | |
| HLA-DPB1 | SNV | Missense_Mutation | novel | c.25N>C | p.Ala9Pro | p.A9P | P04440 | protein_coding | deleterious(0.01) | benign(0.312) | TCGA-G4-6309-01 | Colorectum | colon adenocarcinoma | Female | <65 | III/IV | Chemotherapy | xeloda | PD |
| HLA-DPB1 | insertion | Frame_Shift_Ins | novel | c.571_572insC | p.Gln193ProfsTer17 | p.Q193Pfs*17 | P04440 | protein_coding | TCGA-AA-3715-01 | Colorectum | colon adenocarcinoma | Male | >=65 | I/II | Unknown | Unknown | PD | ||
| HLA-DPB1 | deletion | Frame_Shift_Del | rs780393867 | c.572delN | p.Gln193SerfsTer35 | p.Q193Sfs*35 | P04440 | protein_coding | TCGA-D5-6540-01 | Colorectum | colon adenocarcinoma | Male | >=65 | I/II | Unknown | Unknown | SD | ||
| HLA-DPB1 | SNV | Missense_Mutation | novel | c.5T>C | p.Met2Thr | p.M2T | P04440 | protein_coding | deleterious(0.02) | benign(0.05) | TCGA-AJ-A3EK-01 | Endometrium | uterine corpus endometrioid carcinoma | Female | <65 | I/II | Chemotherapy | carboplatin | CR |
| HLA-DPB1 | SNV | Missense_Mutation | novel | c.102G>T | p.Glu34Asp | p.E34D | P04440 | protein_coding | tolerated(0.18) | benign(0) | TCGA-AJ-A3EL-01 | Endometrium | uterine corpus endometrioid carcinoma | Female | <65 | I/II | Unknown | Unknown | SD |
| HLA-DPB1 | SNV | Missense_Mutation | novel | c.102N>T | p.Glu34Asp | p.E34D | P04440 | protein_coding | tolerated(0.18) | benign(0) | TCGA-AJ-A5DW-01 | Endometrium | uterine corpus endometrioid carcinoma | Female | <65 | I/II | Unknown | Unknown | SD |
| Page: 1 2 3 |
Top |
Related drugs of malignant transformation related genes |
| Identification of chemicals and drugs interact with genes involved in malignant transfromation |
| (DGIdb 4.0) |
| Entrez ID | Symbol | Category | Interaction Types | Drug Claim Name | Drug Name | PMIDs |
| 3115 | HLA-DPB1 | CELL SURFACE, DRUGGABLE GENOME, CLINICALLY ACTIONABLE | clozapine | CLOZAPINE | 11266078 | |
| 3115 | HLA-DPB1 | CELL SURFACE, DRUGGABLE GENOME, CLINICALLY ACTIONABLE | aspirin | ASPIRIN | 15007363,15784113,19392989,9179433 |
| Page: 1 |

Copyright 2023-Present -The University of Texas Health Science Center at Houston |