
|
|||||
|
 | |
| |
| |
| |
| |
| |
|
Gene: HLA-DOA |
Gene summary for HLA-DOA |
| Gene information | Species | Human | Gene symbol | HLA-DOA | Gene ID | 3111 |
| Gene name | major histocompatibility complex, class II, DO alpha | |
| Gene Alias | HLA-DNA | |
| Cytomap | 6p21.32 | |
| Gene Type | protein-coding | GO ID | GO:0001775 | UniProtAcc | A0A1V0E3M7 |
Top |
Malignant transformation analysis |
| Identification of the aberrant gene expression in precancerous and cancerous lesions by comparing the gene expression of stem-like cells in diseased tissues with normal stem cells |
| Entrez ID | Symbol | Replicates | Species | Organ | Tissue | Adj P-value | Log2FC | Malignancy |
| 3111 | HLA-DOA | LZE6T | Human | Esophagus | ESCC | 1.37e-02 | 1.36e-01 | 0.0845 |
| 3111 | HLA-DOA | P2T-E | Human | Esophagus | ESCC | 8.31e-40 | 8.41e-01 | 0.1177 |
| 3111 | HLA-DOA | P11T-E | Human | Esophagus | ESCC | 9.40e-08 | 3.29e-01 | 0.1426 |
| 3111 | HLA-DOA | P16T-E | Human | Esophagus | ESCC | 3.91e-05 | 1.21e-01 | 0.1153 |
| 3111 | HLA-DOA | P17T-E | Human | Esophagus | ESCC | 2.14e-04 | 2.94e-01 | 0.1278 |
| 3111 | HLA-DOA | P24T-E | Human | Esophagus | ESCC | 1.94e-04 | 1.59e-01 | 0.1287 |
| 3111 | HLA-DOA | P74T-E | Human | Esophagus | ESCC | 6.60e-08 | 2.37e-01 | 0.1479 |
| 3111 | HLA-DOA | P80T-E | Human | Esophagus | ESCC | 1.53e-39 | 1.27e+00 | 0.155 |
| 3111 | HLA-DOA | HCC2 | Human | Liver | HCC | 3.98e-05 | 8.23e-01 | 0.5341 |
| 3111 | HLA-DOA | HCC5 | Human | Liver | HCC | 1.92e-09 | 1.11e+00 | 0.4932 |
| 3111 | HLA-DOA | Pt13.a | Human | Liver | HCC | 1.43e-02 | 7.71e-02 | 0.021 |
| 3111 | HLA-DOA | Pt14.d | Human | Liver | HCC | 4.86e-07 | 1.54e-01 | 0.0143 |
| Page: 1 |
| Tissue | Expression Dynamics | Abbreviation |
| Esophagus | 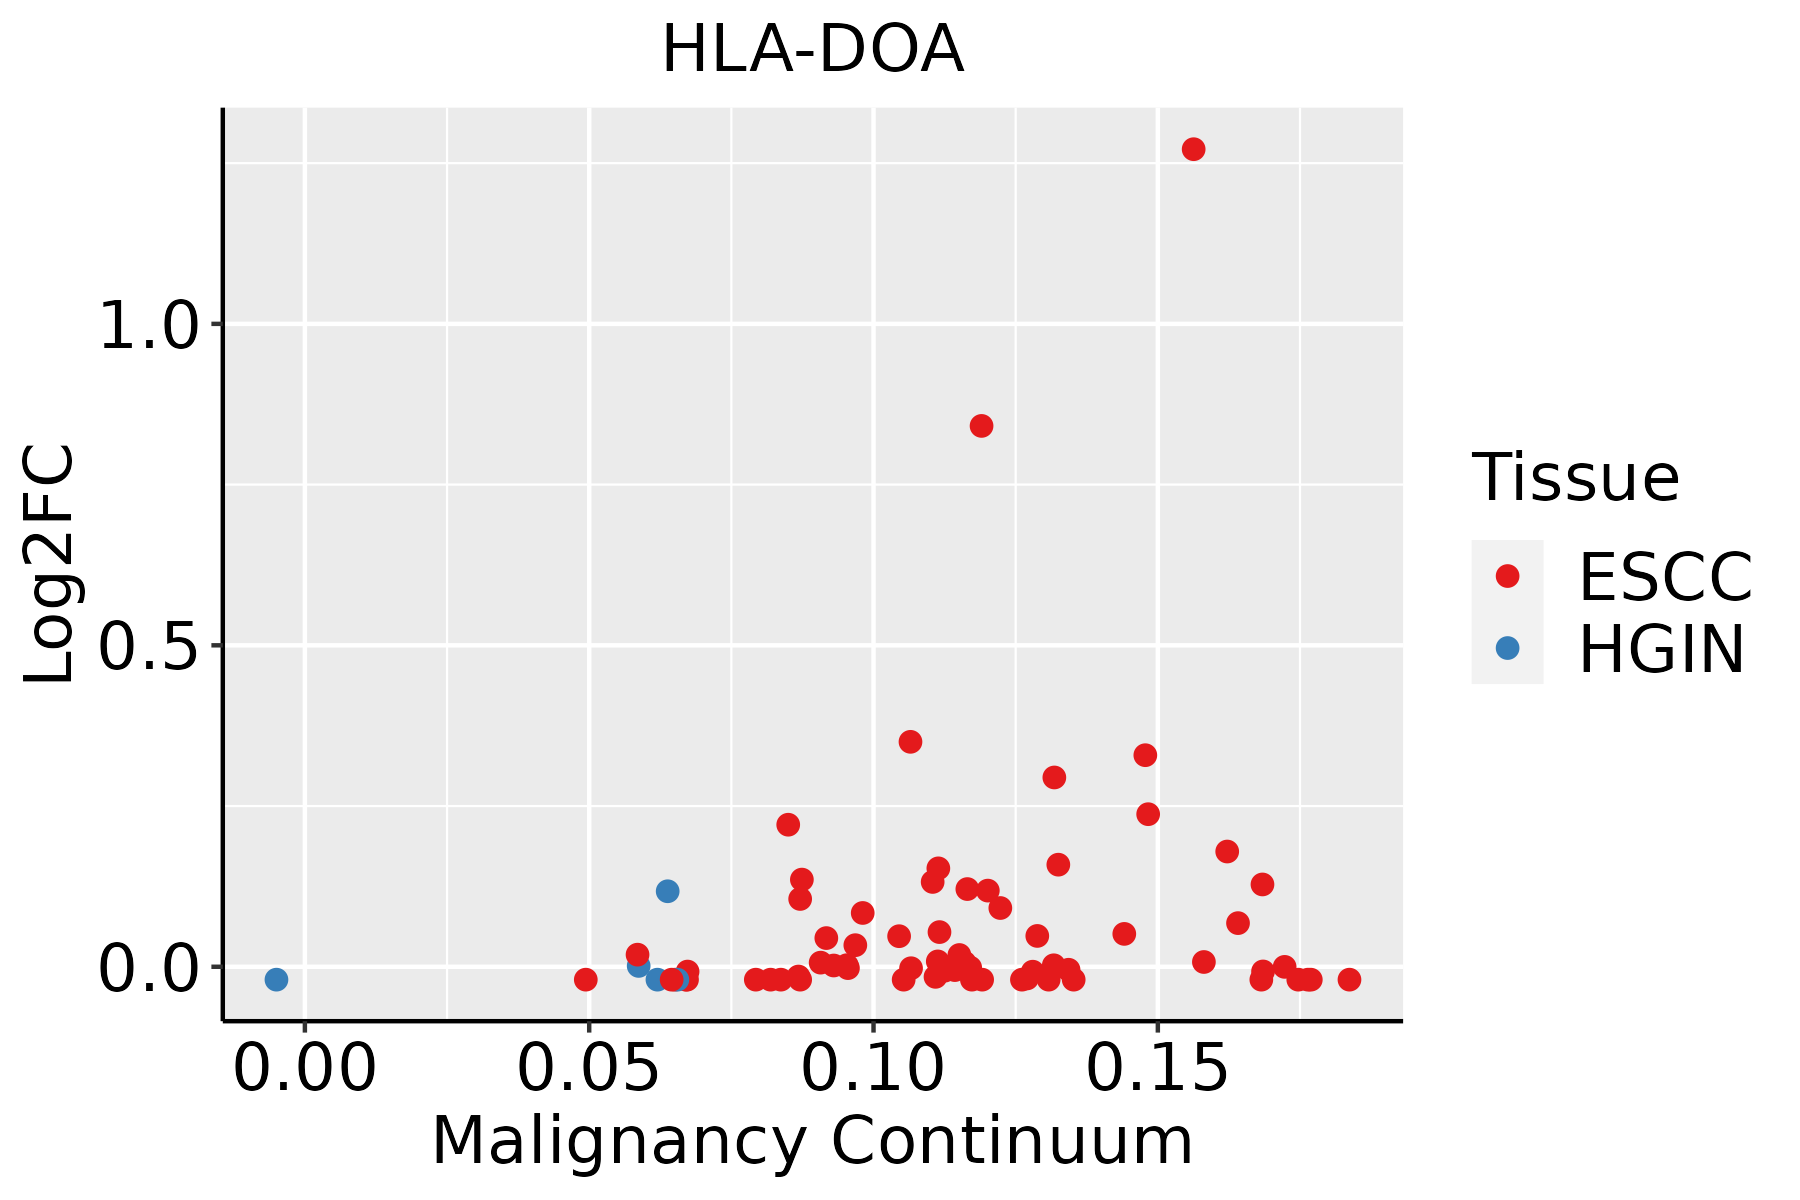 | ESCC: Esophageal squamous cell carcinoma |
| HGIN: High-grade intraepithelial neoplasias | ||
| LGIN: Low-grade intraepithelial neoplasias | ||
| Liver | 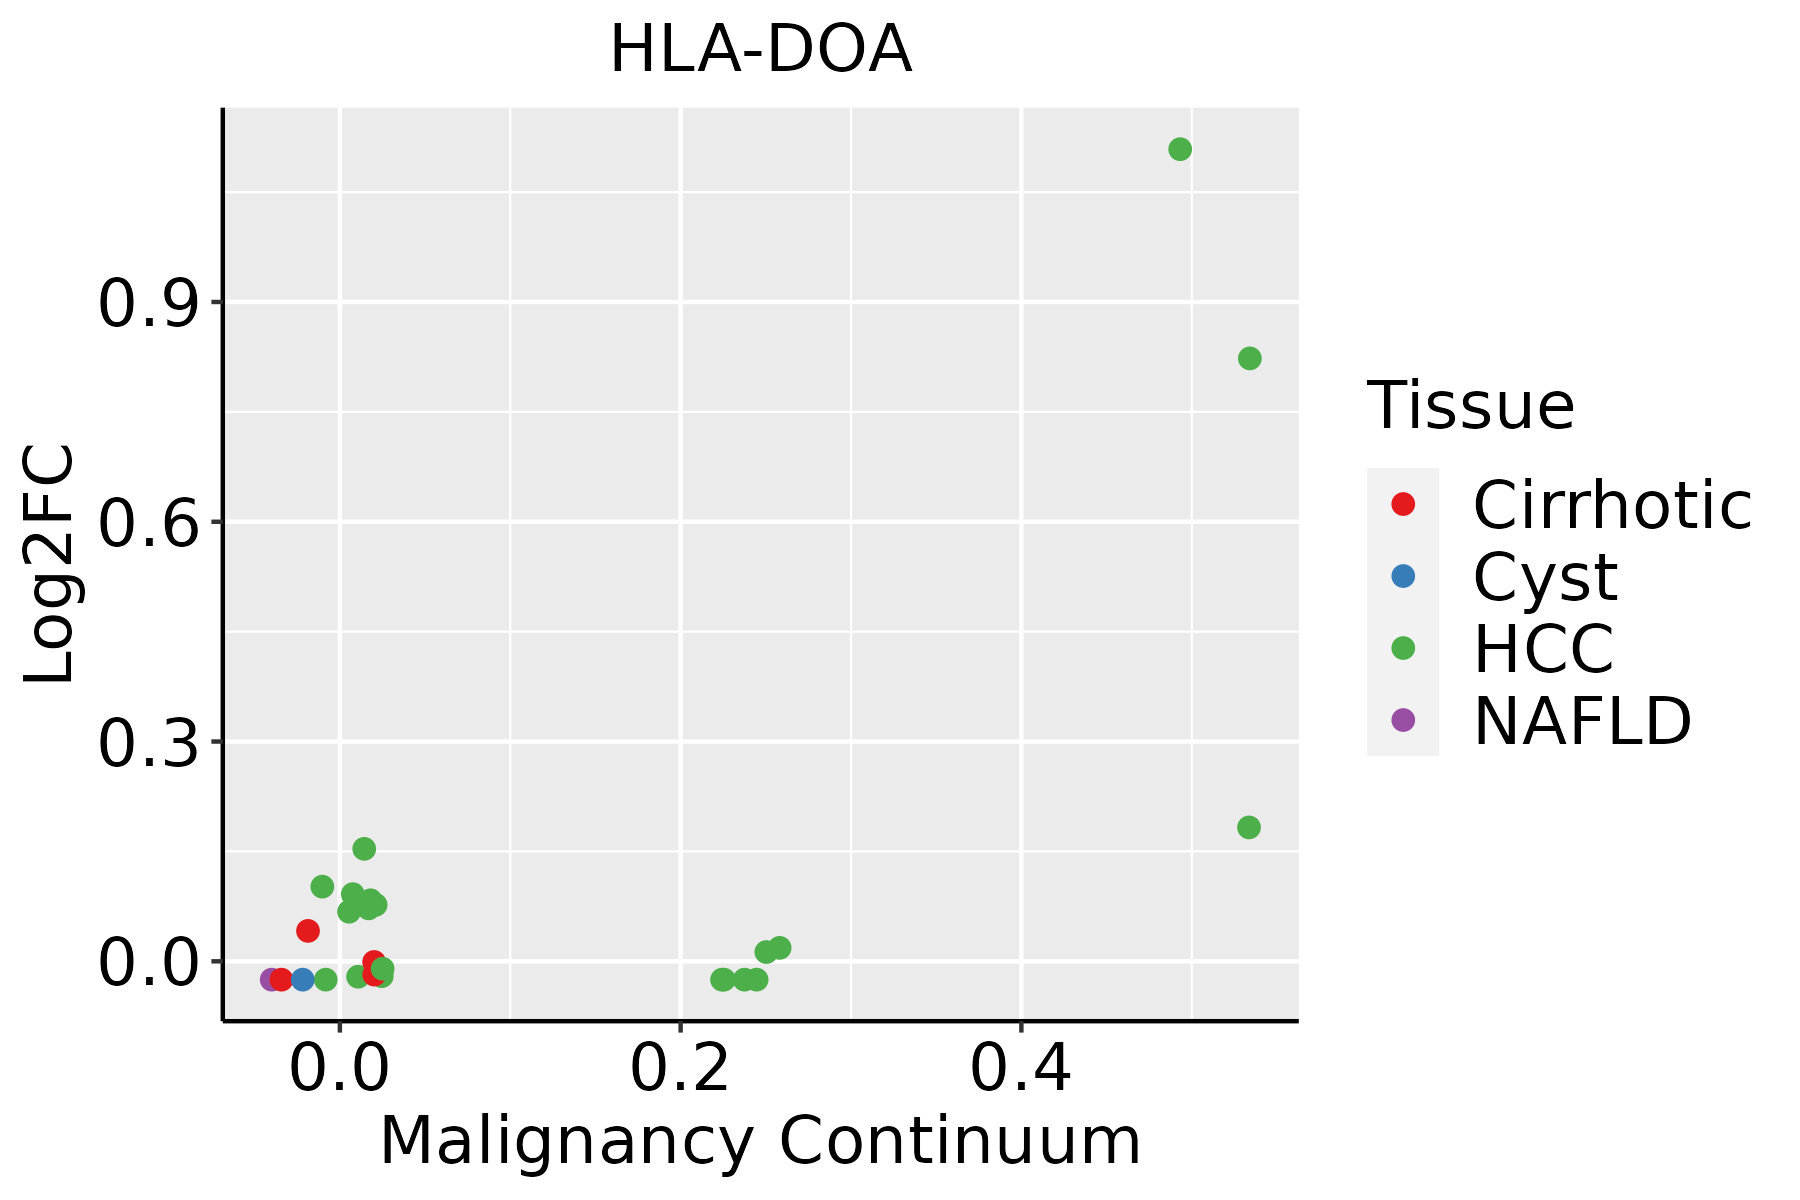 | HCC: Hepatocellular carcinoma |
| NAFLD: Non-alcoholic fatty liver disease |
| ∗log2FC in expression of this searched gene in stem-like cells from each diseased tissue sample relative to stem-like cells in normal samples in each tissue plotted against the malignancy continuum. Samples are colored based on if they are from different disease stage. |
Top |
Malignant transformation related pathway analysis |
| Find out the enriched GO biological processes and KEGG pathways involved in transition from healthy to precancer to cancer |
| Tissue | Disease Stage | Enriched GO biological Processes |
| Colorectum | AD |  |
| Colorectum | SER |  |
| Colorectum | MSS |  |
| Colorectum | MSI-H |  |
| Colorectum | FAP |  |
| ∗Top 15 enriched GO BP terms are showed in the bar plot of each disease state in each tissue. Each row represents a significant GO biological process which is colored according to the -log10(p.adjust). |
| Page: 1 2 3 4 5 6 7 8 9 |
| GO ID | Tissue | Disease Stage | Description | Gene Ratio | Bg Ratio | pvalue | p.adjust | Count |
| GO:004578527 | Esophagus | ESCC | positive regulation of cell adhesion | 255/8552 | 437/18723 | 5.07e-08 | 9.11e-07 | 255 |
| GO:004800220 | Esophagus | ESCC | antigen processing and presentation of peptide antigen | 44/8552 | 62/18723 | 4.81e-05 | 3.78e-04 | 44 |
| GO:000247820 | Esophagus | ESCC | antigen processing and presentation of exogenous peptide antigen | 29/8552 | 38/18723 | 1.18e-04 | 8.13e-04 | 29 |
| GO:001988225 | Esophagus | ESCC | antigen processing and presentation | 67/8552 | 106/18723 | 2.03e-04 | 1.28e-03 | 67 |
| GO:1903706110 | Esophagus | ESCC | regulation of hemopoiesis | 201/8552 | 367/18723 | 2.60e-04 | 1.58e-03 | 201 |
| GO:001988420 | Esophagus | ESCC | antigen processing and presentation of exogenous antigen | 33/8552 | 47/18723 | 5.77e-04 | 3.14e-03 | 33 |
| GO:002240720 | Esophagus | ESCC | regulation of cell-cell adhesion | 239/8552 | 448/18723 | 5.88e-04 | 3.19e-03 | 239 |
| GO:000268316 | Esophagus | ESCC | negative regulation of immune system process | 231/8552 | 434/18723 | 8.48e-04 | 4.36e-03 | 231 |
| GO:000250417 | Esophagus | ESCC | antigen processing and presentation of peptide or polysaccharide antigen via MHC class II | 26/8552 | 36/18723 | 1.14e-03 | 5.66e-03 | 26 |
| GO:004211018 | Esophagus | ESCC | T cell activation | 256/8552 | 487/18723 | 1.18e-03 | 5.87e-03 | 256 |
| GO:19031317 | Esophagus | ESCC | mononuclear cell differentiation | 226/8552 | 426/18723 | 1.20e-03 | 5.88e-03 | 226 |
| GO:002240919 | Esophagus | ESCC | positive regulation of cell-cell adhesion | 155/8552 | 284/18723 | 1.50e-03 | 7.06e-03 | 155 |
| GO:190210510 | Esophagus | ESCC | regulation of leukocyte differentiation | 152/8552 | 279/18723 | 1.82e-03 | 8.35e-03 | 152 |
| GO:001988618 | Esophagus | ESCC | antigen processing and presentation of exogenous peptide antigen via MHC class II | 22/8552 | 30/18723 | 1.98e-03 | 8.90e-03 | 22 |
| GO:00023815 | Esophagus | ESCC | immunoglobulin production involved in immunoglobulin-mediated immune response | 44/8552 | 70/18723 | 2.80e-03 | 1.19e-02 | 44 |
| GO:000249517 | Esophagus | ESCC | antigen processing and presentation of peptide antigen via MHC class II | 24/8552 | 34/18723 | 2.90e-03 | 1.22e-02 | 24 |
| GO:000239618 | Esophagus | ESCC | MHC protein complex assembly | 15/8552 | 19/18723 | 3.29e-03 | 1.35e-02 | 15 |
| GO:000250116 | Esophagus | ESCC | peptide antigen assembly with MHC protein complex | 14/8552 | 18/18723 | 5.77e-03 | 2.14e-02 | 14 |
| GO:005087015 | Esophagus | ESCC | positive regulation of T cell activation | 117/8552 | 216/18723 | 7.23e-03 | 2.62e-02 | 117 |
| GO:00302176 | Esophagus | ESCC | T cell differentiation | 137/8552 | 257/18723 | 8.09e-03 | 2.87e-02 | 137 |
| Page: 1 2 |
| Pathway ID | Tissue | Disease Stage | Description | Gene Ratio | Bg Ratio | pvalue | p.adjust | qvalue | Count |
| hsa05166211 | Esophagus | ESCC | Human T-cell leukemia virus 1 infection | 164/4205 | 222/8465 | 8.13e-14 | 2.09e-12 | 1.07e-12 | 164 |
| hsa05169210 | Esophagus | ESCC | Epstein-Barr virus infection | 151/4205 | 202/8465 | 1.55e-13 | 3.45e-12 | 1.77e-12 | 151 |
| hsa0516425 | Esophagus | ESCC | Influenza A | 122/4205 | 171/8465 | 5.01e-09 | 4.79e-08 | 2.45e-08 | 122 |
| hsa0414530 | Esophagus | ESCC | Phagosome | 100/4205 | 152/8465 | 3.81e-05 | 1.72e-04 | 8.82e-05 | 100 |
| hsa0514525 | Esophagus | ESCC | Toxoplasmosis | 76/4205 | 112/8465 | 6.83e-05 | 2.90e-04 | 1.48e-04 | 76 |
| hsa051527 | Esophagus | ESCC | Tuberculosis | 111/4205 | 180/8465 | 7.14e-04 | 2.32e-03 | 1.19e-03 | 111 |
| hsa0541630 | Esophagus | ESCC | Viral myocarditis | 41/4205 | 60/8465 | 2.59e-03 | 7.05e-03 | 3.61e-03 | 41 |
| hsa046599 | Esophagus | ESCC | Th17 cell differentiation | 68/4205 | 108/8465 | 3.53e-03 | 9.30e-03 | 4.76e-03 | 68 |
| hsa0461230 | Esophagus | ESCC | Antigen processing and presentation | 51/4205 | 78/8465 | 3.57e-03 | 9.34e-03 | 4.78e-03 | 51 |
| hsa0532320 | Esophagus | ESCC | Rheumatoid arthritis | 59/4205 | 93/8465 | 4.98e-03 | 1.27e-02 | 6.52e-03 | 59 |
| hsa046585 | Esophagus | ESCC | Th1 and Th2 cell differentiation | 58/4205 | 92/8465 | 6.49e-03 | 1.60e-02 | 8.19e-03 | 58 |
| hsa05166310 | Esophagus | ESCC | Human T-cell leukemia virus 1 infection | 164/4205 | 222/8465 | 8.13e-14 | 2.09e-12 | 1.07e-12 | 164 |
| hsa0516937 | Esophagus | ESCC | Epstein-Barr virus infection | 151/4205 | 202/8465 | 1.55e-13 | 3.45e-12 | 1.77e-12 | 151 |
| hsa0516435 | Esophagus | ESCC | Influenza A | 122/4205 | 171/8465 | 5.01e-09 | 4.79e-08 | 2.45e-08 | 122 |
| hsa04145114 | Esophagus | ESCC | Phagosome | 100/4205 | 152/8465 | 3.81e-05 | 1.72e-04 | 8.82e-05 | 100 |
| hsa05145111 | Esophagus | ESCC | Toxoplasmosis | 76/4205 | 112/8465 | 6.83e-05 | 2.90e-04 | 1.48e-04 | 76 |
| hsa0515212 | Esophagus | ESCC | Tuberculosis | 111/4205 | 180/8465 | 7.14e-04 | 2.32e-03 | 1.19e-03 | 111 |
| hsa05416114 | Esophagus | ESCC | Viral myocarditis | 41/4205 | 60/8465 | 2.59e-03 | 7.05e-03 | 3.61e-03 | 41 |
| hsa0465914 | Esophagus | ESCC | Th17 cell differentiation | 68/4205 | 108/8465 | 3.53e-03 | 9.30e-03 | 4.76e-03 | 68 |
| hsa04612114 | Esophagus | ESCC | Antigen processing and presentation | 51/4205 | 78/8465 | 3.57e-03 | 9.34e-03 | 4.78e-03 | 51 |
| Page: 1 2 |
Top |
Cell-cell communication analysis |
| Identification of potential cell-cell interactions between two cell types and their ligand-receptor pairs for different disease states |
| Ligand | Receptor | LRpair | Pathway | Tissue | Disease Stage |
| HLA-DOA | CD4 | HLA-DOA_CD4 | MHC-II | Breast | DCIS |
| HLA-DOA | CD4 | HLA-DOA_CD4 | MHC-II | Breast | Healthy |
| HLA-DOA | CD4 | HLA-DOA_CD4 | MHC-II | Breast | IDC |
| HLA-DOA | CD4 | HLA-DOA_CD4 | MHC-II | Cervix | CC |
| HLA-DOA | CD4 | HLA-DOA_CD4 | MHC-II | CRC | AD |
| HLA-DOA | CD4 | HLA-DOA_CD4 | MHC-II | CRC | MSI-H |
| HLA-DOA | CD4 | HLA-DOA_CD4 | MHC-II | CRC | SER |
| HLA-DOA | CD4 | HLA-DOA_CD4 | MHC-II | Endometrium | Healthy |
| HLA-DOA | CD4 | HLA-DOA_CD4 | MHC-II | HNSCC | ADJ |
| HLA-DOA | CD4 | HLA-DOA_CD4 | MHC-II | HNSCC | Healthy |
| HLA-DOA | CD4 | HLA-DOA_CD4 | MHC-II | HNSCC | OSCC |
| HLA-DOA | CD4 | HLA-DOA_CD4 | MHC-II | HNSCC | Precancer |
| HLA-DOA | CD4 | HLA-DOA_CD4 | MHC-II | Liver | HCC |
| HLA-DOA | CD4 | HLA-DOA_CD4 | MHC-II | Liver | Precancer |
| HLA-DOA | CD4 | HLA-DOA_CD4 | MHC-II | Lung | AAH |
| HLA-DOA | CD4 | HLA-DOA_CD4 | MHC-II | Lung | ADJ |
| HLA-DOA | CD4 | HLA-DOA_CD4 | MHC-II | Lung | AIS |
| HLA-DOA | CD4 | HLA-DOA_CD4 | MHC-II | Lung | IAC |
| HLA-DOA | CD4 | HLA-DOA_CD4 | MHC-II | Lung | Precancer |
| HLA-DOA | CD4 | HLA-DOA_CD4 | MHC-II | Prostate | ADJ |
| Page: 1 2 |
Top |
Single-cell gene regulatory network inference analysis |
| Find out the significant the regulons (TFs) and the target genes of each regulon across cell types for different disease states |
| TF | Cell Type | Tissue | Disease Stage | Target Gene | RSS | Regulon Activity |
| ∗The dot plots of a searched regulon are shown for all cell subpopulations in each disease state of each tissue based on the regulon specific score inferred using pySCENIC and by calculating the average expression. |
| Page: 1 |
Top |
Somatic mutation of malignant transformation related genes |
| Annotation of somatic variants for genes involved in malignant transformation |
| Hugo Symbol | Variant Class | Variant Classification | dbSNP RS | HGVSc | HGVSp | HGVSp Short | SWISSPROT | BIOTYPE | SIFT | PolyPhen | Tumor Sample Barcode | Tissue | Histology | Sex | Age | Stage | Therapy Types | Drugs | Outcome |
| HLA-DOA | SNV | Missense_Mutation | c.593N>G | p.Ala198Gly | p.A198G | P06340 | protein_coding | tolerated(0.1) | benign(0.017) | TCGA-A2-A3XT-01 | Breast | breast invasive carcinoma | Female | <65 | I/II | Chemotherapy | cyclophosphamide | PR | |
| HLA-DOA | SNV | Missense_Mutation | novel | c.305N>A | p.Arg102His | p.R102H | P06340 | protein_coding | deleterious(0.04) | possibly_damaging(0.609) | TCGA-E9-A3Q9-01 | Breast | breast invasive carcinoma | Female | >=65 | III/IV | Chemotherapy | cyclophosphane | CR |
| HLA-DOA | SNV | Missense_Mutation | rs771856453 | c.304N>T | p.Arg102Cys | p.R102C | P06340 | protein_coding | deleterious(0.04) | probably_damaging(0.998) | TCGA-AA-3815-01 | Colorectum | colon adenocarcinoma | Female | >=65 | I/II | Unknown | Unknown | SD |
| HLA-DOA | SNV | Missense_Mutation | c.268N>A | p.Ala90Thr | p.A90T | P06340 | protein_coding | deleterious(0.01) | benign(0.197) | TCGA-AD-5900-01 | Colorectum | colon adenocarcinoma | Male | >=65 | I/II | Unknown | Unknown | SD | |
| HLA-DOA | SNV | Missense_Mutation | novel | c.245N>T | p.Pro82Leu | p.P82L | P06340 | protein_coding | tolerated(0.13) | benign(0.025) | TCGA-D5-6530-01 | Colorectum | colon adenocarcinoma | Male | <65 | I/II | Unknown | Unknown | SD |
| HLA-DOA | SNV | Missense_Mutation | rs200187983 | c.445C>T | p.Arg149Cys | p.R149C | P06340 | protein_coding | tolerated(0.13) | possibly_damaging(0.861) | TCGA-AF-A56N-01 | Colorectum | rectum adenocarcinoma | Female | <65 | I/II | Chemotherapy | xeloda | CR |
| HLA-DOA | SNV | Missense_Mutation | c.579N>A | p.His193Gln | p.H193Q | P06340 | protein_coding | deleterious(0.01) | probably_damaging(0.999) | TCGA-AG-A002-01 | Colorectum | rectum adenocarcinoma | Male | <65 | I/II | Unknown | Unknown | SD | |
| HLA-DOA | SNV | Missense_Mutation | novel | c.155T>C | p.Phe52Ser | p.F52S | P06340 | protein_coding | deleterious(0.02) | probably_damaging(0.941) | TCGA-F5-6814-01 | Colorectum | rectum adenocarcinoma | Male | <65 | I/II | Unknown | Unknown | SD |
| HLA-DOA | SNV | Missense_Mutation | rs769161861 | c.593N>T | p.Ala198Val | p.A198V | P06340 | protein_coding | deleterious(0.02) | benign(0.063) | TCGA-A5-A0G2-01 | Endometrium | uterine corpus endometrioid carcinoma | Female | <65 | III/IV | Unknown | Unknown | SD |
| HLA-DOA | SNV | Missense_Mutation | novel | c.335N>A | p.Pro112His | p.P112H | P06340 | protein_coding | deleterious(0.04) | possibly_damaging(0.62) | TCGA-A5-A1OF-01 | Endometrium | uterine corpus endometrioid carcinoma | Female | <65 | I/II | Unknown | Unknown | SD |
| Page: 1 2 3 |
Top |
Related drugs of malignant transformation related genes |
| Identification of chemicals and drugs interact with genes involved in malignant transfromation |
| (DGIdb 4.0) |
| Entrez ID | Symbol | Category | Interaction Types | Drug Claim Name | Drug Name | PMIDs |
| Page: 1 |

Copyright 2023-Present -The University of Texas Health Science Center at Houston |