
|
|||||
|
 | |
| |
| |
| |
| |
| |
|
Gene: HLA-DMB |
Gene summary for HLA-DMB |
| Gene information | Species | Human | Gene symbol | HLA-DMB | Gene ID | 3109 |
| Gene name | major histocompatibility complex, class II, DM beta | |
| Gene Alias | D6S221E | |
| Cytomap | 6p21.32 | |
| Gene Type | protein-coding | GO ID | GO:0001775 | UniProtAcc | A0A1V0E3P2 |
Top |
Malignant transformation analysis |
| Identification of the aberrant gene expression in precancerous and cancerous lesions by comparing the gene expression of stem-like cells in diseased tissues with normal stem cells |
| Entrez ID | Symbol | Replicates | Species | Organ | Tissue | Adj P-value | Log2FC | Malignancy |
| 3109 | HLA-DMB | NCCBC11 | Human | Breast | DCIS | 9.18e-05 | 5.04e-01 | 0.1232 |
| 3109 | HLA-DMB | NCCBC3 | Human | Breast | DCIS | 1.04e-17 | 5.42e-01 | 0.1198 |
| 3109 | HLA-DMB | LZE6T | Human | Esophagus | ESCC | 1.76e-08 | 5.43e-01 | 0.0845 |
| 3109 | HLA-DMB | P2T-E | Human | Esophagus | ESCC | 2.75e-28 | 9.04e-01 | 0.1177 |
| 3109 | HLA-DMB | P11T-E | Human | Esophagus | ESCC | 3.27e-12 | 6.37e-01 | 0.1426 |
| 3109 | HLA-DMB | P16T-E | Human | Esophagus | ESCC | 2.08e-03 | 9.57e-03 | 0.1153 |
| 3109 | HLA-DMB | P17T-E | Human | Esophagus | ESCC | 1.82e-08 | 5.98e-01 | 0.1278 |
| 3109 | HLA-DMB | P21T-E | Human | Esophagus | ESCC | 4.74e-31 | 8.06e-01 | 0.1617 |
| 3109 | HLA-DMB | P23T-E | Human | Esophagus | ESCC | 8.15e-04 | 2.36e-01 | 0.108 |
| 3109 | HLA-DMB | P24T-E | Human | Esophagus | ESCC | 3.71e-12 | 4.10e-01 | 0.1287 |
| 3109 | HLA-DMB | P36T-E | Human | Esophagus | ESCC | 2.89e-02 | 1.98e-01 | 0.1187 |
| 3109 | HLA-DMB | P40T-E | Human | Esophagus | ESCC | 3.09e-02 | 2.23e-01 | 0.109 |
| 3109 | HLA-DMB | P52T-E | Human | Esophagus | ESCC | 2.41e-06 | 4.20e-01 | 0.1555 |
| 3109 | HLA-DMB | P54T-E | Human | Esophagus | ESCC | 1.12e-07 | 3.52e-01 | 0.0975 |
| 3109 | HLA-DMB | P57T-E | Human | Esophagus | ESCC | 1.41e-02 | 1.99e-01 | 0.0926 |
| 3109 | HLA-DMB | P62T-E | Human | Esophagus | ESCC | 3.07e-25 | 7.15e-01 | 0.1302 |
| 3109 | HLA-DMB | P65T-E | Human | Esophagus | ESCC | 2.85e-08 | 3.55e-01 | 0.0978 |
| 3109 | HLA-DMB | P74T-E | Human | Esophagus | ESCC | 2.80e-11 | 4.03e-01 | 0.1479 |
| 3109 | HLA-DMB | P75T-E | Human | Esophagus | ESCC | 8.69e-04 | 3.11e-01 | 0.1125 |
| 3109 | HLA-DMB | P76T-E | Human | Esophagus | ESCC | 1.09e-08 | 3.74e-01 | 0.1207 |
| Page: 1 2 3 |
| Tissue | Expression Dynamics | Abbreviation |
| Breast | 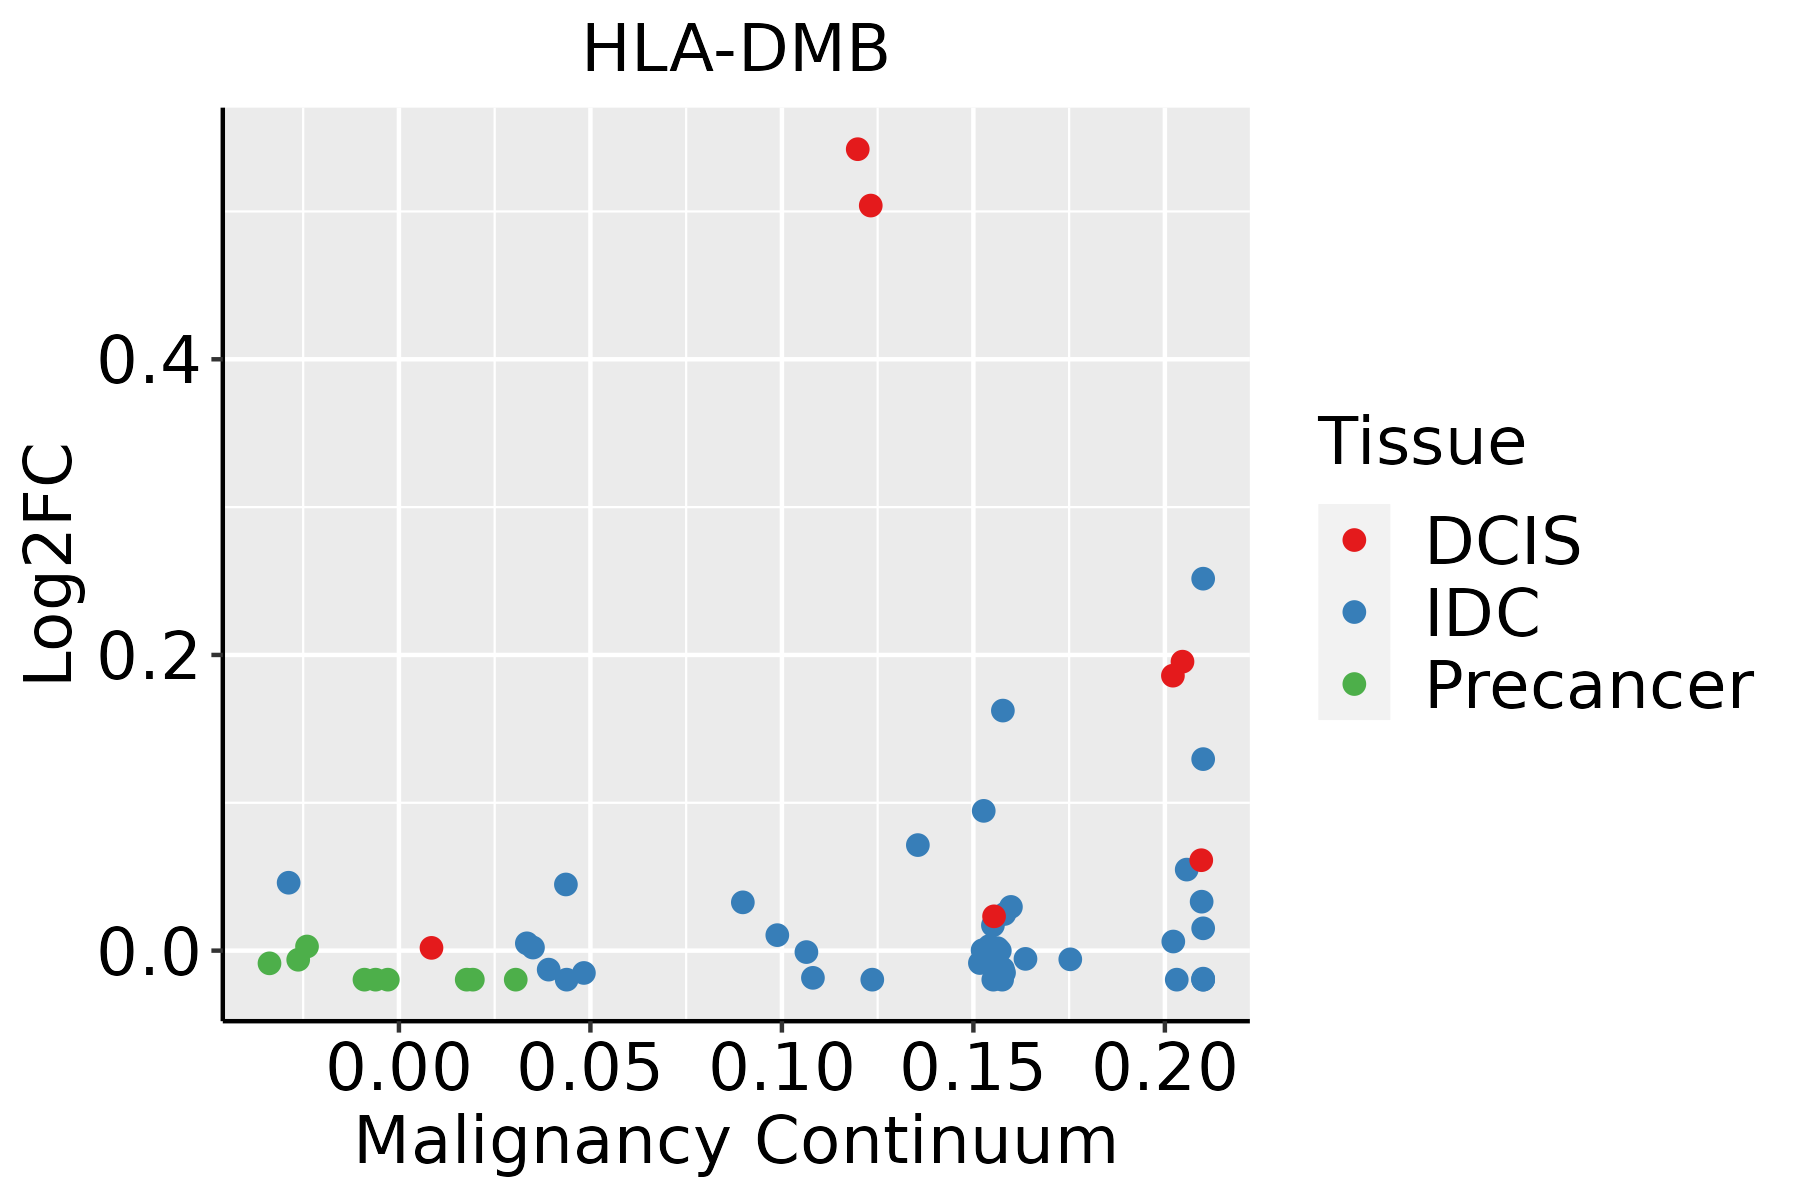 | IDC: Invasive ductal carcinoma |
| DCIS: Ductal carcinoma in situ | ||
| Precancer(BRCA1-mut): Precancerous lesion from BRCA1 mutation carriers | ||
| Esophagus | 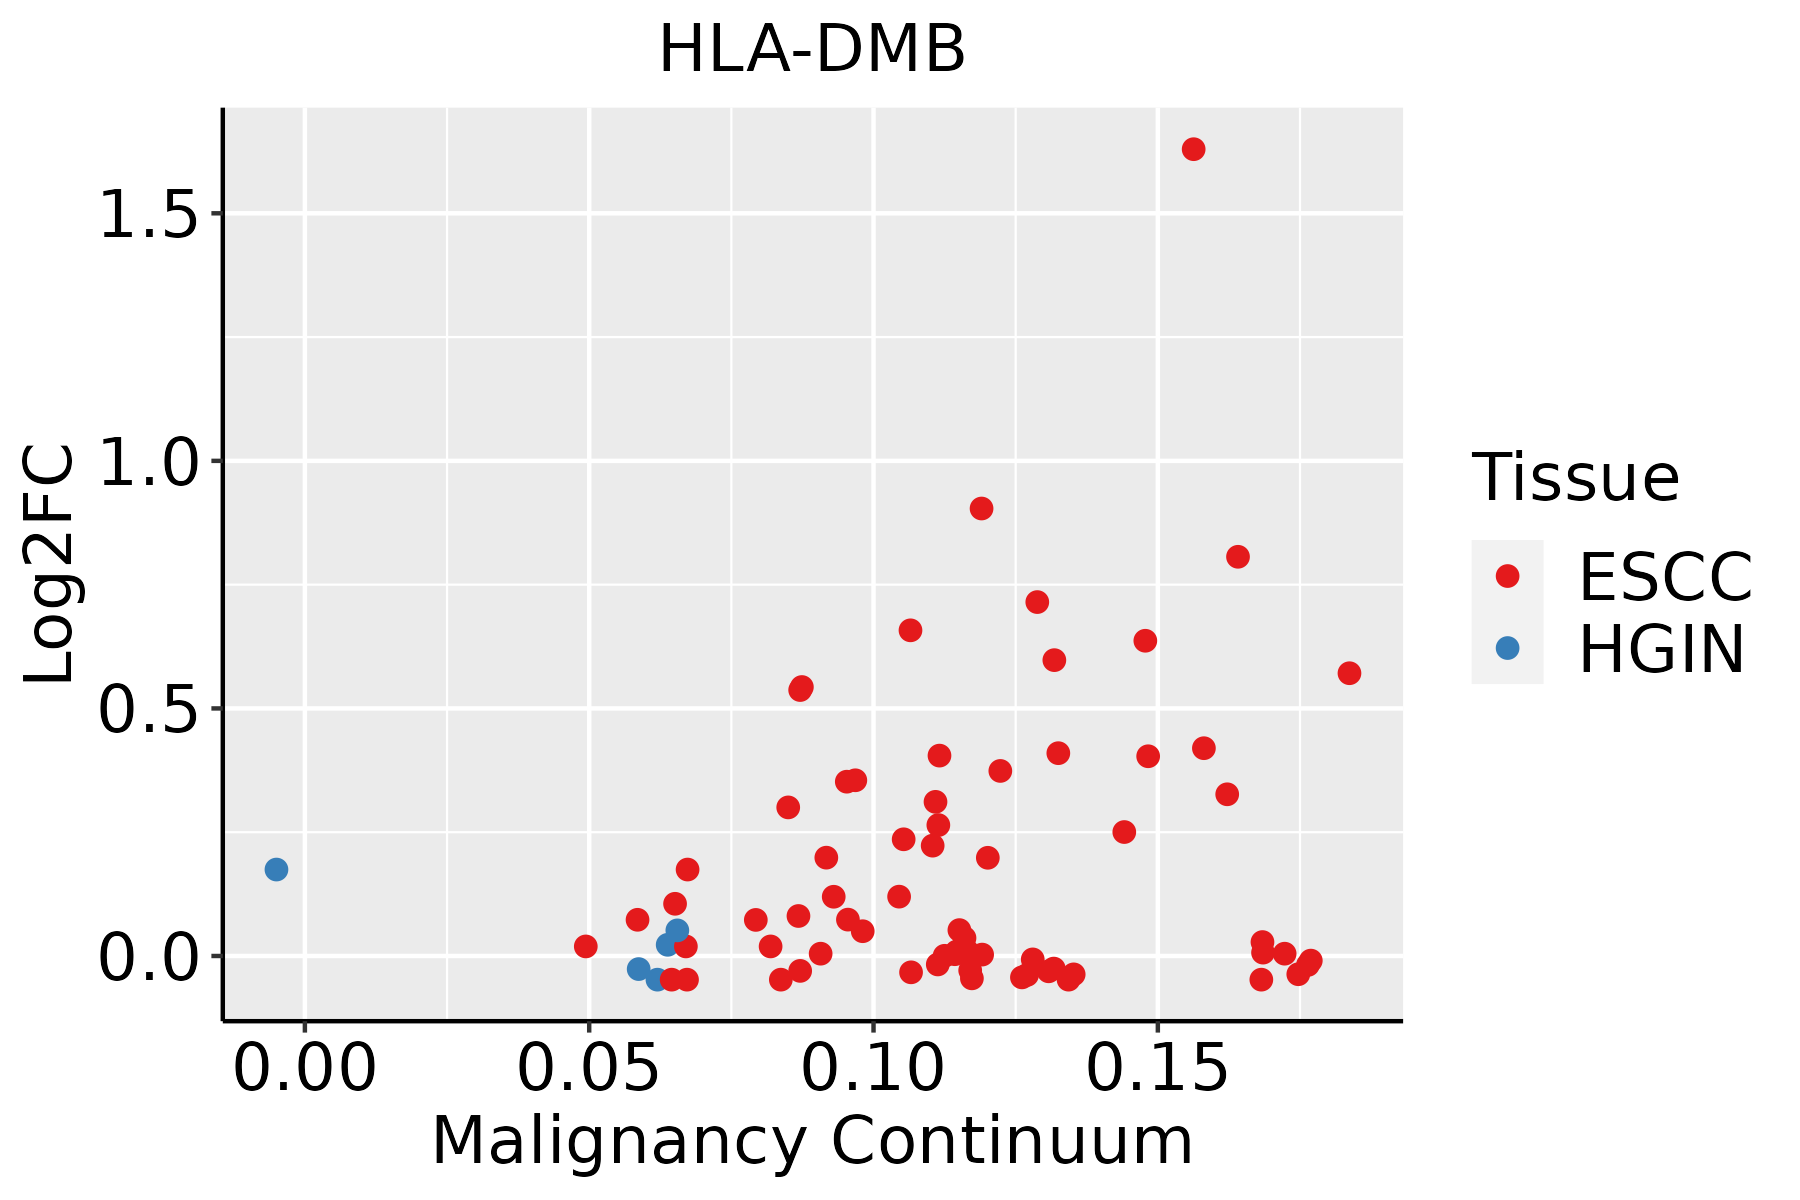 | ESCC: Esophageal squamous cell carcinoma |
| HGIN: High-grade intraepithelial neoplasias | ||
| LGIN: Low-grade intraepithelial neoplasias | ||
| Oral Cavity | 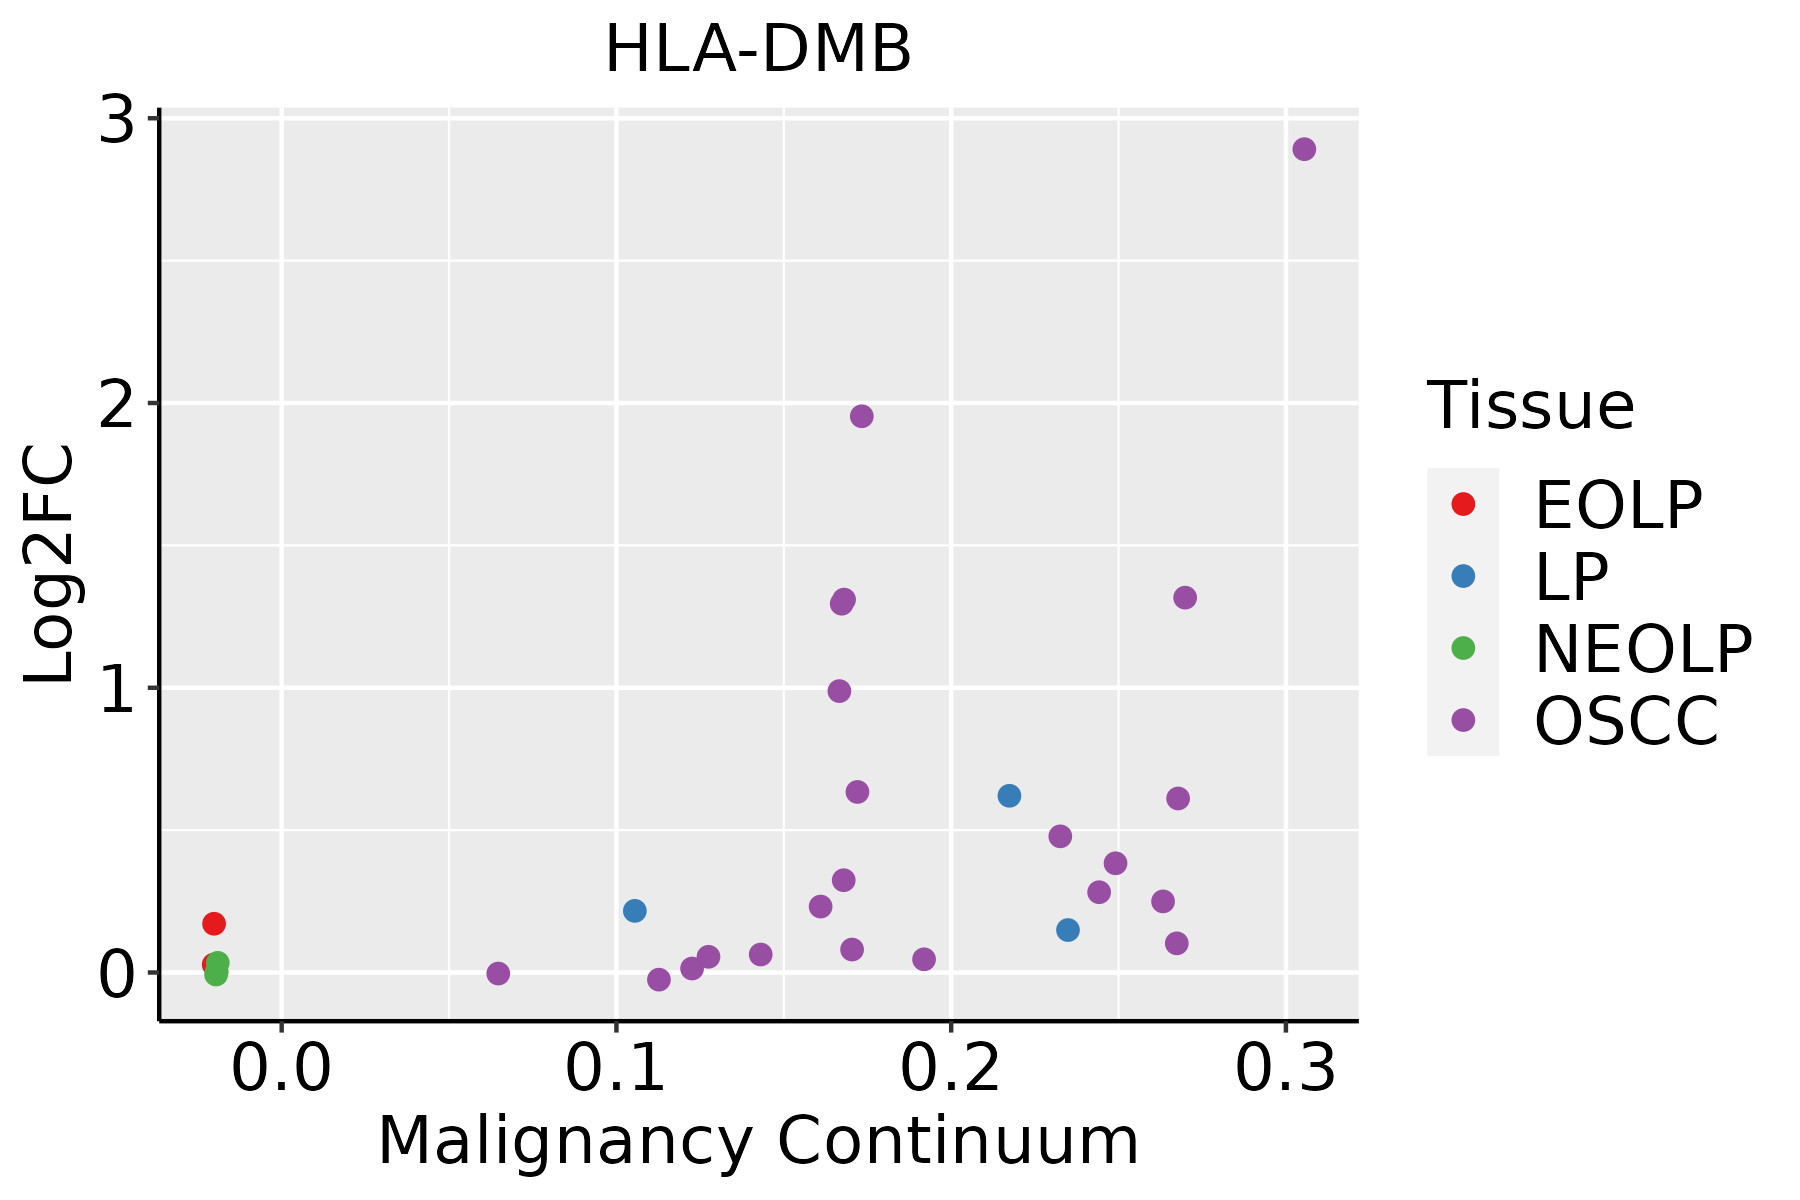 | EOLP: Erosive Oral lichen planus |
| LP: leukoplakia | ||
| NEOLP: Non-erosive oral lichen planus | ||
| OSCC: Oral squamous cell carcinoma | ||
| Thyroid |  | ATC: Anaplastic thyroid cancer |
| HT: Hashimoto's thyroiditis | ||
| PTC: Papillary thyroid cancer |
| ∗log2FC in expression of this searched gene in stem-like cells from each diseased tissue sample relative to stem-like cells in normal samples in each tissue plotted against the malignancy continuum. Samples are colored based on if they are from different disease stage. |
Top |
Malignant transformation related pathway analysis |
| Find out the enriched GO biological processes and KEGG pathways involved in transition from healthy to precancer to cancer |
| Tissue | Disease Stage | Enriched GO biological Processes |
| Colorectum | AD |  |
| Colorectum | SER |  |
| Colorectum | MSS |  |
| Colorectum | MSI-H |  |
| Colorectum | FAP |  |
| ∗Top 15 enriched GO BP terms are showed in the bar plot of each disease state in each tissue. Each row represents a significant GO biological process which is colored according to the -log10(p.adjust). |
| Page: 1 2 3 4 5 6 7 8 9 |
| GO ID | Tissue | Disease Stage | Description | Gene Ratio | Bg Ratio | pvalue | p.adjust | Count |
| GO:004800222 | Breast | DCIS | antigen processing and presentation of peptide antigen | 20/1390 | 62/18723 | 1.01e-08 | 7.56e-07 | 20 |
| GO:000247822 | Breast | DCIS | antigen processing and presentation of exogenous peptide antigen | 15/1390 | 38/18723 | 3.22e-08 | 2.09e-06 | 15 |
| GO:000250122 | Breast | DCIS | peptide antigen assembly with MHC protein complex | 10/1390 | 18/18723 | 1.24e-07 | 6.50e-06 | 10 |
| GO:000239621 | Breast | DCIS | MHC protein complex assembly | 10/1390 | 19/18723 | 2.45e-07 | 1.19e-05 | 10 |
| GO:000249513 | Breast | DCIS | antigen processing and presentation of peptide antigen via MHC class II | 13/1390 | 34/18723 | 4.17e-07 | 1.87e-05 | 13 |
| GO:000239912 | Breast | DCIS | MHC class II protein complex assembly | 9/1390 | 16/18723 | 4.73e-07 | 2.09e-05 | 9 |
| GO:000250312 | Breast | DCIS | peptide antigen assembly with MHC class II protein complex | 9/1390 | 16/18723 | 4.73e-07 | 2.09e-05 | 9 |
| GO:001988621 | Breast | DCIS | antigen processing and presentation of exogenous peptide antigen via MHC class II | 12/1390 | 30/18723 | 6.56e-07 | 2.79e-05 | 12 |
| GO:001988422 | Breast | DCIS | antigen processing and presentation of exogenous antigen | 15/1390 | 47/18723 | 8.26e-07 | 3.39e-05 | 15 |
| GO:000250413 | Breast | DCIS | antigen processing and presentation of peptide or polysaccharide antigen via MHC class II | 13/1390 | 36/18723 | 9.02e-07 | 3.65e-05 | 13 |
| GO:004578524 | Breast | DCIS | positive regulation of cell adhesion | 60/1390 | 437/18723 | 2.69e-06 | 9.24e-05 | 60 |
| GO:004211021 | Breast | DCIS | T cell activation | 65/1390 | 487/18723 | 2.78e-06 | 9.42e-05 | 65 |
| GO:001988214 | Breast | DCIS | antigen processing and presentation | 22/1390 | 106/18723 | 8.76e-06 | 2.38e-04 | 22 |
| GO:005087021 | Breast | DCIS | positive regulation of T cell activation | 35/1390 | 216/18723 | 9.83e-06 | 2.60e-04 | 35 |
| GO:005086321 | Breast | DCIS | regulation of T cell activation | 47/1390 | 329/18723 | 1.12e-05 | 2.92e-04 | 47 |
| GO:000715921 | Breast | DCIS | leukocyte cell-cell adhesion | 50/1390 | 371/18723 | 2.95e-05 | 6.55e-04 | 50 |
| GO:190303921 | Breast | DCIS | positive regulation of leukocyte cell-cell adhesion | 36/1390 | 239/18723 | 3.77e-05 | 8.07e-04 | 36 |
| GO:190303721 | Breast | DCIS | regulation of leukocyte cell-cell adhesion | 46/1390 | 336/18723 | 4.11e-05 | 8.74e-04 | 46 |
| GO:002240722 | Breast | DCIS | regulation of cell-cell adhesion | 56/1390 | 448/18723 | 8.53e-05 | 1.61e-03 | 56 |
| GO:002240921 | Breast | DCIS | positive regulation of cell-cell adhesion | 39/1390 | 284/18723 | 1.44e-04 | 2.45e-03 | 39 |
| Page: 1 2 3 4 5 |
| Pathway ID | Tissue | Disease Stage | Description | Gene Ratio | Bg Ratio | pvalue | p.adjust | qvalue | Count |
| hsa0516941 | Breast | DCIS | Epstein-Barr virus infection | 46/846 | 202/8465 | 5.60e-08 | 1.13e-06 | 8.33e-07 | 46 |
| hsa0461242 | Breast | DCIS | Antigen processing and presentation | 25/846 | 78/8465 | 6.75e-08 | 1.28e-06 | 9.45e-07 | 25 |
| hsa0414541 | Breast | DCIS | Phagosome | 35/846 | 152/8465 | 1.67e-06 | 2.45e-05 | 1.81e-05 | 35 |
| hsa0541642 | Breast | DCIS | Viral myocarditis | 19/846 | 60/8465 | 3.12e-06 | 4.20e-05 | 3.09e-05 | 19 |
| hsa0516642 | Breast | DCIS | Human T-cell leukemia virus 1 infection | 41/846 | 222/8465 | 7.03e-05 | 6.88e-04 | 5.07e-04 | 41 |
| hsa0494021 | Breast | DCIS | Type I diabetes mellitus | 13/846 | 43/8465 | 1.91e-04 | 1.72e-03 | 1.27e-03 | 13 |
| hsa0533021 | Breast | DCIS | Allograft rejection | 12/846 | 38/8465 | 2.13e-04 | 1.86e-03 | 1.37e-03 | 12 |
| hsa0532341 | Breast | DCIS | Rheumatoid arthritis | 21/846 | 93/8465 | 2.64e-04 | 2.24e-03 | 1.65e-03 | 21 |
| hsa0533221 | Breast | DCIS | Graft-versus-host disease | 12/846 | 42/8465 | 5.98e-04 | 4.49e-03 | 3.31e-03 | 12 |
| hsa0514021 | Breast | DCIS | Leishmaniasis | 17/846 | 77/8465 | 1.29e-03 | 9.06e-03 | 6.67e-03 | 17 |
| hsa053106 | Breast | DCIS | Asthma | 9/846 | 31/8465 | 2.53e-03 | 1.63e-02 | 1.20e-02 | 9 |
| hsa05150 | Breast | DCIS | Staphylococcus aureus infection | 19/846 | 96/8465 | 2.68e-03 | 1.67e-02 | 1.23e-02 | 19 |
| hsa0532021 | Breast | DCIS | Autoimmune thyroid disease | 12/846 | 53/8465 | 5.17e-03 | 2.69e-02 | 1.98e-02 | 12 |
| hsa046724 | Breast | DCIS | Intestinal immune network for IgA production | 11/846 | 49/8465 | 7.79e-03 | 3.60e-02 | 2.65e-02 | 11 |
| hsa0516951 | Breast | DCIS | Epstein-Barr virus infection | 46/846 | 202/8465 | 5.60e-08 | 1.13e-06 | 8.33e-07 | 46 |
| hsa0461252 | Breast | DCIS | Antigen processing and presentation | 25/846 | 78/8465 | 6.75e-08 | 1.28e-06 | 9.45e-07 | 25 |
| hsa0414551 | Breast | DCIS | Phagosome | 35/846 | 152/8465 | 1.67e-06 | 2.45e-05 | 1.81e-05 | 35 |
| hsa0541652 | Breast | DCIS | Viral myocarditis | 19/846 | 60/8465 | 3.12e-06 | 4.20e-05 | 3.09e-05 | 19 |
| hsa0516652 | Breast | DCIS | Human T-cell leukemia virus 1 infection | 41/846 | 222/8465 | 7.03e-05 | 6.88e-04 | 5.07e-04 | 41 |
| hsa0494031 | Breast | DCIS | Type I diabetes mellitus | 13/846 | 43/8465 | 1.91e-04 | 1.72e-03 | 1.27e-03 | 13 |
| Page: 1 2 3 4 |
Top |
Cell-cell communication analysis |
| Identification of potential cell-cell interactions between two cell types and their ligand-receptor pairs for different disease states |
| Ligand | Receptor | LRpair | Pathway | Tissue | Disease Stage |
| HLA-DMB | CD4 | HLA-DMB_CD4 | MHC-II | Breast | DCIS |
| HLA-DMB | CD4 | HLA-DMB_CD4 | MHC-II | Breast | Healthy |
| HLA-DMB | CD4 | HLA-DMB_CD4 | MHC-II | Breast | IDC |
| HLA-DMB | CD4 | HLA-DMB_CD4 | MHC-II | Cervix | ADJ |
| HLA-DMB | CD4 | HLA-DMB_CD4 | MHC-II | Cervix | CC |
| HLA-DMB | CD4 | HLA-DMB_CD4 | MHC-II | Cervix | Healthy |
| HLA-DMB | CD4 | HLA-DMB_CD4 | MHC-II | Cervix | Precancer |
| HLA-DMB | CD4 | HLA-DMB_CD4 | MHC-II | CRC | AD |
| HLA-DMB | CD4 | HLA-DMB_CD4 | MHC-II | CRC | ADJ |
| HLA-DMB | CD4 | HLA-DMB_CD4 | MHC-II | CRC | MSI-H |
| HLA-DMB | CD4 | HLA-DMB_CD4 | MHC-II | CRC | SER |
| HLA-DMB | CD4 | HLA-DMB_CD4 | MHC-II | Endometrium | ADJ |
| HLA-DMB | CD4 | HLA-DMB_CD4 | MHC-II | Endometrium | AEH |
| HLA-DMB | CD4 | HLA-DMB_CD4 | MHC-II | Endometrium | EEC |
| HLA-DMB | CD4 | HLA-DMB_CD4 | MHC-II | Endometrium | Healthy |
| HLA-DMB | CD4 | HLA-DMB_CD4 | MHC-II | HNSCC | ADJ |
| HLA-DMB | CD4 | HLA-DMB_CD4 | MHC-II | HNSCC | Healthy |
| HLA-DMB | CD4 | HLA-DMB_CD4 | MHC-II | HNSCC | OSCC |
| HLA-DMB | CD4 | HLA-DMB_CD4 | MHC-II | HNSCC | Precancer |
| HLA-DMB | CD4 | HLA-DMB_CD4 | MHC-II | Liver | HCC |
| Page: 1 2 |
Top |
Single-cell gene regulatory network inference analysis |
| Find out the significant the regulons (TFs) and the target genes of each regulon across cell types for different disease states |
| TF | Cell Type | Tissue | Disease Stage | Target Gene | RSS | Regulon Activity |
| ∗The dot plots of a searched regulon are shown for all cell subpopulations in each disease state of each tissue based on the regulon specific score inferred using pySCENIC and by calculating the average expression. |
| Page: 1 |
Top |
Somatic mutation of malignant transformation related genes |
| Annotation of somatic variants for genes involved in malignant transformation |
| Hugo Symbol | Variant Class | Variant Classification | dbSNP RS | HGVSc | HGVSp | HGVSp Short | SWISSPROT | BIOTYPE | SIFT | PolyPhen | Tumor Sample Barcode | Tissue | Histology | Sex | Age | Stage | Therapy Types | Drugs | Outcome |
| HLA-DMB | SNV | Missense_Mutation | c.621N>C | p.Trp207Cys | p.W207C | P28068 | protein_coding | deleterious(0) | probably_damaging(0.99) | TCGA-E2-A10C-01 | Breast | breast invasive carcinoma | Female | <65 | I/II | Chemotherapy | cytoxan | SD | |
| HLA-DMB | SNV | Missense_Mutation | c.542C>A | p.Ala181Asp | p.A181D | P28068 | protein_coding | deleterious(0.02) | probably_damaging(0.934) | TCGA-E2-A14R-01 | Breast | breast invasive carcinoma | Female | <65 | I/II | Chemotherapy | doxorubicin | PD | |
| HLA-DMB | deletion | Frame_Shift_Del | novel | c.590delN | p.Thr197MetfsTer21 | p.T197Mfs*21 | P28068 | protein_coding | TCGA-D8-A27V-01 | Breast | breast invasive carcinoma | Female | <65 | I/II | Hormone Therapy | tamoxiphen | SD | ||
| HLA-DMB | SNV | Missense_Mutation | c.492G>C | p.Lys164Asn | p.K164N | P28068 | protein_coding | tolerated(0.34) | benign(0.082) | TCGA-DR-A0ZM-01 | Cervix | cervical & endocervical cancer | Female | <65 | III/IV | Unspecific | Cisplatin | SD | |
| HLA-DMB | SNV | Missense_Mutation | c.496G>T | p.Ala166Ser | p.A166S | P28068 | protein_coding | tolerated(0.08) | benign(0.061) | TCGA-EX-A1H5-01 | Cervix | cervical & endocervical cancer | Female | <65 | I/II | Unknown | Unknown | SD | |
| HLA-DMB | SNV | Missense_Mutation | c.529N>T | p.Leu177Phe | p.L177F | P28068 | protein_coding | tolerated(0.23) | benign(0.244) | TCGA-AA-3713-01 | Colorectum | colon adenocarcinoma | Male | >=65 | III/IV | Chemotherapy | 5-fluorouracil | PR | |
| HLA-DMB | SNV | Missense_Mutation | novel | c.350N>C | p.Val117Ala | p.V117A | P28068 | protein_coding | tolerated(0.07) | probably_damaging(0.999) | TCGA-AA-3811-01 | Colorectum | colon adenocarcinoma | Female | >=65 | III/IV | Unknown | Unknown | PD |
| HLA-DMB | SNV | Missense_Mutation | c.250N>T | p.Asp84Tyr | p.D84Y | P28068 | protein_coding | deleterious(0.01) | possibly_damaging(0.693) | TCGA-CA-6717-01 | Colorectum | colon adenocarcinoma | Male | <65 | I/II | Chemotherapy | oxaliplatin | CR | |
| HLA-DMB | SNV | Missense_Mutation | rs12176347 | c.218C>T | p.Ala73Val | p.A73V | P28068 | protein_coding | deleterious(0) | probably_damaging(0.927) | TCGA-G4-6628-01 | Colorectum | colon adenocarcinoma | Male | >=65 | I/II | Unknown | Unknown | SD |
| HLA-DMB | SNV | Missense_Mutation | novel | c.174N>T | p.Glu58Asp | p.E58D | P28068 | protein_coding | tolerated(0.5) | benign(0.025) | TCGA-AG-A002-01 | Colorectum | rectum adenocarcinoma | Male | <65 | I/II | Unknown | Unknown | SD |
| Page: 1 2 3 |
Top |
Related drugs of malignant transformation related genes |
| Identification of chemicals and drugs interact with genes involved in malignant transfromation |
| (DGIdb 4.0) |
| Entrez ID | Symbol | Category | Interaction Types | Drug Claim Name | Drug Name | PMIDs |
| Page: 1 |

Copyright 2023-Present -The University of Texas Health Science Center at Houston |