
|
|||||
|
 | |
| |
| |
| |
| |
| |
|
Gene: HKR1 |
Gene summary for HKR1 |
| Gene information | Species | Human | Gene symbol | HKR1 | Gene ID | 284459 |
| Gene name | zinc finger protein 875 | |
| Gene Alias | HKR1 | |
| Cytomap | 19q13.12 | |
| Gene Type | protein-coding | GO ID | GO:0000122 | UniProtAcc | K7EPW3 |
Top |
Malignant transformation analysis |
| Identification of the aberrant gene expression in precancerous and cancerous lesions by comparing the gene expression of stem-like cells in diseased tissues with normal stem cells |
| Entrez ID | Symbol | Replicates | Species | Organ | Tissue | Adj P-value | Log2FC | Malignancy |
| 284459 | HKR1 | AEH-subject1 | Human | Endometrium | AEH | 7.85e-04 | -1.32e-01 | -0.3059 |
| 284459 | HKR1 | AEH-subject2 | Human | Endometrium | AEH | 6.38e-09 | -1.32e-01 | -0.2525 |
| 284459 | HKR1 | AEH-subject3 | Human | Endometrium | AEH | 3.51e-03 | -1.32e-01 | -0.2576 |
| 284459 | HKR1 | AEH-subject4 | Human | Endometrium | AEH | 2.33e-06 | -1.32e-01 | -0.2657 |
| 284459 | HKR1 | AEH-subject5 | Human | Endometrium | AEH | 3.51e-03 | -1.32e-01 | -0.2953 |
| 284459 | HKR1 | EEC-subject1 | Human | Endometrium | EEC | 1.75e-04 | -1.32e-01 | -0.2682 |
| 284459 | HKR1 | EEC-subject2 | Human | Endometrium | EEC | 1.66e-03 | -1.32e-01 | -0.2607 |
| 284459 | HKR1 | EEC-subject3 | Human | Endometrium | EEC | 8.23e-05 | -1.32e-01 | -0.2525 |
| 284459 | HKR1 | EEC-subject4 | Human | Endometrium | EEC | 3.71e-04 | -1.32e-01 | -0.2571 |
| 284459 | HKR1 | EEC-subject5 | Human | Endometrium | EEC | 7.40e-03 | -1.32e-01 | -0.249 |
| 284459 | HKR1 | GSM6177620_NYU_UCEC1_lib1_lib1 | Human | Endometrium | EEC | 2.97e-05 | -4.29e-02 | -0.1869 |
| 284459 | HKR1 | GSM6177620_NYU_UCEC1_lib2_lib2 | Human | Endometrium | EEC | 2.47e-08 | -2.66e-02 | -0.1875 |
| 284459 | HKR1 | GSM6177620_NYU_UCEC1_lib3_lib3 | Human | Endometrium | EEC | 1.64e-06 | -1.18e-01 | -0.1883 |
| 284459 | HKR1 | GSM6177622_NYU_UCEC3_lib1_lib1 | Human | Endometrium | EEC | 3.21e-03 | -8.01e-02 | -0.1917 |
| 284459 | HKR1 | GSM6177622_NYU_UCEC3_lib2_lib2 | Human | Endometrium | EEC | 3.35e-10 | -3.99e-02 | -0.1916 |
| 284459 | HKR1 | PTC01 | Human | Thyroid | PTC | 5.73e-04 | 8.78e-02 | 0.1899 |
| 284459 | HKR1 | PTC03 | Human | Thyroid | PTC | 3.21e-04 | 1.34e-01 | 0.1784 |
| 284459 | HKR1 | PTC04 | Human | Thyroid | PTC | 3.20e-11 | 1.77e-01 | 0.1927 |
| 284459 | HKR1 | PTC05 | Human | Thyroid | PTC | 1.21e-06 | 3.26e-01 | 0.2065 |
| 284459 | HKR1 | PTC06 | Human | Thyroid | PTC | 4.63e-15 | 2.90e-01 | 0.2057 |
| Page: 1 2 |
| Tissue | Expression Dynamics | Abbreviation |
| Endometrium | 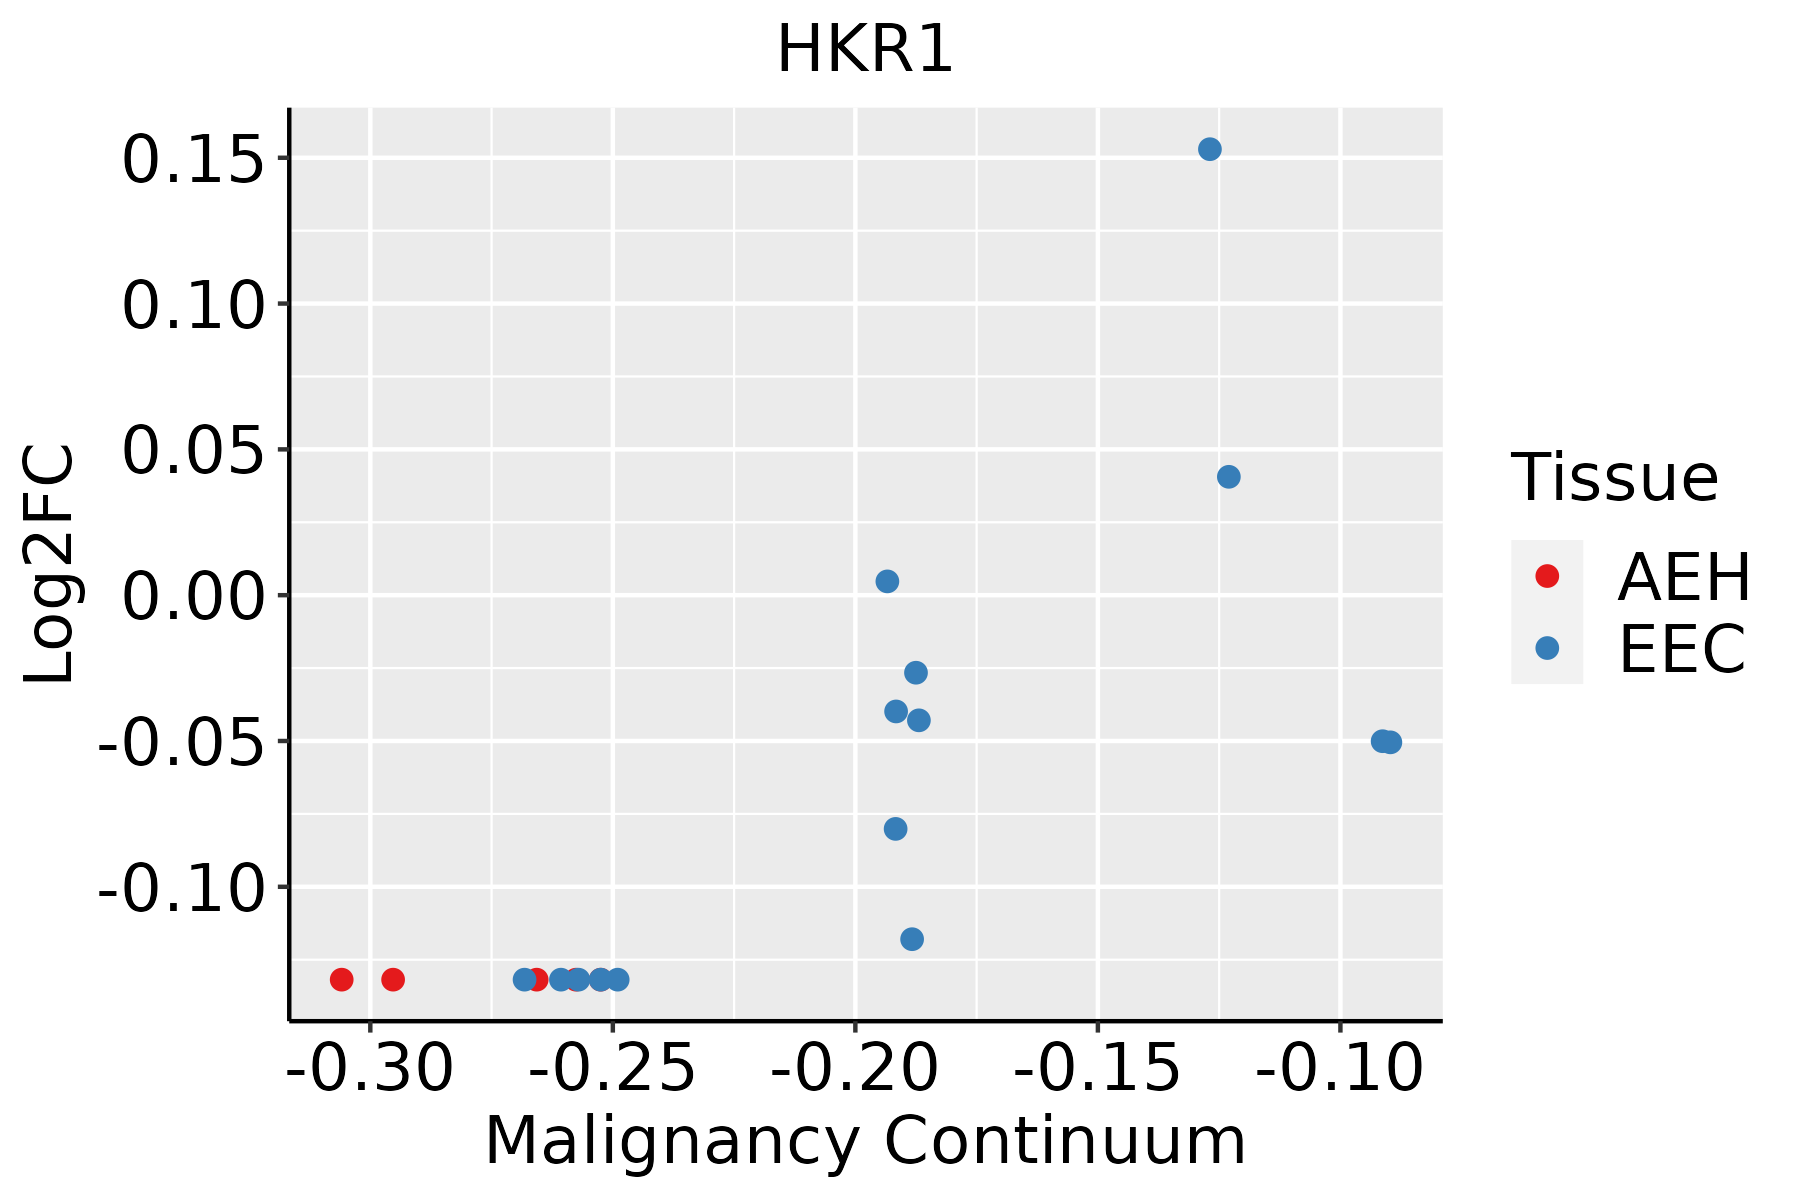 | AEH: Atypical endometrial hyperplasia |
| EEC: Endometrioid Cancer | ||
| Thyroid |  | ATC: Anaplastic thyroid cancer |
| HT: Hashimoto's thyroiditis | ||
| PTC: Papillary thyroid cancer |
| ∗log2FC in expression of this searched gene in stem-like cells from each diseased tissue sample relative to stem-like cells in normal samples in each tissue plotted against the malignancy continuum. Samples are colored based on if they are from different disease stage. |
Top |
Malignant transformation related pathway analysis |
| Find out the enriched GO biological processes and KEGG pathways involved in transition from healthy to precancer to cancer |
| Tissue | Disease Stage | Enriched GO biological Processes |
| Colorectum | AD |  |
| Colorectum | SER |  |
| Colorectum | MSS |  |
| Colorectum | MSI-H |  |
| Colorectum | FAP |  |
| ∗Top 15 enriched GO BP terms are showed in the bar plot of each disease state in each tissue. Each row represents a significant GO biological process which is colored according to the -log10(p.adjust). |
| Page: 1 2 3 4 5 6 7 8 9 |
| GO ID | Tissue | Disease Stage | Description | Gene Ratio | Bg Ratio | pvalue | p.adjust | Count |
| Page: 1 |
| Pathway ID | Tissue | Disease Stage | Description | Gene Ratio | Bg Ratio | pvalue | p.adjust | qvalue | Count |
| Page: 1 |
Top |
Cell-cell communication analysis |
| Identification of potential cell-cell interactions between two cell types and their ligand-receptor pairs for different disease states |
| Ligand | Receptor | LRpair | Pathway | Tissue | Disease Stage |
| Page: 1 |
Top |
Single-cell gene regulatory network inference analysis |
| Find out the significant the regulons (TFs) and the target genes of each regulon across cell types for different disease states |
| TF | Cell Type | Tissue | Disease Stage | Target Gene | RSS | Regulon Activity |
| HKR1 | CD8TEFF | Breast | DCIS | CCR4,AC013264.1,LIMK1, etc. | 1.12e-01 |  |
| ∗The dot plots of a searched regulon are shown for all cell subpopulations in each disease state of each tissue based on the regulon specific score inferred using pySCENIC and by calculating the average expression. |
| Page: 1 |
Top |
Somatic mutation of malignant transformation related genes |
| Annotation of somatic variants for genes involved in malignant transformation |
| Hugo Symbol | Variant Class | Variant Classification | dbSNP RS | HGVSc | HGVSp | HGVSp Short | SWISSPROT | BIOTYPE | SIFT | PolyPhen | Tumor Sample Barcode | Tissue | Histology | Sex | Age | Stage | Therapy Types | Drugs | Outcome |
| HKR1 | SNV | Missense_Mutation | novel | c.362N>A | p.Ser121Tyr | p.S121Y | P10072 | protein_coding | deleterious(0.05) | benign(0.282) | TCGA-A2-A0EV-01 | Breast | breast invasive carcinoma | Female | >=65 | I/II | Unknown | Unknown | SD |
| HKR1 | SNV | Missense_Mutation | c.1738N>T | p.Val580Leu | p.V580L | P10072 | protein_coding | tolerated(0.11) | benign(0.017) | TCGA-A8-A09A-01 | Breast | breast invasive carcinoma | Female | <65 | I/II | Hormone Therapy | tamoxiphen | SD | |
| HKR1 | SNV | Missense_Mutation | rs749025886 | c.532N>A | p.Glu178Lys | p.E178K | P10072 | protein_coding | tolerated(0.08) | benign(0.058) | TCGA-AN-A046-01 | Breast | breast invasive carcinoma | Female | >=65 | I/II | Unknown | Unknown | SD |
| HKR1 | SNV | Missense_Mutation | c.1550G>T | p.Arg517Met | p.R517M | P10072 | protein_coding | deleterious(0) | probably_damaging(0.988) | TCGA-AO-A0J9-01 | Breast | breast invasive carcinoma | Female | <65 | III/IV | Chemotherapy | cyclophosphamide | PD | |
| HKR1 | SNV | Missense_Mutation | c.1114N>G | p.Leu372Val | p.L372V | P10072 | protein_coding | tolerated(0.2) | probably_damaging(0.99) | TCGA-C8-A12P-01 | Breast | breast invasive carcinoma | Female | <65 | I/II | Unknown | Unknown | SD | |
| HKR1 | SNV | Missense_Mutation | c.1889N>T | p.Ser630Leu | p.S630L | P10072 | protein_coding | deleterious(0.01) | benign(0.439) | TCGA-C8-A12P-01 | Breast | breast invasive carcinoma | Female | <65 | I/II | Unknown | Unknown | SD | |
| HKR1 | SNV | Missense_Mutation | rs375294602 | c.1523G>A | p.Arg508Gln | p.R508Q | P10072 | protein_coding | tolerated(1) | benign(0.01) | TCGA-C8-A26X-01 | Breast | breast invasive carcinoma | Female | <65 | I/II | Chemotherapy | 5-fluorouracil | CR |
| HKR1 | SNV | Missense_Mutation | c.325G>C | p.Glu109Gln | p.E109Q | P10072 | protein_coding | deleterious(0.03) | benign(0.329) | TCGA-D8-A1J8-01 | Breast | breast invasive carcinoma | Female | >=65 | I/II | Hormone Therapy | nolvadex | SD | |
| HKR1 | SNV | Missense_Mutation | c.1232N>G | p.Lys411Arg | p.K411R | P10072 | protein_coding | deleterious(0.04) | possibly_damaging(0.763) | TCGA-DS-A0VK-01 | Cervix | cervical & endocervical cancer | Female | <65 | I/II | Chemotherapy | carboplatin | PD | |
| HKR1 | SNV | Missense_Mutation | novel | c.1643C>T | p.Ser548Leu | p.S548L | P10072 | protein_coding | deleterious(0.03) | benign(0.411) | TCGA-MY-A913-01 | Cervix | cervical & endocervical cancer | Female | <65 | I/II | Chemotherapy | cisplatin | CR |
| Page: 1 2 3 4 5 6 7 8 |
Top |
Related drugs of malignant transformation related genes |
| Identification of chemicals and drugs interact with genes involved in malignant transfromation |
| (DGIdb 4.0) |
| Entrez ID | Symbol | Category | Interaction Types | Drug Claim Name | Drug Name | PMIDs |
| Page: 1 |

Copyright 2023-Present -The University of Texas Health Science Center at Houston |