
|
|||||
|
 | |
| |
| |
| |
| |
| |
|
Gene: HK2 |
Gene summary for HK2 |
| Gene information | Species | Human | Gene symbol | HK2 | Gene ID | 3099 |
| Gene name | hexokinase 2 | |
| Gene Alias | HKII | |
| Cytomap | 2p12 | |
| Gene Type | protein-coding | GO ID | GO:0000422 | UniProtAcc | P52789 |
Top |
Malignant transformation analysis |
| Identification of the aberrant gene expression in precancerous and cancerous lesions by comparing the gene expression of stem-like cells in diseased tissues with normal stem cells |
| Entrez ID | Symbol | Replicates | Species | Organ | Tissue | Adj P-value | Log2FC | Malignancy |
| 3099 | HK2 | GSM4909292 | Human | Breast | IDC | 1.24e-04 | 6.60e-01 | 0.1236 |
| 3099 | HK2 | GSM4909311 | Human | Breast | IDC | 7.03e-03 | -1.01e-01 | 0.1534 |
| 3099 | HK2 | GSM4909319 | Human | Breast | IDC | 1.98e-05 | -1.14e-01 | 0.1563 |
| 3099 | HK2 | GSM4909321 | Human | Breast | IDC | 3.51e-04 | -1.22e-01 | 0.1559 |
| 3099 | HK2 | ctrl6 | Human | Breast | Precancer | 4.62e-21 | 7.37e-01 | -0.0061 |
| 3099 | HK2 | brca1 | Human | Breast | Precancer | 1.01e-02 | -1.06e-01 | -0.0338 |
| 3099 | HK2 | brca10 | Human | Breast | Precancer | 1.02e-09 | 3.83e-01 | -0.0029 |
| 3099 | HK2 | DCIS2 | Human | Breast | DCIS | 1.28e-06 | -5.50e-02 | 0.0085 |
| 3099 | HK2 | HTA11_3410_2000001011 | Human | Colorectum | AD | 8.95e-04 | -3.41e-01 | 0.0155 |
| 3099 | HK2 | HTA11_347_2000001011 | Human | Colorectum | AD | 2.64e-18 | 8.80e-01 | -0.1954 |
| 3099 | HK2 | HTA11_7696_3000711011 | Human | Colorectum | AD | 1.64e-02 | -2.37e-01 | 0.0674 |
| 3099 | HK2 | A002-C-010 | Human | Colorectum | FAP | 1.31e-02 | -2.41e-01 | 0.242 |
| 3099 | HK2 | A001-C-207 | Human | Colorectum | FAP | 2.03e-02 | -2.83e-01 | 0.1278 |
| 3099 | HK2 | A015-C-203 | Human | Colorectum | FAP | 2.19e-15 | -3.82e-01 | -0.1294 |
| 3099 | HK2 | A002-C-201 | Human | Colorectum | FAP | 2.59e-05 | -2.76e-01 | 0.0324 |
| 3099 | HK2 | A002-C-203 | Human | Colorectum | FAP | 3.18e-03 | -1.99e-01 | 0.2786 |
| 3099 | HK2 | A001-C-119 | Human | Colorectum | FAP | 4.82e-06 | -3.84e-01 | -0.1557 |
| 3099 | HK2 | A001-C-108 | Human | Colorectum | FAP | 2.56e-10 | -3.00e-01 | -0.0272 |
| 3099 | HK2 | A002-C-205 | Human | Colorectum | FAP | 1.28e-11 | -4.02e-01 | -0.1236 |
| 3099 | HK2 | A001-C-104 | Human | Colorectum | FAP | 6.08e-09 | -3.38e-01 | 0.0184 |
| Page: 1 2 3 4 5 6 |
| Tissue | Expression Dynamics | Abbreviation |
| Breast |  | IDC: Invasive ductal carcinoma |
| DCIS: Ductal carcinoma in situ | ||
| Precancer(BRCA1-mut): Precancerous lesion from BRCA1 mutation carriers | ||
| Colorectum (GSE201348) |  | FAP: Familial adenomatous polyposis |
| CRC: Colorectal cancer | ||
| Colorectum (HTA11) |  | AD: Adenomas |
| SER: Sessile serrated lesions | ||
| MSI-H: Microsatellite-high colorectal cancer | ||
| MSS: Microsatellite stable colorectal cancer | ||
| Esophagus | 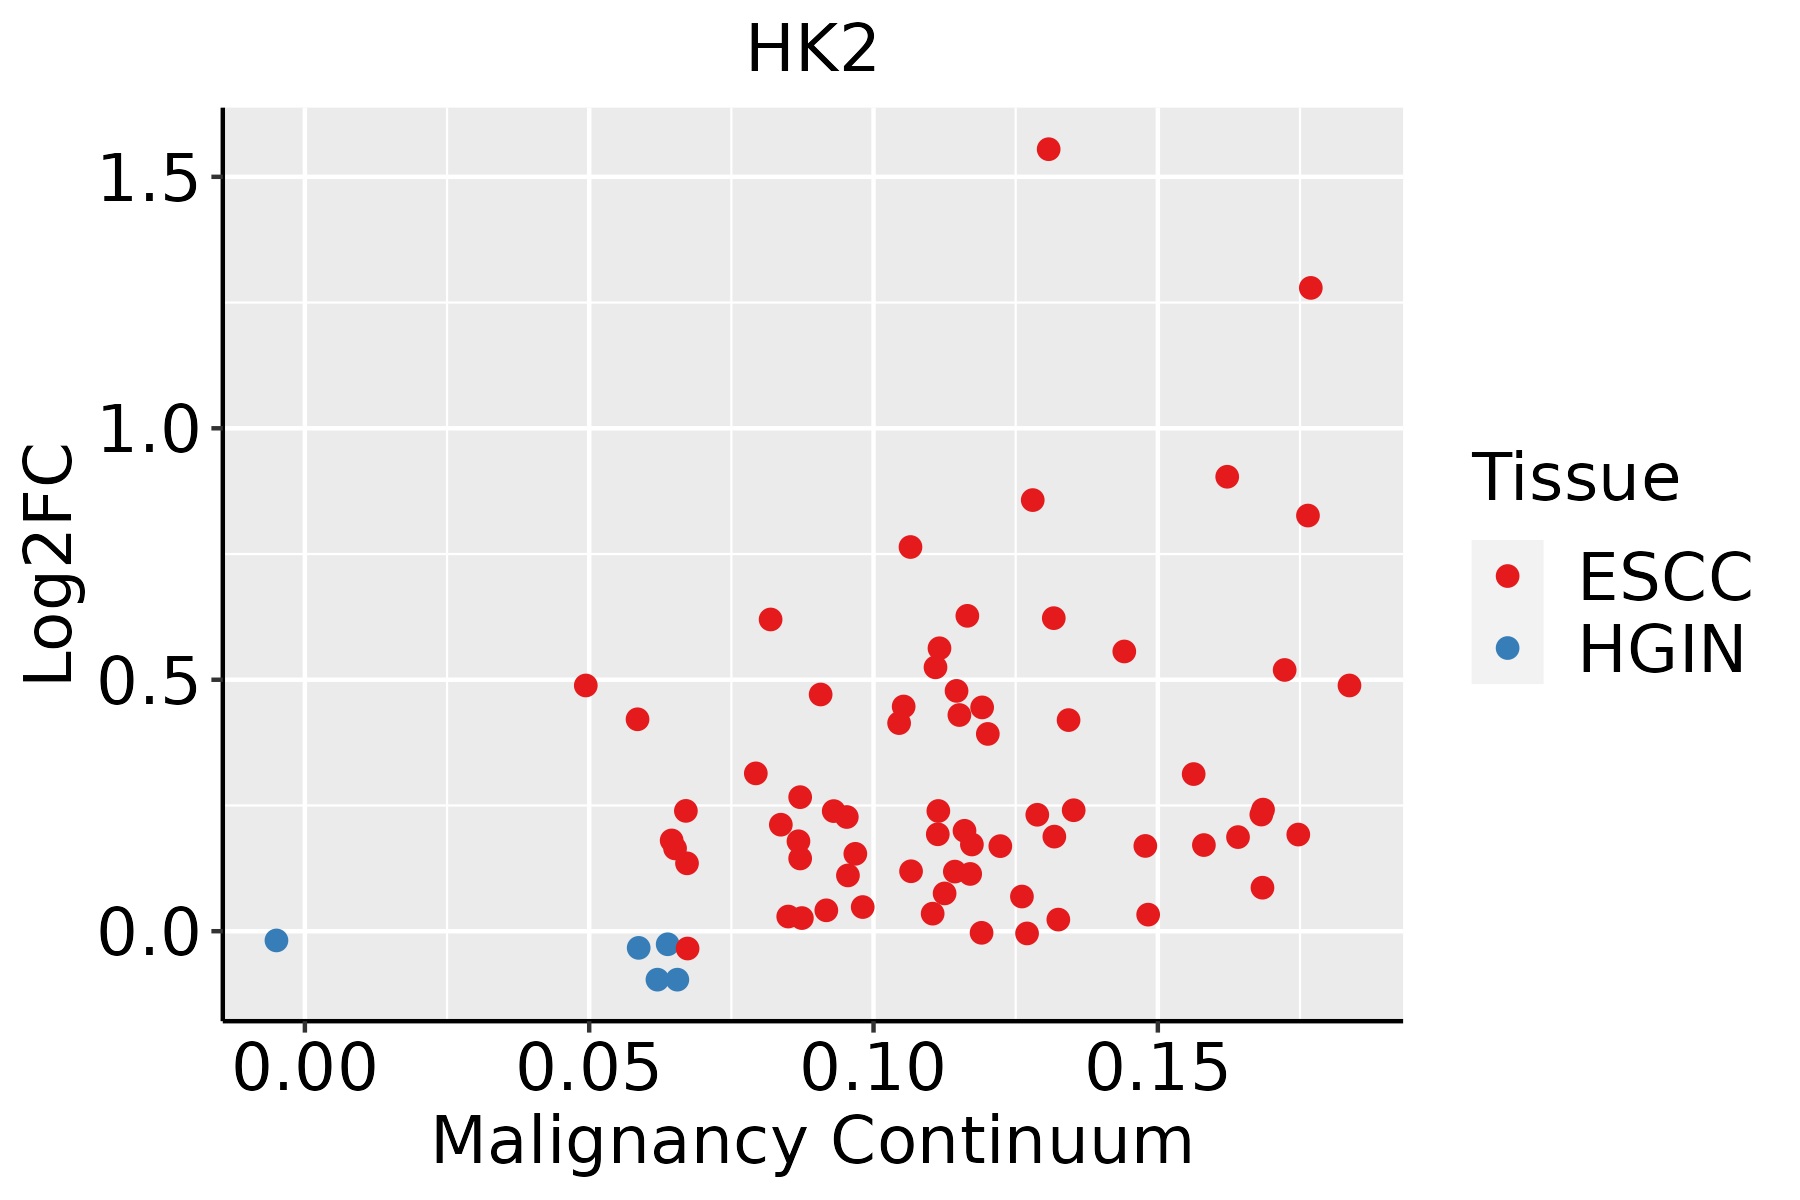 | ESCC: Esophageal squamous cell carcinoma |
| HGIN: High-grade intraepithelial neoplasias | ||
| LGIN: Low-grade intraepithelial neoplasias | ||
| Lung | 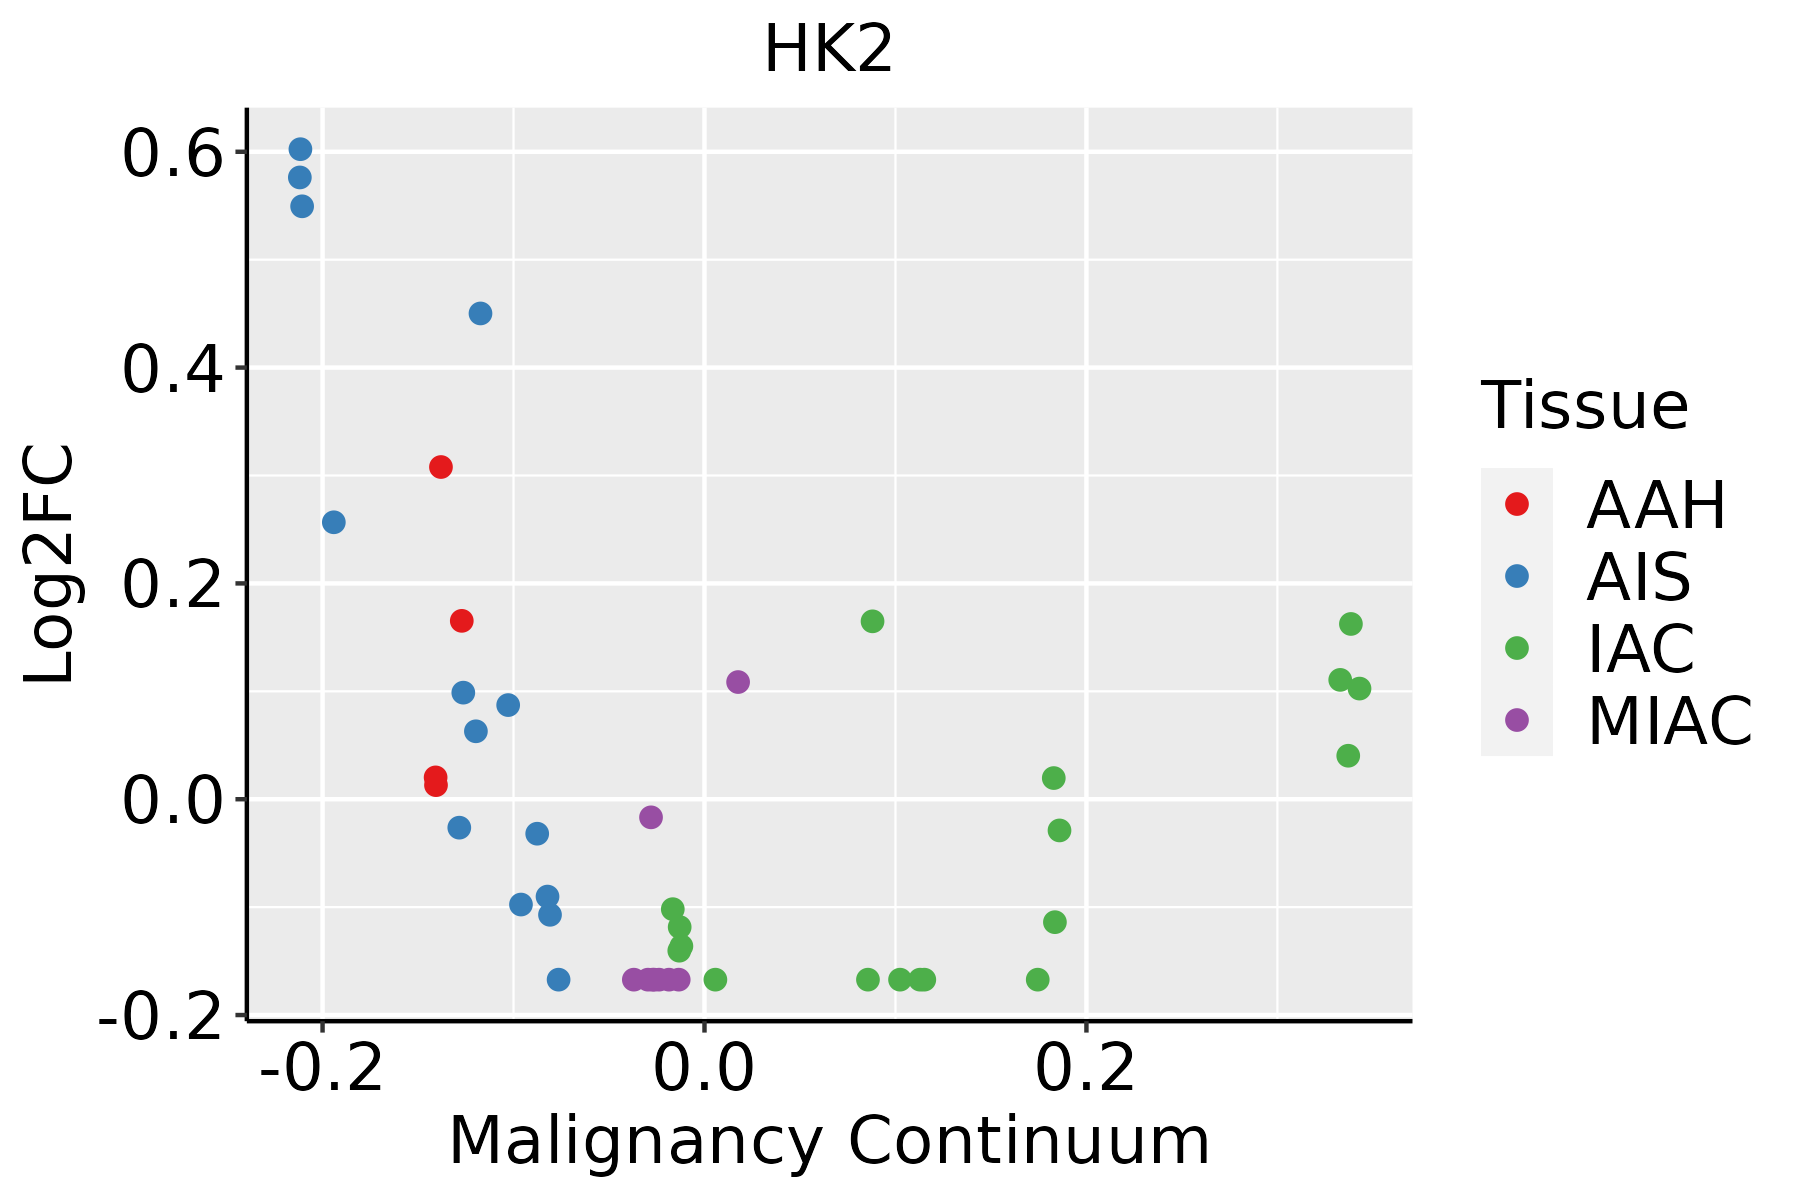 | AAH: Atypical adenomatous hyperplasia |
| AIS: Adenocarcinoma in situ | ||
| IAC: Invasive lung adenocarcinoma | ||
| MIA: Minimally invasive adenocarcinoma | ||
| Oral Cavity | 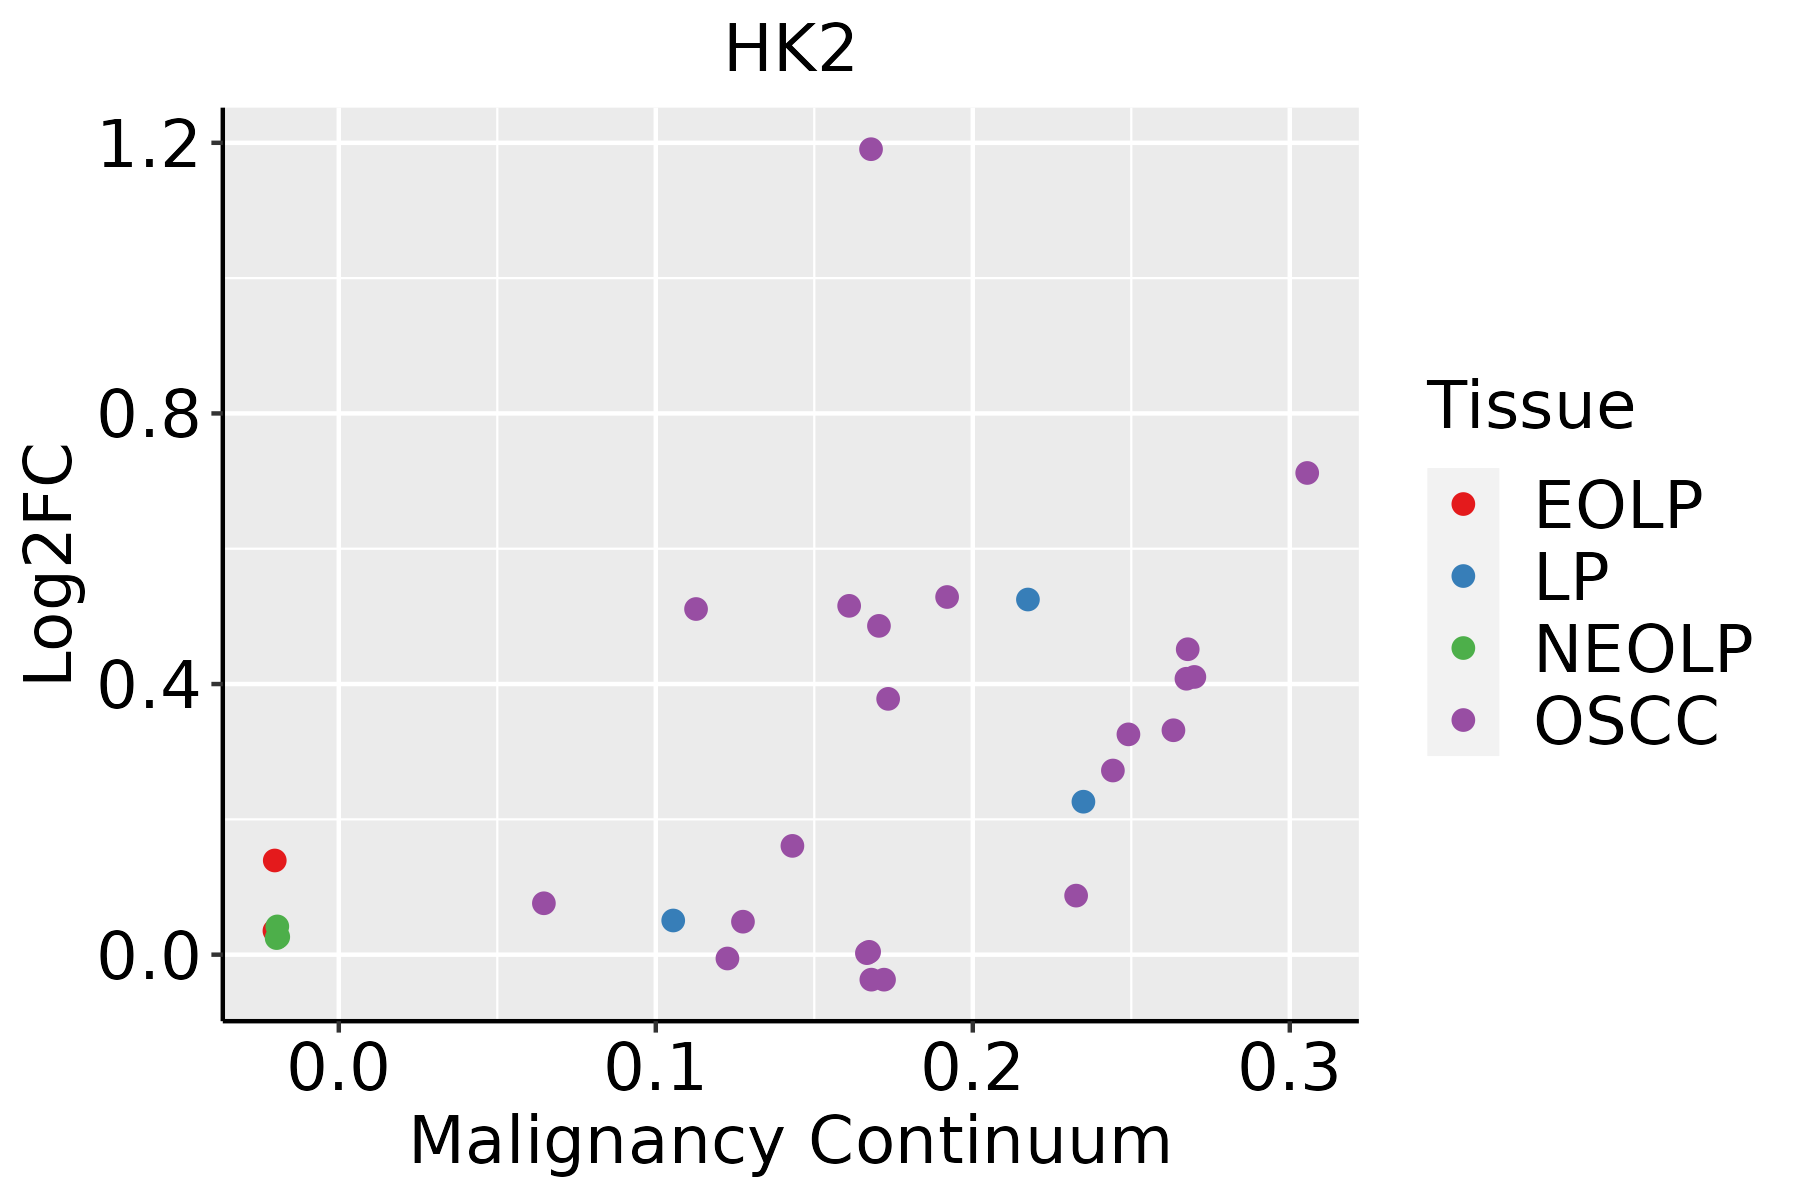 | EOLP: Erosive Oral lichen planus |
| LP: leukoplakia | ||
| NEOLP: Non-erosive oral lichen planus | ||
| OSCC: Oral squamous cell carcinoma | ||
| Thyroid |  | ATC: Anaplastic thyroid cancer |
| HT: Hashimoto's thyroiditis | ||
| PTC: Papillary thyroid cancer |
| ∗log2FC in expression of this searched gene in stem-like cells from each diseased tissue sample relative to stem-like cells in normal samples in each tissue plotted against the malignancy continuum. Samples are colored based on if they are from different disease stage. |
Top |
Malignant transformation related pathway analysis |
| Find out the enriched GO biological processes and KEGG pathways involved in transition from healthy to precancer to cancer |
| Tissue | Disease Stage | Enriched GO biological Processes |
| Colorectum | AD |  |
| Colorectum | SER |  |
| Colorectum | MSS |  |
| Colorectum | MSI-H |  |
| Colorectum | FAP |  |
| ∗Top 15 enriched GO BP terms are showed in the bar plot of each disease state in each tissue. Each row represents a significant GO biological process which is colored according to the -log10(p.adjust). |
| Page: 1 2 3 4 5 6 7 8 9 |
| GO ID | Tissue | Disease Stage | Description | Gene Ratio | Bg Ratio | pvalue | p.adjust | Count |
| GO:00460349 | Breast | Precancer | ATP metabolic process | 82/1080 | 277/18723 | 1.94e-36 | 5.19e-33 | 82 |
| GO:00060918 | Breast | Precancer | generation of precursor metabolites and energy | 94/1080 | 490/18723 | 1.54e-25 | 1.64e-22 | 94 |
| GO:00362939 | Breast | Precancer | response to decreased oxygen levels | 53/1080 | 322/18723 | 4.09e-12 | 6.84e-10 | 53 |
| GO:00016669 | Breast | Precancer | response to hypoxia | 51/1080 | 307/18723 | 7.33e-12 | 1.11e-09 | 51 |
| GO:00704829 | Breast | Precancer | response to oxygen levels | 55/1080 | 347/18723 | 7.47e-12 | 1.11e-09 | 55 |
| GO:00068398 | Breast | Precancer | mitochondrial transport | 45/1080 | 254/18723 | 1.37e-11 | 1.88e-09 | 45 |
| GO:00086378 | Breast | Precancer | apoptotic mitochondrial changes | 23/1080 | 107/18723 | 3.44e-08 | 2.12e-06 | 23 |
| GO:00196938 | Breast | Precancer | ribose phosphate metabolic process | 49/1080 | 396/18723 | 3.81e-07 | 1.78e-05 | 49 |
| GO:00091509 | Breast | Precancer | purine ribonucleotide metabolic process | 46/1080 | 368/18723 | 6.47e-07 | 2.71e-05 | 46 |
| GO:00091179 | Breast | Precancer | nucleotide metabolic process | 56/1080 | 489/18723 | 7.40e-07 | 3.00e-05 | 56 |
| GO:00092598 | Breast | Precancer | ribonucleotide metabolic process | 47/1080 | 385/18723 | 9.69e-07 | 3.84e-05 | 47 |
| GO:00469398 | Breast | Precancer | nucleotide phosphorylation | 20/1080 | 101/18723 | 1.07e-06 | 4.18e-05 | 20 |
| GO:00067539 | Breast | Precancer | nucleoside phosphate metabolic process | 56/1080 | 497/18723 | 1.24e-06 | 4.70e-05 | 56 |
| GO:00451859 | Breast | Precancer | maintenance of protein location | 19/1080 | 94/18723 | 1.43e-06 | 5.35e-05 | 19 |
| GO:00061639 | Breast | Precancer | purine nucleotide metabolic process | 47/1080 | 396/18723 | 2.14e-06 | 7.50e-05 | 47 |
| GO:00091858 | Breast | Precancer | ribonucleoside diphosphate metabolic process | 20/1080 | 106/18723 | 2.37e-06 | 8.17e-05 | 20 |
| GO:00060968 | Breast | Precancer | glycolytic process | 17/1080 | 81/18723 | 2.94e-06 | 9.73e-05 | 17 |
| GO:00061658 | Breast | Precancer | nucleoside diphosphate phosphorylation | 19/1080 | 99/18723 | 3.23e-06 | 1.05e-04 | 19 |
| GO:00067578 | Breast | Precancer | ATP generation from ADP | 17/1080 | 82/18723 | 3.52e-06 | 1.13e-04 | 17 |
| GO:00512358 | Breast | Precancer | maintenance of location | 40/1080 | 327/18723 | 5.85e-06 | 1.71e-04 | 40 |
| Page: 1 2 3 4 5 6 7 8 9 10 11 12 13 14 15 16 17 18 19 20 21 22 23 24 25 26 27 28 29 |
| Pathway ID | Tissue | Disease Stage | Description | Gene Ratio | Bg Ratio | pvalue | p.adjust | qvalue | Count |
| hsa0513118 | Breast | Precancer | Shigellosis | 44/684 | 247/8465 | 3.91e-07 | 6.86e-06 | 5.26e-06 | 44 |
| hsa0406616 | Breast | Precancer | HIF-1 signaling pathway | 23/684 | 109/8465 | 1.51e-05 | 1.59e-04 | 1.22e-04 | 23 |
| hsa0001010 | Breast | Precancer | Glycolysis / Gluconeogenesis | 13/684 | 67/8465 | 2.39e-03 | 1.51e-02 | 1.16e-02 | 13 |
| hsa052309 | Breast | Precancer | Central carbon metabolism in cancer | 13/684 | 70/8465 | 3.57e-03 | 2.17e-02 | 1.66e-02 | 13 |
| hsa0120012 | Breast | Precancer | Carbon metabolism | 18/684 | 115/8465 | 4.79e-03 | 2.75e-02 | 2.11e-02 | 18 |
| hsa0513119 | Breast | Precancer | Shigellosis | 44/684 | 247/8465 | 3.91e-07 | 6.86e-06 | 5.26e-06 | 44 |
| hsa0406617 | Breast | Precancer | HIF-1 signaling pathway | 23/684 | 109/8465 | 1.51e-05 | 1.59e-04 | 1.22e-04 | 23 |
| hsa0001013 | Breast | Precancer | Glycolysis / Gluconeogenesis | 13/684 | 67/8465 | 2.39e-03 | 1.51e-02 | 1.16e-02 | 13 |
| hsa0523012 | Breast | Precancer | Central carbon metabolism in cancer | 13/684 | 70/8465 | 3.57e-03 | 2.17e-02 | 1.66e-02 | 13 |
| hsa0120013 | Breast | Precancer | Carbon metabolism | 18/684 | 115/8465 | 4.79e-03 | 2.75e-02 | 2.11e-02 | 18 |
| hsa0513124 | Breast | IDC | Shigellosis | 47/867 | 247/8465 | 1.78e-05 | 2.00e-04 | 1.49e-04 | 47 |
| hsa0406623 | Breast | IDC | HIF-1 signaling pathway | 22/867 | 109/8465 | 1.36e-03 | 1.00e-02 | 7.50e-03 | 22 |
| hsa0513134 | Breast | IDC | Shigellosis | 47/867 | 247/8465 | 1.78e-05 | 2.00e-04 | 1.49e-04 | 47 |
| hsa0406633 | Breast | IDC | HIF-1 signaling pathway | 22/867 | 109/8465 | 1.36e-03 | 1.00e-02 | 7.50e-03 | 22 |
| hsa0513144 | Breast | DCIS | Shigellosis | 46/846 | 247/8465 | 2.06e-05 | 2.38e-04 | 1.75e-04 | 46 |
| hsa0513154 | Breast | DCIS | Shigellosis | 46/846 | 247/8465 | 2.06e-05 | 2.38e-04 | 1.75e-04 | 46 |
| hsa05131 | Colorectum | AD | Shigellosis | 109/2092 | 247/8465 | 1.09e-11 | 2.44e-10 | 1.55e-10 | 109 |
| hsa01200 | Colorectum | AD | Carbon metabolism | 55/2092 | 115/8465 | 5.53e-08 | 8.42e-07 | 5.37e-07 | 55 |
| hsa00010 | Colorectum | AD | Glycolysis / Gluconeogenesis | 34/2092 | 67/8465 | 3.63e-06 | 4.34e-05 | 2.77e-05 | 34 |
| hsa04066 | Colorectum | AD | HIF-1 signaling pathway | 48/2092 | 109/8465 | 7.25e-06 | 7.84e-05 | 5.00e-05 | 48 |
| Page: 1 2 3 4 5 |
Top |
Cell-cell communication analysis |
| Identification of potential cell-cell interactions between two cell types and their ligand-receptor pairs for different disease states |
| Ligand | Receptor | LRpair | Pathway | Tissue | Disease Stage |
| Page: 1 |
Top |
Single-cell gene regulatory network inference analysis |
| Find out the significant the regulons (TFs) and the target genes of each regulon across cell types for different disease states |
| TF | Cell Type | Tissue | Disease Stage | Target Gene | RSS | Regulon Activity |
| ∗The dot plots of a searched regulon are shown for all cell subpopulations in each disease state of each tissue based on the regulon specific score inferred using pySCENIC and by calculating the average expression. |
| Page: 1 |
Top |
Somatic mutation of malignant transformation related genes |
| Annotation of somatic variants for genes involved in malignant transformation |
| Hugo Symbol | Variant Class | Variant Classification | dbSNP RS | HGVSc | HGVSp | HGVSp Short | SWISSPROT | BIOTYPE | SIFT | PolyPhen | Tumor Sample Barcode | Tissue | Histology | Sex | Age | Stage | Therapy Types | Drugs | Outcome |
| HK2 | SNV | Missense_Mutation | c.2615N>T | p.Ala872Val | p.A872V | P52789 | protein_coding | deleterious(0.01) | possibly_damaging(0.652) | TCGA-A7-A26E-01 | Breast | breast invasive carcinoma | Female | >=65 | III/IV | Chemotherapy | cytoxan | SD | |
| HK2 | SNV | Missense_Mutation | c.749N>C | p.Gly250Ala | p.G250A | P52789 | protein_coding | deleterious(0.04) | probably_damaging(1) | TCGA-A8-A09Z-01 | Breast | breast invasive carcinoma | Female | >=65 | I/II | Unknown | Unknown | SD | |
| HK2 | SNV | Missense_Mutation | c.850G>T | p.Gly284Cys | p.G284C | P52789 | protein_coding | deleterious(0.02) | probably_damaging(0.988) | TCGA-AN-A0XN-01 | Breast | breast invasive carcinoma | Female | >=65 | III/IV | Unknown | Unknown | SD | |
| HK2 | SNV | Missense_Mutation | novel | c.2186N>G | p.Val729Gly | p.V729G | P52789 | protein_coding | deleterious(0) | probably_damaging(0.999) | TCGA-BH-A0HO-01 | Breast | breast invasive carcinoma | Female | <65 | I/II | Chemotherapy | cyclophosphamide | SD |
| HK2 | SNV | Missense_Mutation | novel | c.1160N>T | p.Ala387Val | p.A387V | P52789 | protein_coding | deleterious(0) | benign(0.248) | TCGA-C8-A1HJ-01 | Breast | breast invasive carcinoma | Female | <65 | I/II | Unknown | Unknown | SD |
| HK2 | insertion | Frame_Shift_Ins | rs753492504 | c.1538_1539insA | p.Thr514HisfsTer63 | p.T514Hfs*63 | P52789 | protein_coding | TCGA-A8-A06T-01 | Breast | breast invasive carcinoma | Female | >=65 | III/IV | Hormone Therapy | anastrozole | SD | ||
| HK2 | insertion | In_Frame_Ins | novel | c.1552_1553insTTATTGTTC | p.Ala518delinsValIleValPro | p.A518delinsVIVP | P52789 | protein_coding | TCGA-AO-A03R-01 | Breast | breast invasive carcinoma | Female | <65 | I/II | Chemotherapy | doxorubicin | SD | ||
| HK2 | insertion | Frame_Shift_Ins | novel | c.1554_1555insGTCTTTACTCTTAG | p.Thr519ValfsTer78 | p.T519Vfs*78 | P52789 | protein_coding | TCGA-AO-A03R-01 | Breast | breast invasive carcinoma | Female | <65 | I/II | Chemotherapy | doxorubicin | SD | ||
| HK2 | deletion | Frame_Shift_Del | novel | c.5delN | p.Ile2MetfsTer60 | p.I2Mfs*60 | P52789 | protein_coding | TCGA-EW-A2FV-01 | Breast | breast invasive carcinoma | Female | <65 | III/IV | Chemotherapy | docetaxel | SD | ||
| HK2 | SNV | Missense_Mutation | novel | c.1187G>A | p.Arg396His | p.R396H | P52789 | protein_coding | tolerated(0.14) | probably_damaging(1) | TCGA-2W-A8YY-01 | Cervix | cervical & endocervical cancer | Female | <65 | I/II | Chemotherapy | cisplatin | CR |
| Page: 1 2 3 4 5 6 7 8 9 10 11 12 |
Top |
Related drugs of malignant transformation related genes |
| Identification of chemicals and drugs interact with genes involved in malignant transfromation |
| (DGIdb 4.0) |
| Entrez ID | Symbol | Category | Interaction Types | Drug Claim Name | Drug Name | PMIDs |
| 3099 | HK2 | ENZYME, KINASE | VDA-1102 topical ointment |
| Page: 1 |

Copyright 2023-Present -The University of Texas Health Science Center at Houston |