
|
|||||
|
 | |
| |
| |
| |
| |
| |
|
Gene: HK1 |
Gene summary for HK1 |
| Gene information | Species | Human | Gene symbol | HK1 | Gene ID | 3098 |
| Gene name | hexokinase 1 | |
| Gene Alias | HK | |
| Cytomap | 10q22.1 | |
| Gene Type | protein-coding | GO ID | GO:0001678 | UniProtAcc | A8K7J7 |
Top |
Malignant transformation analysis |
| Identification of the aberrant gene expression in precancerous and cancerous lesions by comparing the gene expression of stem-like cells in diseased tissues with normal stem cells |
| Entrez ID | Symbol | Replicates | Species | Organ | Tissue | Adj P-value | Log2FC | Malignancy |
| 3098 | HK1 | CCI_1 | Human | Cervix | CC | 2.98e-02 | 5.23e-01 | 0.528 |
| 3098 | HK1 | CCI_2 | Human | Cervix | CC | 6.13e-09 | 7.87e-01 | 0.5249 |
| 3098 | HK1 | HTA11_347_2000001011 | Human | Colorectum | AD | 4.73e-05 | 3.75e-01 | -0.1954 |
| 3098 | HK1 | A015-C-203 | Human | Colorectum | FAP | 5.47e-13 | -3.85e-01 | -0.1294 |
| 3098 | HK1 | A015-C-204 | Human | Colorectum | FAP | 5.49e-03 | -2.56e-01 | -0.0228 |
| 3098 | HK1 | A014-C-040 | Human | Colorectum | FAP | 1.49e-02 | -3.87e-01 | -0.1184 |
| 3098 | HK1 | A002-C-201 | Human | Colorectum | FAP | 3.98e-10 | -2.88e-01 | 0.0324 |
| 3098 | HK1 | A001-C-119 | Human | Colorectum | FAP | 1.59e-03 | -2.66e-01 | -0.1557 |
| 3098 | HK1 | A001-C-108 | Human | Colorectum | FAP | 4.60e-04 | -2.25e-01 | -0.0272 |
| 3098 | HK1 | A002-C-205 | Human | Colorectum | FAP | 2.21e-12 | -2.50e-01 | -0.1236 |
| 3098 | HK1 | A015-C-005 | Human | Colorectum | FAP | 1.17e-03 | -2.68e-01 | -0.0336 |
| 3098 | HK1 | A015-C-006 | Human | Colorectum | FAP | 1.80e-07 | -2.70e-01 | -0.0994 |
| 3098 | HK1 | A015-C-106 | Human | Colorectum | FAP | 6.60e-05 | -2.11e-01 | -0.0511 |
| 3098 | HK1 | A002-C-114 | Human | Colorectum | FAP | 6.04e-11 | -3.02e-01 | -0.1561 |
| 3098 | HK1 | A015-C-104 | Human | Colorectum | FAP | 2.93e-13 | -3.88e-01 | -0.1899 |
| 3098 | HK1 | A001-C-014 | Human | Colorectum | FAP | 2.99e-03 | -2.30e-01 | 0.0135 |
| 3098 | HK1 | A002-C-016 | Human | Colorectum | FAP | 1.38e-08 | -2.76e-01 | 0.0521 |
| 3098 | HK1 | A015-C-002 | Human | Colorectum | FAP | 8.17e-07 | -3.08e-01 | -0.0763 |
| 3098 | HK1 | A001-C-203 | Human | Colorectum | FAP | 8.29e-04 | -1.62e-01 | -0.0481 |
| 3098 | HK1 | A002-C-116 | Human | Colorectum | FAP | 7.19e-14 | -2.75e-01 | -0.0452 |
| Page: 1 2 3 4 5 6 7 8 9 |
| Tissue | Expression Dynamics | Abbreviation |
| Cervix |  | CC: Cervix cancer |
| HSIL_HPV: HPV-infected high-grade squamous intraepithelial lesions | ||
| N_HPV: HPV-infected normal cervix | ||
| Colorectum (GSE201348) | 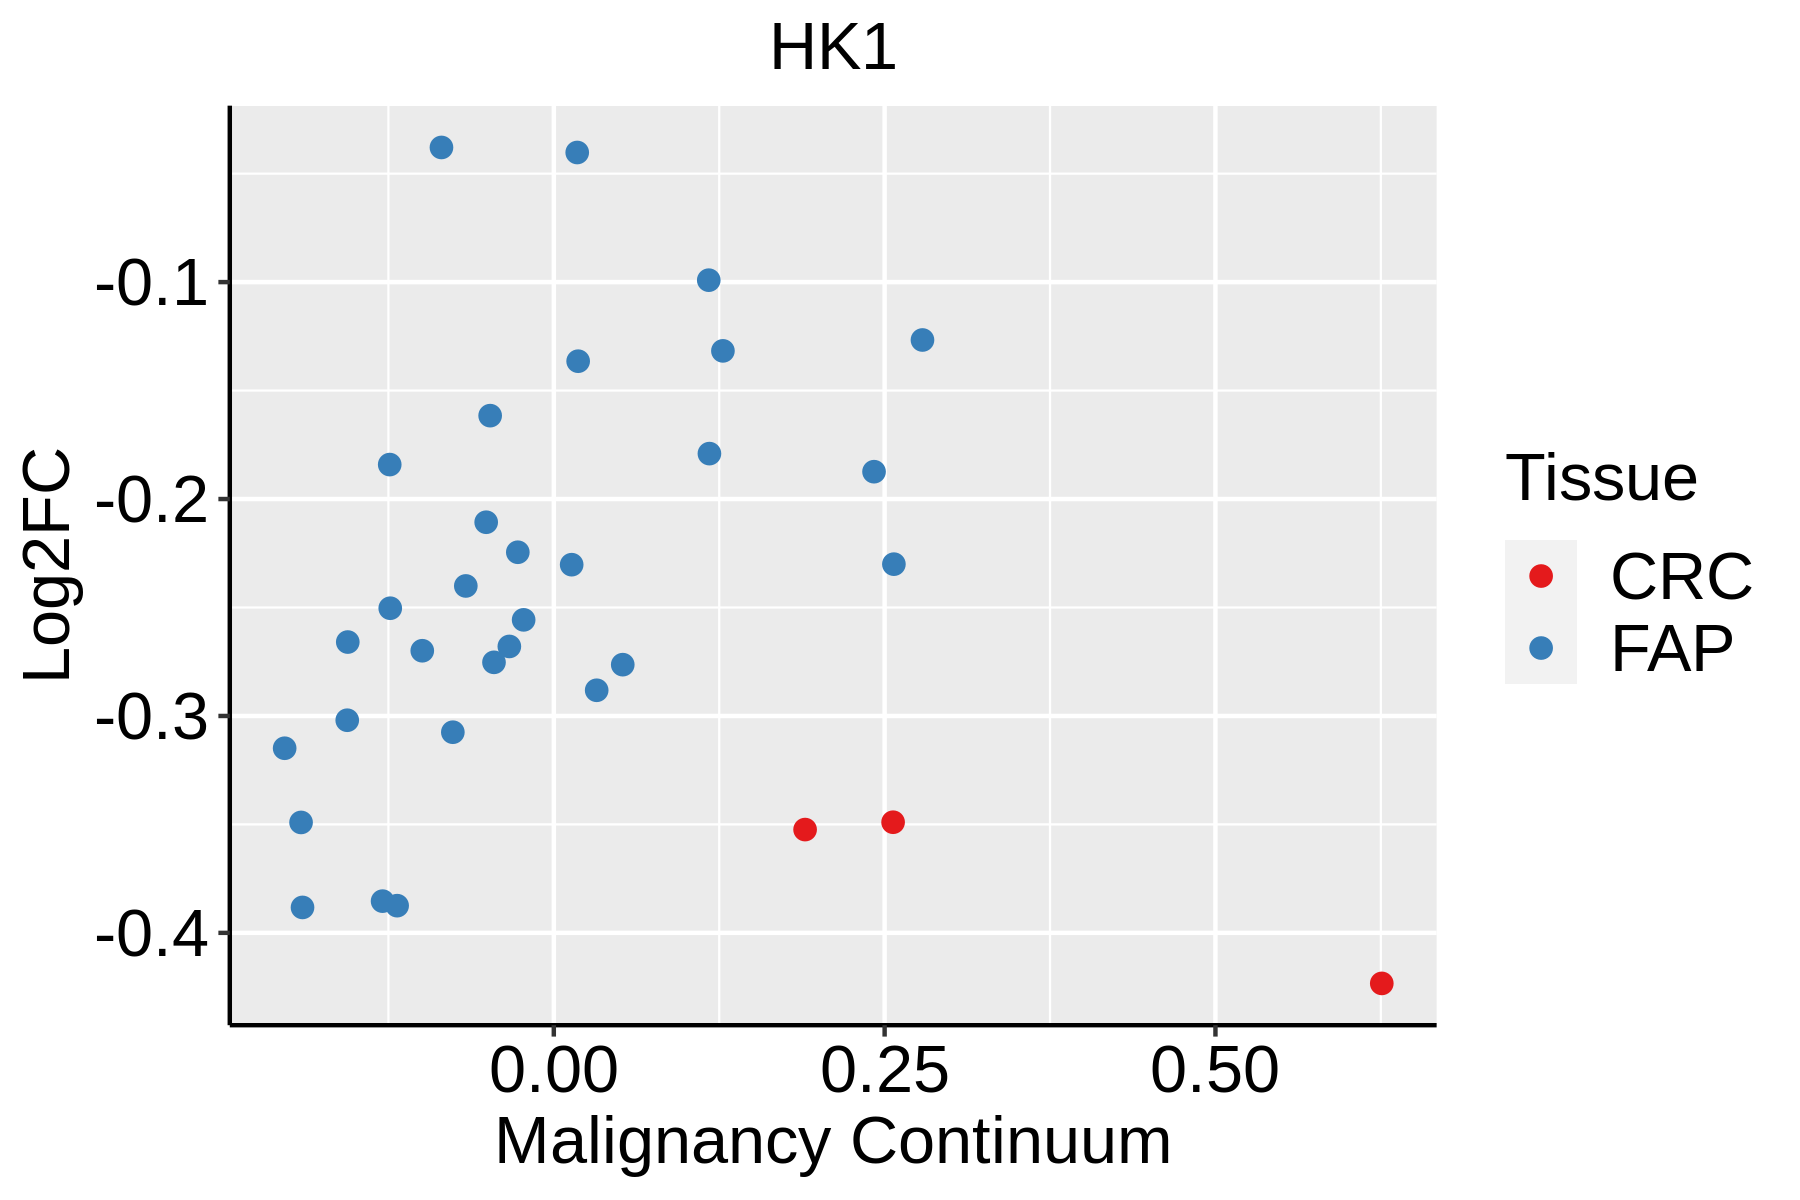 | FAP: Familial adenomatous polyposis |
| CRC: Colorectal cancer | ||
| Colorectum (HTA11) |  | AD: Adenomas |
| SER: Sessile serrated lesions | ||
| MSI-H: Microsatellite-high colorectal cancer | ||
| MSS: Microsatellite stable colorectal cancer | ||
| Endometrium | 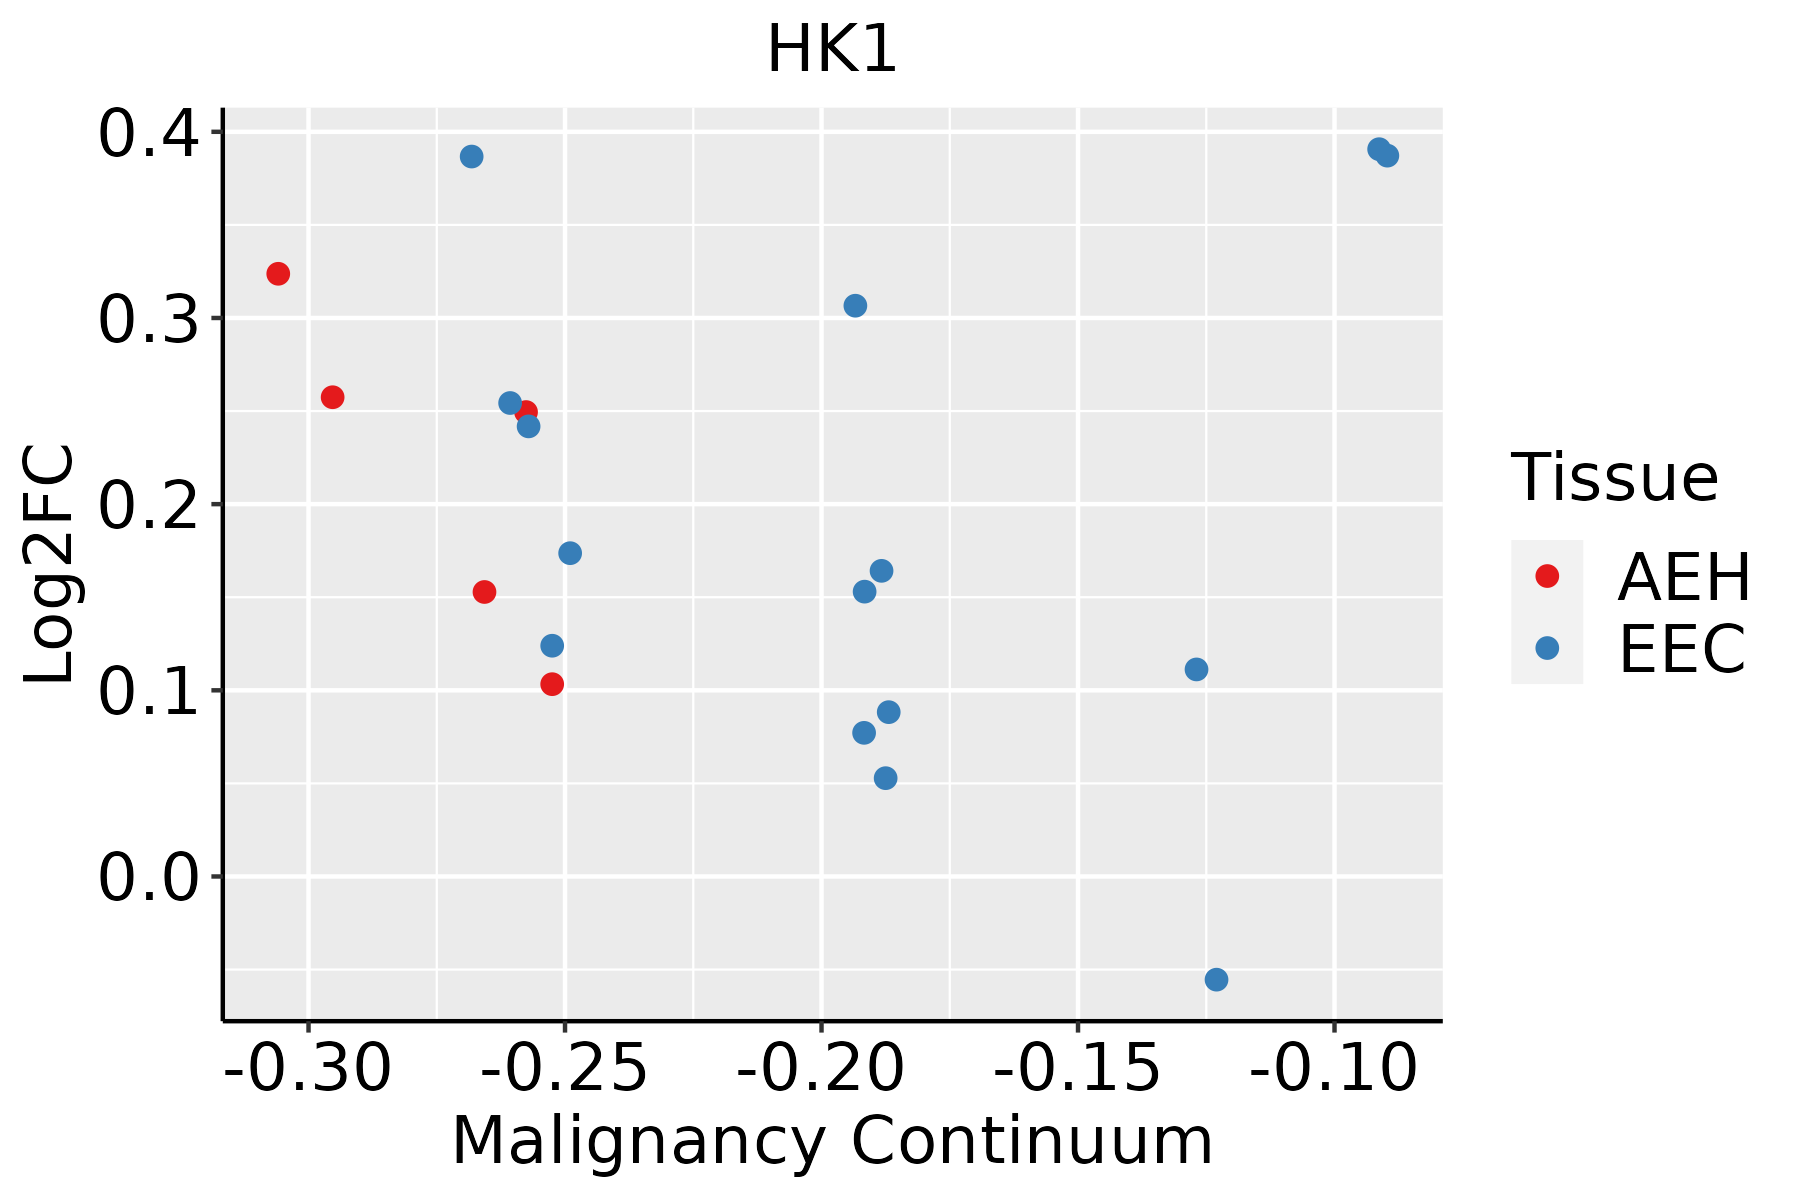 | AEH: Atypical endometrial hyperplasia |
| EEC: Endometrioid Cancer | ||
| Esophagus | 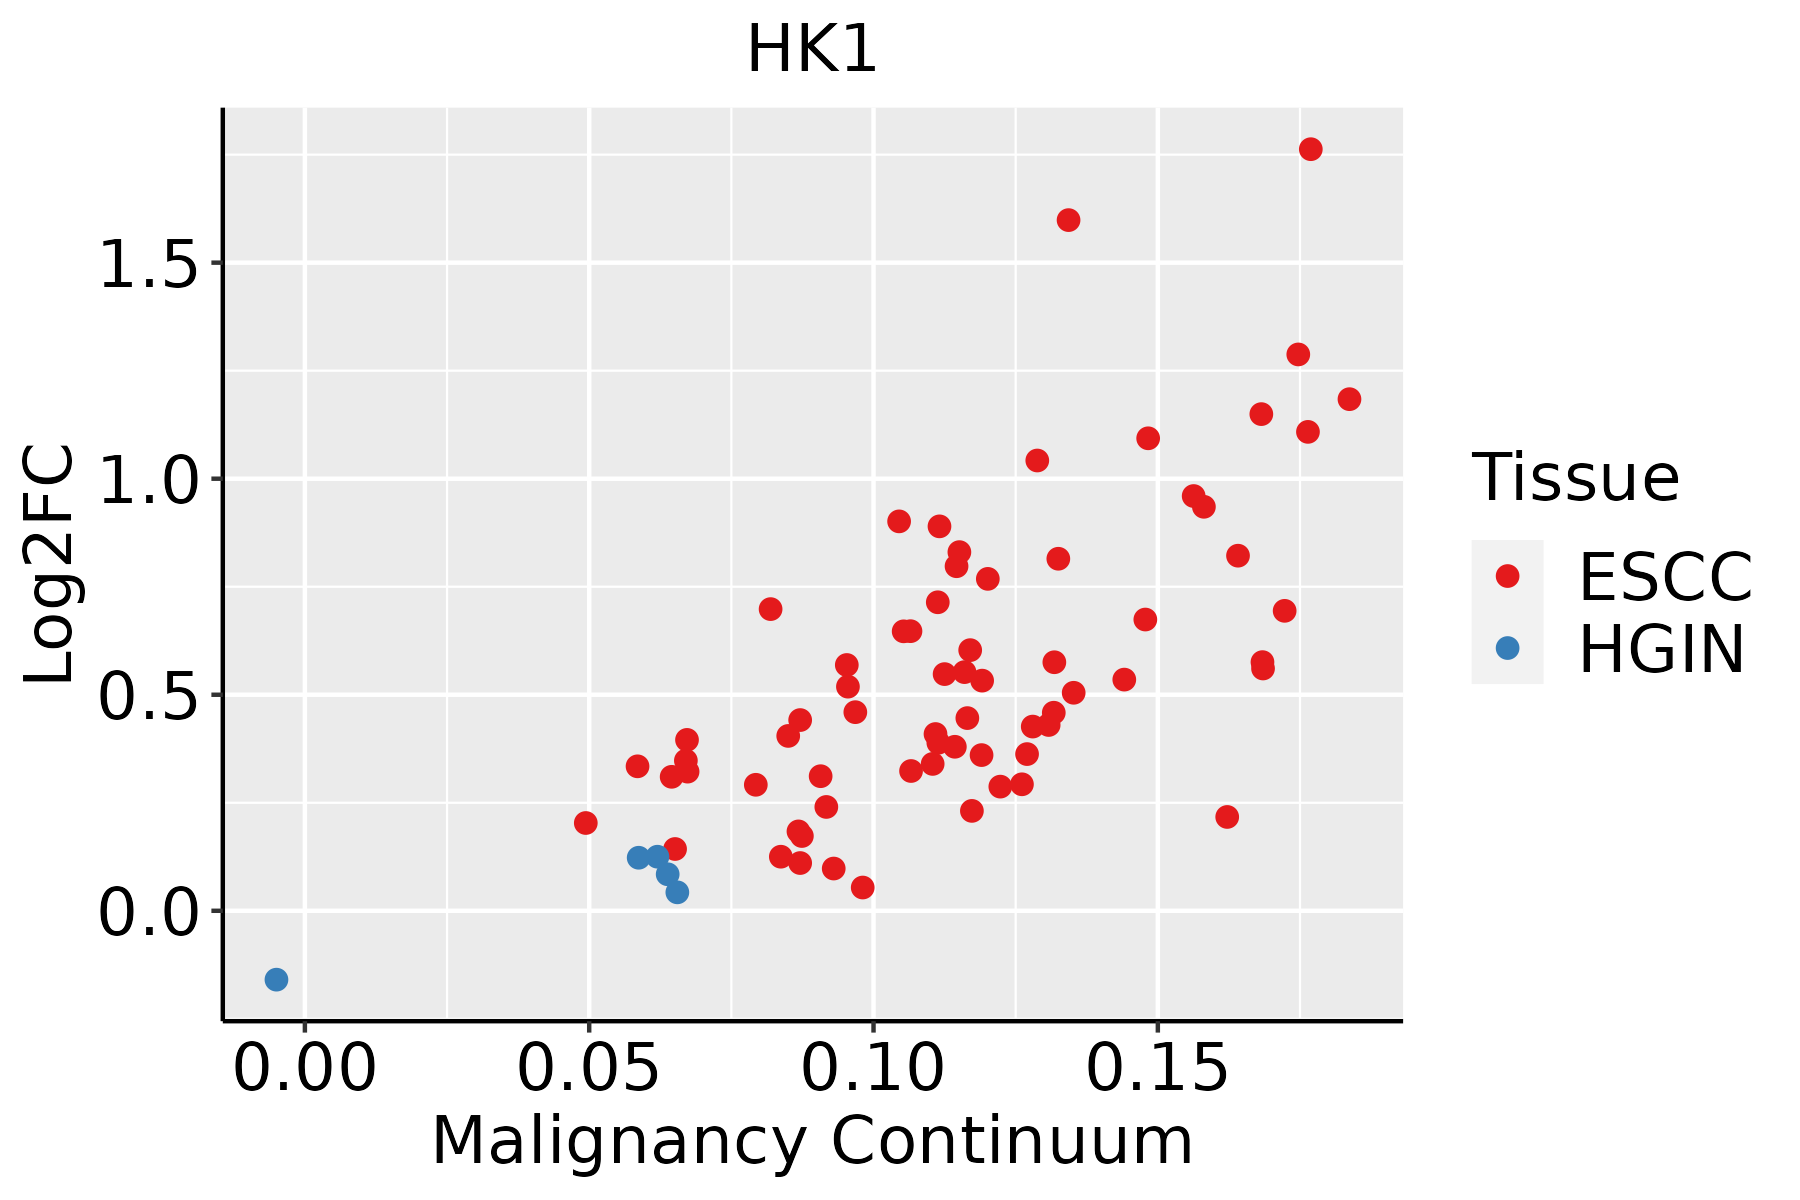 | ESCC: Esophageal squamous cell carcinoma |
| HGIN: High-grade intraepithelial neoplasias | ||
| LGIN: Low-grade intraepithelial neoplasias | ||
| Oral Cavity |  | EOLP: Erosive Oral lichen planus |
| LP: leukoplakia | ||
| NEOLP: Non-erosive oral lichen planus | ||
| OSCC: Oral squamous cell carcinoma | ||
| Prostate |  | BPH: Benign Prostatic Hyperplasia |
| Skin | 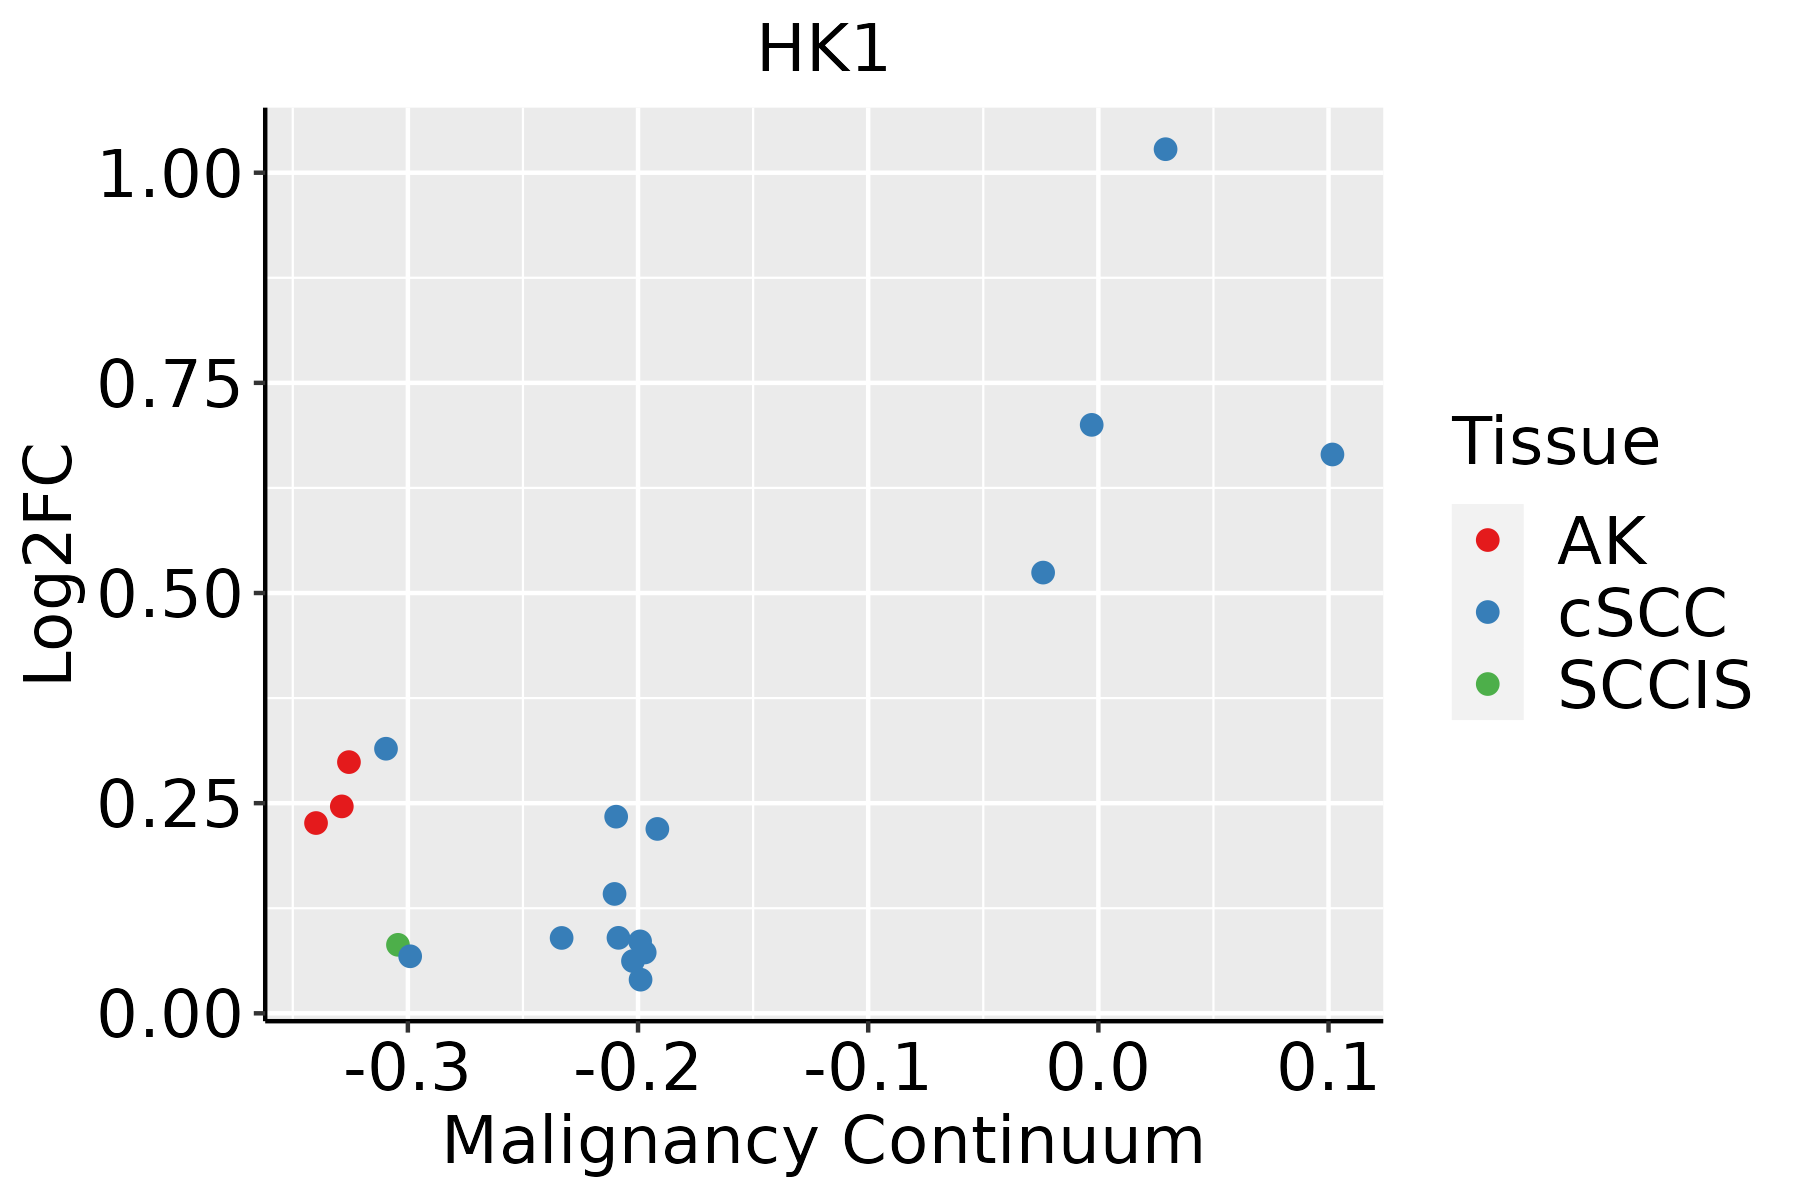 | AK: Actinic keratosis |
| cSCC: Cutaneous squamous cell carcinoma | ||
| SCCIS:squamous cell carcinoma in situ | ||
| Thyroid |  | ATC: Anaplastic thyroid cancer |
| HT: Hashimoto's thyroiditis | ||
| PTC: Papillary thyroid cancer |
| ∗log2FC in expression of this searched gene in stem-like cells from each diseased tissue sample relative to stem-like cells in normal samples in each tissue plotted against the malignancy continuum. Samples are colored based on if they are from different disease stage. |
Top |
Malignant transformation related pathway analysis |
| Find out the enriched GO biological processes and KEGG pathways involved in transition from healthy to precancer to cancer |
| Tissue | Disease Stage | Enriched GO biological Processes |
| Colorectum | AD |  |
| Colorectum | SER |  |
| Colorectum | MSS |  |
| Colorectum | MSI-H |  |
| Colorectum | FAP |  |
| ∗Top 15 enriched GO BP terms are showed in the bar plot of each disease state in each tissue. Each row represents a significant GO biological process which is colored according to the -log10(p.adjust). |
| Page: 1 2 3 4 5 6 7 8 9 |
| GO ID | Tissue | Disease Stage | Description | Gene Ratio | Bg Ratio | pvalue | p.adjust | Count |
| GO:004603410 | Cervix | CC | ATP metabolic process | 90/2311 | 277/18723 | 7.90e-19 | 2.36e-15 | 90 |
| GO:00725949 | Cervix | CC | establishment of protein localization to organelle | 99/2311 | 422/18723 | 1.23e-10 | 2.11e-08 | 99 |
| GO:00512359 | Cervix | CC | maintenance of location | 78/2311 | 327/18723 | 5.18e-09 | 4.92e-07 | 78 |
| GO:00060919 | Cervix | CC | generation of precursor metabolites and energy | 105/2311 | 490/18723 | 7.40e-09 | 6.61e-07 | 105 |
| GO:005165110 | Cervix | CC | maintenance of location in cell | 55/2311 | 214/18723 | 6.63e-08 | 3.85e-06 | 55 |
| GO:00018197 | Cervix | CC | positive regulation of cytokine production | 95/2311 | 467/18723 | 4.88e-07 | 1.85e-05 | 95 |
| GO:00705859 | Cervix | CC | protein localization to mitochondrion | 33/2311 | 125/18723 | 1.46e-05 | 2.90e-04 | 33 |
| GO:00325077 | Cervix | CC | maintenance of protein location in cell | 21/2311 | 65/18723 | 2.03e-05 | 3.71e-04 | 21 |
| GO:00726559 | Cervix | CC | establishment of protein localization to mitochondrion | 31/2311 | 120/18723 | 4.13e-05 | 6.36e-04 | 31 |
| GO:004518510 | Cervix | CC | maintenance of protein location | 26/2311 | 94/18723 | 4.85e-05 | 7.34e-04 | 26 |
| GO:00725955 | Cervix | CC | maintenance of protein localization in organelle | 14/2311 | 42/18723 | 3.32e-04 | 3.49e-03 | 14 |
| GO:00196939 | Cervix | CC | ribose phosphate metabolic process | 72/2311 | 396/18723 | 4.49e-04 | 4.48e-03 | 72 |
| GO:00092599 | Cervix | CC | ribonucleotide metabolic process | 70/2311 | 385/18723 | 5.35e-04 | 5.18e-03 | 70 |
| GO:00425939 | Cervix | CC | glucose homeostasis | 50/2311 | 258/18723 | 7.57e-04 | 6.76e-03 | 50 |
| GO:00335009 | Cervix | CC | carbohydrate homeostasis | 50/2311 | 259/18723 | 8.28e-04 | 7.22e-03 | 50 |
| GO:00026973 | Cervix | CC | regulation of immune effector process | 62/2311 | 339/18723 | 9.25e-04 | 7.84e-03 | 62 |
| GO:00016788 | Cervix | CC | cellular glucose homeostasis | 36/2311 | 172/18723 | 9.65e-04 | 8.09e-03 | 36 |
| GO:000915010 | Cervix | CC | purine ribonucleotide metabolic process | 66/2311 | 368/18723 | 1.09e-03 | 9.07e-03 | 66 |
| GO:00027201 | Cervix | CC | positive regulation of cytokine production involved in immune response | 17/2311 | 65/18723 | 1.84e-03 | 1.37e-02 | 17 |
| GO:000616310 | Cervix | CC | purine nucleotide metabolic process | 67/2311 | 396/18723 | 4.41e-03 | 2.69e-02 | 67 |
| Page: 1 2 3 4 5 6 7 8 9 10 11 12 13 14 15 16 17 18 19 20 21 22 23 24 25 26 27 28 29 30 31 32 33 34 35 36 37 38 39 40 41 42 43 44 45 46 47 48 49 50 51 52 53 54 55 56 57 58 |
| Pathway ID | Tissue | Disease Stage | Description | Gene Ratio | Bg Ratio | pvalue | p.adjust | qvalue | Count |
| hsa0513120 | Cervix | CC | Shigellosis | 69/1267 | 247/8465 | 7.64e-08 | 1.03e-06 | 6.10e-07 | 69 |
| hsa0406618 | Cervix | CC | HIF-1 signaling pathway | 27/1267 | 109/8465 | 4.72e-03 | 1.64e-02 | 9.72e-03 | 27 |
| hsa0523010 | Cervix | CC | Central carbon metabolism in cancer | 18/1267 | 70/8465 | 1.29e-02 | 3.87e-02 | 2.29e-02 | 18 |
| hsa05131110 | Cervix | CC | Shigellosis | 69/1267 | 247/8465 | 7.64e-08 | 1.03e-06 | 6.10e-07 | 69 |
| hsa0406619 | Cervix | CC | HIF-1 signaling pathway | 27/1267 | 109/8465 | 4.72e-03 | 1.64e-02 | 9.72e-03 | 27 |
| hsa0523013 | Cervix | CC | Central carbon metabolism in cancer | 18/1267 | 70/8465 | 1.29e-02 | 3.87e-02 | 2.29e-02 | 18 |
| hsa05131 | Colorectum | AD | Shigellosis | 109/2092 | 247/8465 | 1.09e-11 | 2.44e-10 | 1.55e-10 | 109 |
| hsa01200 | Colorectum | AD | Carbon metabolism | 55/2092 | 115/8465 | 5.53e-08 | 8.42e-07 | 5.37e-07 | 55 |
| hsa00010 | Colorectum | AD | Glycolysis / Gluconeogenesis | 34/2092 | 67/8465 | 3.63e-06 | 4.34e-05 | 2.77e-05 | 34 |
| hsa04066 | Colorectum | AD | HIF-1 signaling pathway | 48/2092 | 109/8465 | 7.25e-06 | 7.84e-05 | 5.00e-05 | 48 |
| hsa05230 | Colorectum | AD | Central carbon metabolism in cancer | 33/2092 | 70/8465 | 3.61e-05 | 3.19e-04 | 2.03e-04 | 33 |
| hsa00051 | Colorectum | AD | Fructose and mannose metabolism | 17/2092 | 34/8465 | 1.25e-03 | 8.02e-03 | 5.12e-03 | 17 |
| hsa051311 | Colorectum | AD | Shigellosis | 109/2092 | 247/8465 | 1.09e-11 | 2.44e-10 | 1.55e-10 | 109 |
| hsa012001 | Colorectum | AD | Carbon metabolism | 55/2092 | 115/8465 | 5.53e-08 | 8.42e-07 | 5.37e-07 | 55 |
| hsa000101 | Colorectum | AD | Glycolysis / Gluconeogenesis | 34/2092 | 67/8465 | 3.63e-06 | 4.34e-05 | 2.77e-05 | 34 |
| hsa040661 | Colorectum | AD | HIF-1 signaling pathway | 48/2092 | 109/8465 | 7.25e-06 | 7.84e-05 | 5.00e-05 | 48 |
| hsa052301 | Colorectum | AD | Central carbon metabolism in cancer | 33/2092 | 70/8465 | 3.61e-05 | 3.19e-04 | 2.03e-04 | 33 |
| hsa000511 | Colorectum | AD | Fructose and mannose metabolism | 17/2092 | 34/8465 | 1.25e-03 | 8.02e-03 | 5.12e-03 | 17 |
| hsa051318 | Colorectum | FAP | Shigellosis | 76/1404 | 247/8465 | 1.57e-08 | 5.84e-07 | 3.55e-07 | 76 |
| hsa040666 | Colorectum | FAP | HIF-1 signaling pathway | 38/1404 | 109/8465 | 2.43e-06 | 4.28e-05 | 2.60e-05 | 38 |
| Page: 1 2 3 4 5 6 |
Top |
Cell-cell communication analysis |
| Identification of potential cell-cell interactions between two cell types and their ligand-receptor pairs for different disease states |
| Ligand | Receptor | LRpair | Pathway | Tissue | Disease Stage |
| Page: 1 |
Top |
Single-cell gene regulatory network inference analysis |
| Find out the significant the regulons (TFs) and the target genes of each regulon across cell types for different disease states |
| TF | Cell Type | Tissue | Disease Stage | Target Gene | RSS | Regulon Activity |
| ∗The dot plots of a searched regulon are shown for all cell subpopulations in each disease state of each tissue based on the regulon specific score inferred using pySCENIC and by calculating the average expression. |
| Page: 1 |
Top |
Somatic mutation of malignant transformation related genes |
| Annotation of somatic variants for genes involved in malignant transformation |
| Hugo Symbol | Variant Class | Variant Classification | dbSNP RS | HGVSc | HGVSp | HGVSp Short | SWISSPROT | BIOTYPE | SIFT | PolyPhen | Tumor Sample Barcode | Tissue | Histology | Sex | Age | Stage | Therapy Types | Drugs | Outcome |
| HK1 | SNV | Missense_Mutation | novel | c.862G>A | p.Gly288Arg | p.G288R | P19367 | protein_coding | tolerated(0.21) | probably_damaging(0.982) | TCGA-A7-A4SC-01 | Breast | breast invasive carcinoma | Female | <65 | I/II | Hormone Therapy | tamoxiphen | SD |
| HK1 | SNV | Missense_Mutation | c.100C>T | p.Arg34Trp | p.R34W | P19367 | protein_coding | deleterious(0.03) | probably_damaging(0.979) | TCGA-A7-A6VV-01 | Breast | breast invasive carcinoma | Female | <65 | I/II | Chemotherapy | cyclophosphamide | CR | |
| HK1 | SNV | Missense_Mutation | novel | c.2692N>C | p.Glu898Gln | p.E898Q | P19367 | protein_coding | deleterious(0.01) | probably_damaging(0.958) | TCGA-D8-A4Z1-01 | Breast | breast invasive carcinoma | Female | >=65 | I/II | Hormone Therapy | tamoxiphen | SD |
| HK1 | deletion | Frame_Shift_Del | novel | c.797delG | p.Gly266GlufsTer9 | p.G266Efs*9 | P19367 | protein_coding | TCGA-D8-A27V-01 | Breast | breast invasive carcinoma | Female | <65 | I/II | Hormone Therapy | tamoxiphen | SD | ||
| HK1 | SNV | Missense_Mutation | rs747689299 | c.1414C>T | p.Arg472Trp | p.R472W | P19367 | protein_coding | deleterious(0.01) | probably_damaging(0.945) | TCGA-2W-A8YY-01 | Cervix | cervical & endocervical cancer | Female | <65 | I/II | Chemotherapy | cisplatin | CR |
| HK1 | SNV | Missense_Mutation | rs867948527 | c.2740C>T | p.Arg914Trp | p.R914W | P19367 | protein_coding | deleterious(0) | probably_damaging(1) | TCGA-2W-A8YY-01 | Cervix | cervical & endocervical cancer | Female | <65 | I/II | Chemotherapy | cisplatin | CR |
| HK1 | SNV | Missense_Mutation | novel | c.703G>A | p.Gly235Ser | p.G235S | P19367 | protein_coding | deleterious(0) | probably_damaging(0.986) | TCGA-EA-A3HS-01 | Cervix | cervical & endocervical cancer | Female | <65 | I/II | Unknown | Unknown | SD |
| HK1 | SNV | Missense_Mutation | rs146727978 | c.2548N>T | p.Arg850Cys | p.R850C | P19367 | protein_coding | deleterious(0.01) | probably_damaging(1) | TCGA-FU-A3HZ-01 | Cervix | cervical & endocervical cancer | Female | <65 | I/II | Chemotherapy | cisplatin | CR |
| HK1 | SNV | Missense_Mutation | novel | c.1492G>A | p.Glu498Lys | p.E498K | P19367 | protein_coding | deleterious(0.01) | probably_damaging(0.975) | TCGA-JW-A5VL-01 | Cervix | cervical & endocervical cancer | Female | <65 | I/II | Unknown | Unknown | SD |
| HK1 | SNV | Missense_Mutation | novel | c.932G>A | p.Arg311Gln | p.R311Q | P19367 | protein_coding | deleterious(0) | probably_damaging(0.999) | TCGA-VS-A94Z-01 | Cervix | cervical & endocervical cancer | Female | <65 | I/II | Chemotherapy | cisplatin | CR |
| Page: 1 2 3 4 5 6 7 8 9 10 11 12 |
Top |
Related drugs of malignant transformation related genes |
| Identification of chemicals and drugs interact with genes involved in malignant transfromation |
| (DGIdb 4.0) |
| Entrez ID | Symbol | Category | Interaction Types | Drug Claim Name | Drug Name | PMIDs |
| 3098 | HK1 | ENZYME, KINASE | ADENOVIRUS VECTOR | 8804424 |
| Page: 1 |

Copyright 2023-Present -The University of Texas Health Science Center at Houston |