
|
|||||
|
 | |
| |
| |
| |
| |
| |
|
Gene: HJURP |
Gene summary for HJURP |
| Gene information | Species | Human | Gene symbol | HJURP | Gene ID | 55355 |
| Gene name | Holliday junction recognition protein | |
| Gene Alias | FAKTS | |
| Cytomap | 2q37.1 | |
| Gene Type | protein-coding | GO ID | GO:0006323 | UniProtAcc | Q8NCD3 |
Top |
Malignant transformation analysis |
| Identification of the aberrant gene expression in precancerous and cancerous lesions by comparing the gene expression of stem-like cells in diseased tissues with normal stem cells |
| Entrez ID | Symbol | Replicates | Species | Organ | Tissue | Adj P-value | Log2FC | Malignancy |
| 55355 | HJURP | P2T-E | Human | Esophagus | ESCC | 8.84e-05 | 2.38e-01 | 0.1177 |
| 55355 | HJURP | P5T-E | Human | Esophagus | ESCC | 4.44e-08 | 1.85e-01 | 0.1327 |
| 55355 | HJURP | P10T-E | Human | Esophagus | ESCC | 4.31e-06 | 2.75e-01 | 0.116 |
| 55355 | HJURP | P17T-E | Human | Esophagus | ESCC | 1.49e-02 | 2.38e-01 | 0.1278 |
| 55355 | HJURP | P21T-E | Human | Esophagus | ESCC | 1.78e-03 | 1.63e-01 | 0.1617 |
| 55355 | HJURP | P24T-E | Human | Esophagus | ESCC | 2.02e-06 | 2.14e-01 | 0.1287 |
| 55355 | HJURP | P28T-E | Human | Esophagus | ESCC | 3.50e-02 | 9.61e-02 | 0.1149 |
| 55355 | HJURP | P31T-E | Human | Esophagus | ESCC | 1.78e-03 | 1.44e-01 | 0.1251 |
| 55355 | HJURP | P32T-E | Human | Esophagus | ESCC | 1.96e-05 | 1.81e-01 | 0.1666 |
| 55355 | HJURP | P49T-E | Human | Esophagus | ESCC | 6.53e-04 | 4.34e-01 | 0.1768 |
| 55355 | HJURP | P52T-E | Human | Esophagus | ESCC | 4.41e-07 | 2.37e-01 | 0.1555 |
| 55355 | HJURP | P76T-E | Human | Esophagus | ESCC | 1.78e-03 | 1.75e-01 | 0.1207 |
| 55355 | HJURP | P79T-E | Human | Esophagus | ESCC | 2.02e-06 | 2.57e-01 | 0.1154 |
| 55355 | HJURP | P83T-E | Human | Esophagus | ESCC | 3.65e-06 | 2.70e-01 | 0.1738 |
| 55355 | HJURP | P89T-E | Human | Esophagus | ESCC | 4.36e-04 | 4.37e-01 | 0.1752 |
| 55355 | HJURP | P91T-E | Human | Esophagus | ESCC | 8.74e-05 | 7.47e-01 | 0.1828 |
| 55355 | HJURP | P107T-E | Human | Esophagus | ESCC | 1.10e-10 | 3.48e-01 | 0.171 |
| 55355 | HJURP | P130T-E | Human | Esophagus | ESCC | 1.76e-12 | 5.37e-01 | 0.1676 |
| Page: 1 |
| Tissue | Expression Dynamics | Abbreviation |
| Esophagus | 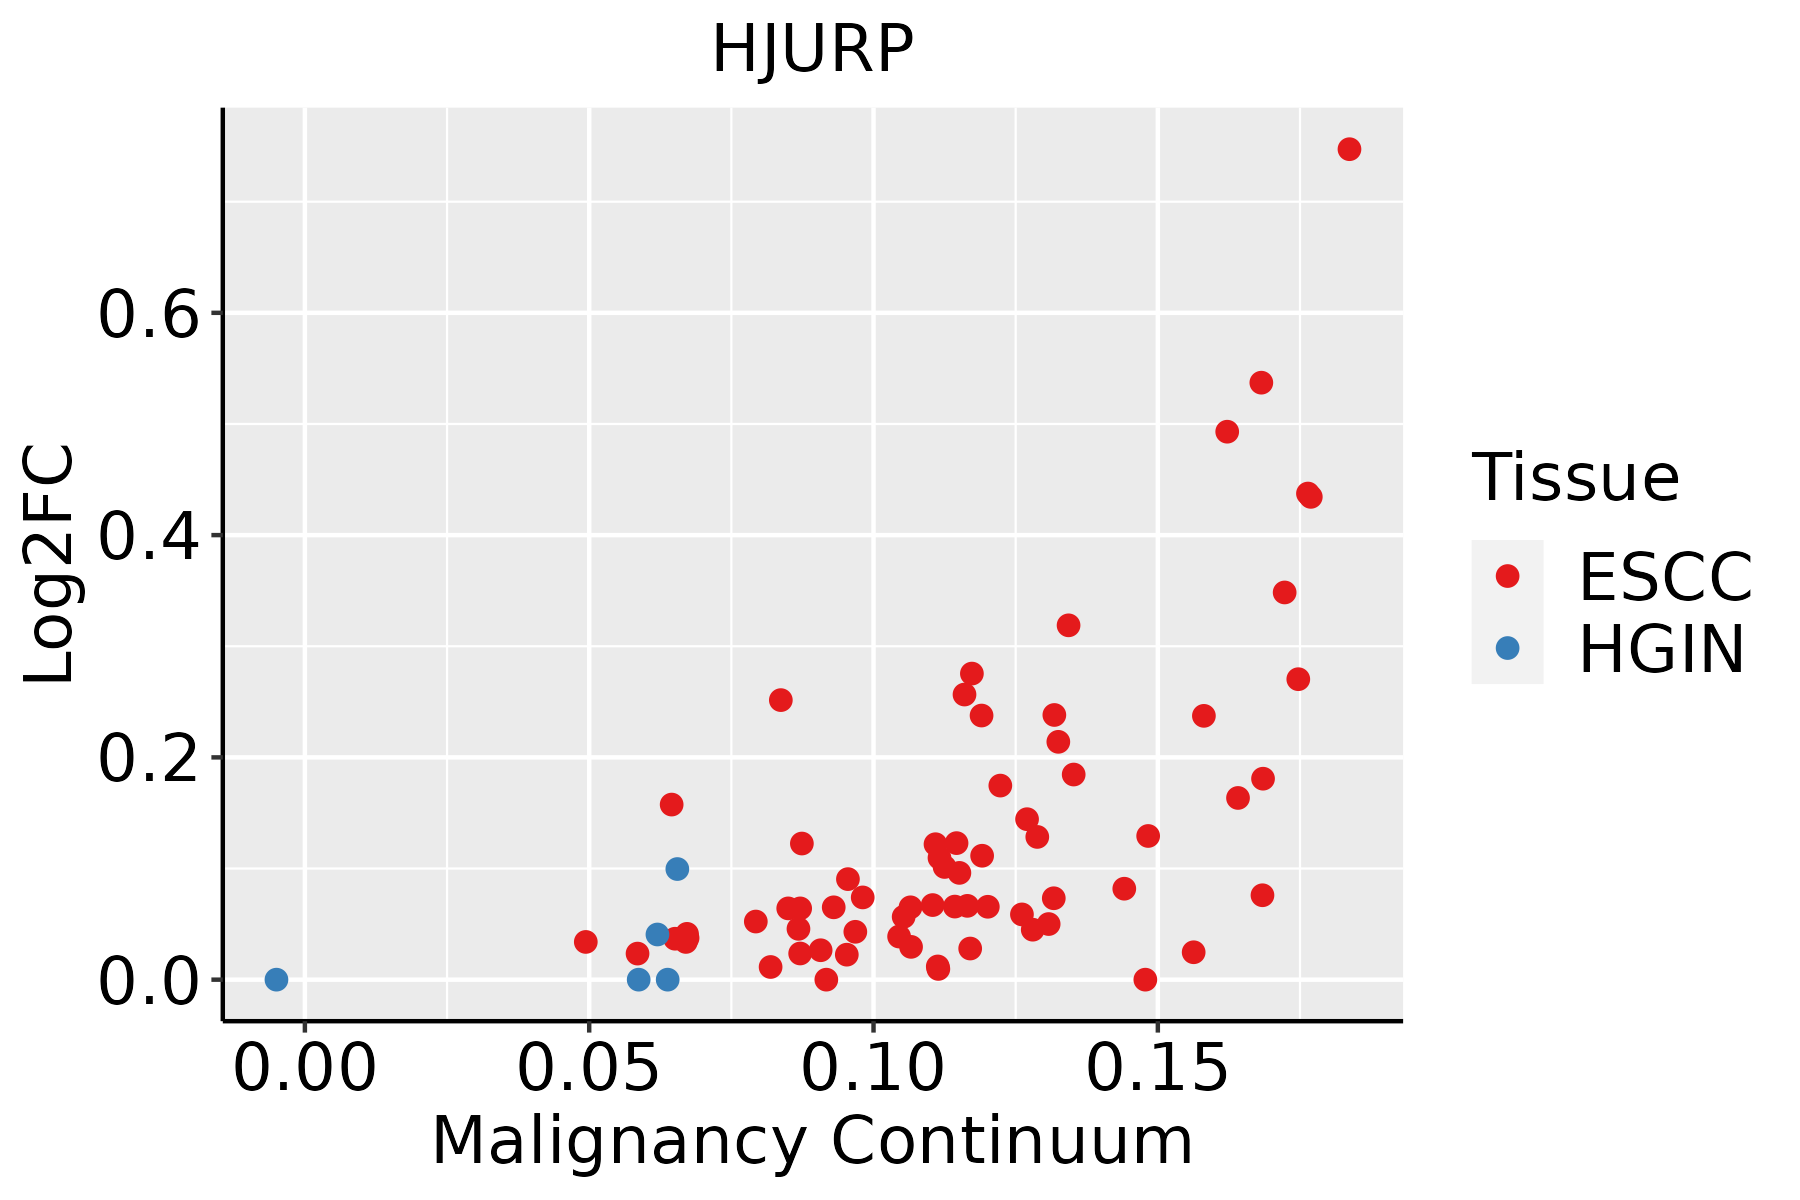 | ESCC: Esophageal squamous cell carcinoma |
| HGIN: High-grade intraepithelial neoplasias | ||
| LGIN: Low-grade intraepithelial neoplasias |
| ∗log2FC in expression of this searched gene in stem-like cells from each diseased tissue sample relative to stem-like cells in normal samples in each tissue plotted against the malignancy continuum. Samples are colored based on if they are from different disease stage. |
Top |
Malignant transformation related pathway analysis |
| Find out the enriched GO biological processes and KEGG pathways involved in transition from healthy to precancer to cancer |
| Tissue | Disease Stage | Enriched GO biological Processes |
| Colorectum | AD |  |
| Colorectum | SER |  |
| Colorectum | MSS |  |
| Colorectum | MSI-H |  |
| Colorectum | FAP |  |
| ∗Top 15 enriched GO BP terms are showed in the bar plot of each disease state in each tissue. Each row represents a significant GO biological process which is colored according to the -log10(p.adjust). |
| Page: 1 2 3 4 5 6 7 8 9 |
| GO ID | Tissue | Disease Stage | Description | Gene Ratio | Bg Ratio | pvalue | p.adjust | Count |
| GO:0051098111 | Esophagus | ESCC | regulation of binding | 251/8552 | 363/18723 | 6.73e-20 | 8.46e-18 | 251 |
| GO:000705911 | Esophagus | ESCC | chromosome segregation | 238/8552 | 346/18723 | 1.72e-18 | 1.82e-16 | 238 |
| GO:0043254111 | Esophagus | ESCC | regulation of protein-containing complex assembly | 278/8552 | 428/18723 | 3.81e-16 | 2.77e-14 | 278 |
| GO:0051101111 | Esophagus | ESCC | regulation of DNA binding | 84/8552 | 118/18723 | 1.64e-08 | 3.21e-07 | 84 |
| GO:000632517 | Esophagus | ESCC | chromatin organization | 240/8552 | 409/18723 | 6.52e-08 | 1.14e-06 | 240 |
| GO:00345081 | Esophagus | ESCC | centromere complex assembly | 25/8552 | 30/18723 | 2.45e-05 | 2.09e-04 | 25 |
| GO:0031055 | Esophagus | ESCC | chromatin remodeling at centromere | 9/8552 | 10/18723 | 5.09e-03 | 1.92e-02 | 9 |
| GO:0043486 | Esophagus | ESCC | histone exchange | 16/8552 | 22/18723 | 9.46e-03 | 3.28e-02 | 16 |
| Page: 1 |
| Pathway ID | Tissue | Disease Stage | Description | Gene Ratio | Bg Ratio | pvalue | p.adjust | qvalue | Count |
| Page: 1 |
Top |
Cell-cell communication analysis |
| Identification of potential cell-cell interactions between two cell types and their ligand-receptor pairs for different disease states |
| Ligand | Receptor | LRpair | Pathway | Tissue | Disease Stage |
| Page: 1 |
Top |
Single-cell gene regulatory network inference analysis |
| Find out the significant the regulons (TFs) and the target genes of each regulon across cell types for different disease states |
| TF | Cell Type | Tissue | Disease Stage | Target Gene | RSS | Regulon Activity |
| ∗The dot plots of a searched regulon are shown for all cell subpopulations in each disease state of each tissue based on the regulon specific score inferred using pySCENIC and by calculating the average expression. |
| Page: 1 |
Top |
Somatic mutation of malignant transformation related genes |
| Annotation of somatic variants for genes involved in malignant transformation |
| Hugo Symbol | Variant Class | Variant Classification | dbSNP RS | HGVSc | HGVSp | HGVSp Short | SWISSPROT | BIOTYPE | SIFT | PolyPhen | Tumor Sample Barcode | Tissue | Histology | Sex | Age | Stage | Therapy Types | Drugs | Outcome |
| HJURP | SNV | Missense_Mutation | rs745980197 | c.1282N>C | p.Glu428Gln | p.E428Q | Q8NCD3 | protein_coding | tolerated(0.21) | benign(0.103) | TCGA-A7-A4SA-01 | Breast | breast invasive carcinoma | Female | <65 | I/II | Chemotherapy | doxorubicin | CR |
| HJURP | SNV | Missense_Mutation | c.1072N>A | p.Ala358Thr | p.A358T | Q8NCD3 | protein_coding | tolerated(0.05) | possibly_damaging(0.847) | TCGA-BH-A0HF-01 | Breast | breast invasive carcinoma | Female | >=65 | I/II | Hormone Therapy | arimidex | SD | |
| HJURP | SNV | Missense_Mutation | c.494N>G | p.Glu165Gly | p.E165G | Q8NCD3 | protein_coding | tolerated(0.05) | possibly_damaging(0.755) | TCGA-BH-A1FH-01 | Breast | breast invasive carcinoma | Female | <65 | III/IV | Unknown | Unknown | PD | |
| HJURP | SNV | Missense_Mutation | c.1591N>T | p.His531Tyr | p.H531Y | Q8NCD3 | protein_coding | tolerated(1) | benign(0) | TCGA-C8-A1HE-01 | Breast | breast invasive carcinoma | Female | <65 | I/II | Unknown | Unknown | SD | |
| HJURP | SNV | Missense_Mutation | c.1394N>G | p.Asn465Ser | p.N465S | Q8NCD3 | protein_coding | tolerated(0.1) | benign(0.066) | TCGA-E9-A22G-01 | Breast | breast invasive carcinoma | Female | <65 | I/II | Chemotherapy | doxorubicin | SD | |
| HJURP | SNV | Missense_Mutation | novel | c.1444N>C | p.Thr482Pro | p.T482P | Q8NCD3 | protein_coding | deleterious(0) | possibly_damaging(0.799) | TCGA-C5-A907-01 | Cervix | cervical & endocervical cancer | Female | <65 | I/II | Chemotherapy | cisplatin | SD |
| HJURP | SNV | Missense_Mutation | c.31N>C | p.Glu11Gln | p.E11Q | Q8NCD3 | protein_coding | tolerated(0.2) | benign(0.026) | TCGA-DR-A0ZM-01 | Cervix | cervical & endocervical cancer | Female | <65 | III/IV | Unspecific | Cisplatin | SD | |
| HJURP | SNV | Missense_Mutation | novel | c.433N>C | p.Glu145Gln | p.E145Q | Q8NCD3 | protein_coding | deleterious(0.01) | possibly_damaging(0.888) | TCGA-VS-A958-01 | Cervix | cervical & endocervical cancer | Female | <65 | I/II | Chemotherapy | cisplatin | CR |
| HJURP | SNV | Missense_Mutation | rs771833145 | c.2077N>T | p.Arg693Cys | p.R693C | Q8NCD3 | protein_coding | tolerated(0.22) | benign(0.001) | TCGA-AA-3492-01 | Colorectum | colon adenocarcinoma | Female | >=65 | I/II | Unknown | Unknown | SD |
| HJURP | SNV | Missense_Mutation | rs562372914 | c.320N>A | p.Arg107His | p.R107H | Q8NCD3 | protein_coding | tolerated(0.56) | benign(0.003) | TCGA-AA-3811-01 | Colorectum | colon adenocarcinoma | Female | >=65 | III/IV | Unknown | Unknown | PD |
| Page: 1 2 3 4 5 6 7 8 |
Top |
Related drugs of malignant transformation related genes |
| Identification of chemicals and drugs interact with genes involved in malignant transfromation |
| (DGIdb 4.0) |
| Entrez ID | Symbol | Category | Interaction Types | Drug Claim Name | Drug Name | PMIDs |
| Page: 1 |

Copyright 2023-Present -The University of Texas Health Science Center at Houston |