| Tissue | Expression Dynamics | Abbreviation |
| Cervix | 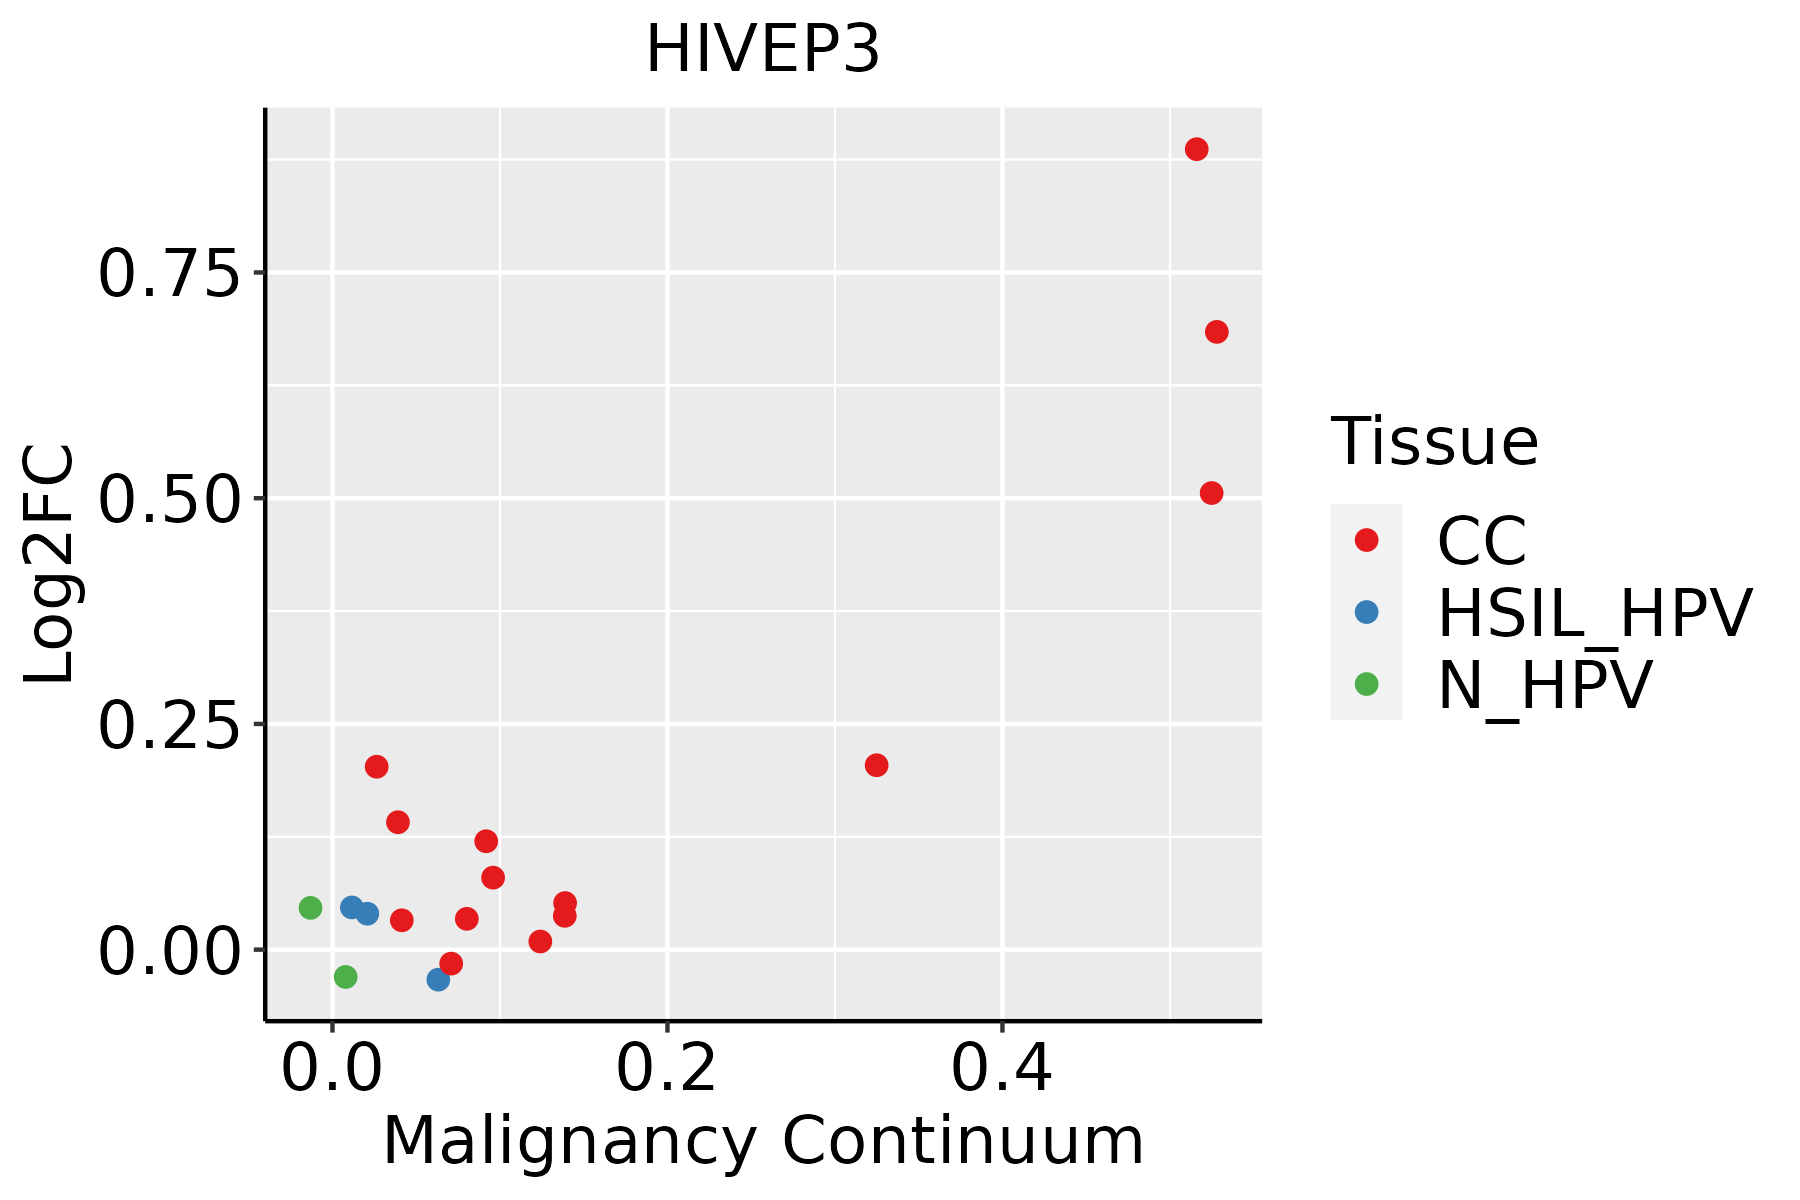 | CC: Cervix cancer |
| HSIL_HPV: HPV-infected high-grade squamous intraepithelial lesions |
| N_HPV: HPV-infected normal cervix |
| Esophagus | 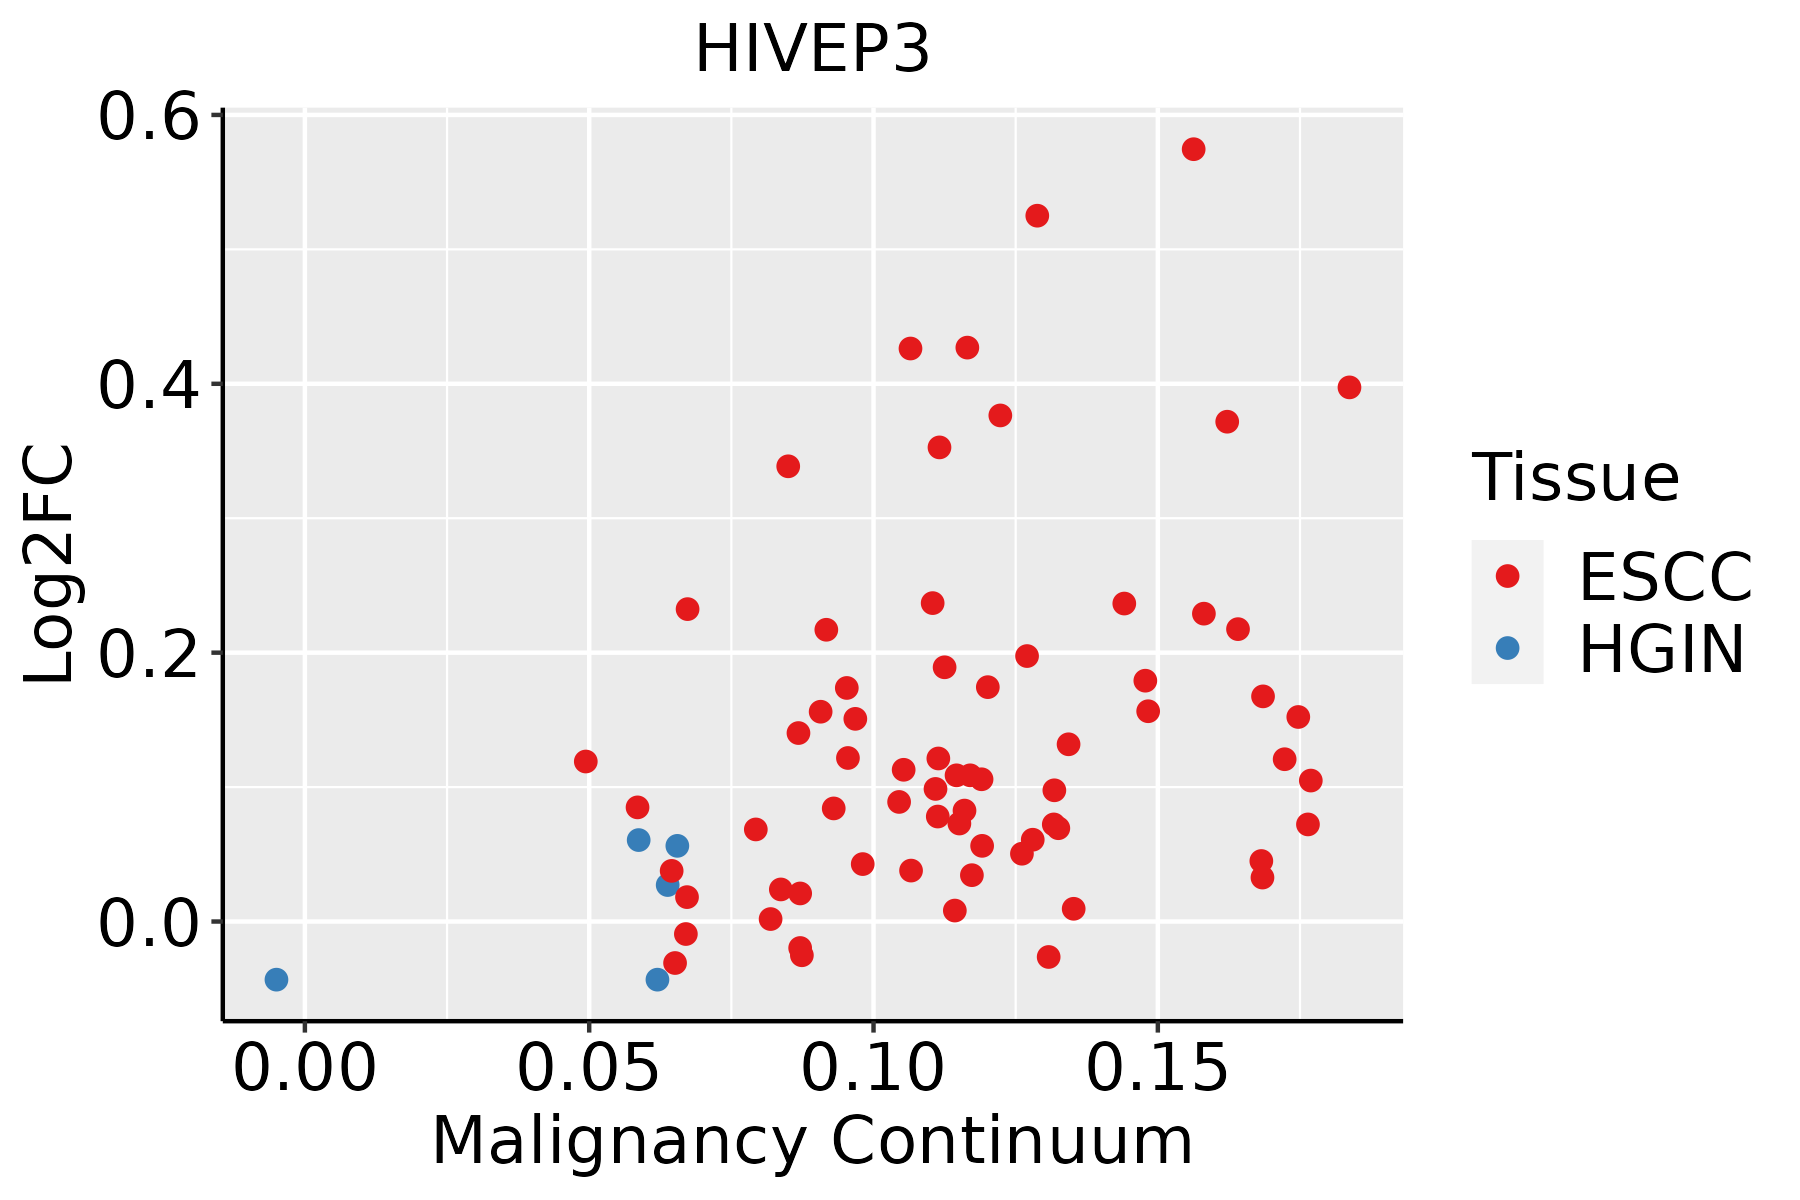 | ESCC: Esophageal squamous cell carcinoma |
| HGIN: High-grade intraepithelial neoplasias |
| LGIN: Low-grade intraepithelial neoplasias |
| Lung |  | AAH: Atypical adenomatous hyperplasia |
| AIS: Adenocarcinoma in situ |
| IAC: Invasive lung adenocarcinoma |
| MIA: Minimally invasive adenocarcinoma |
| Oral Cavity | 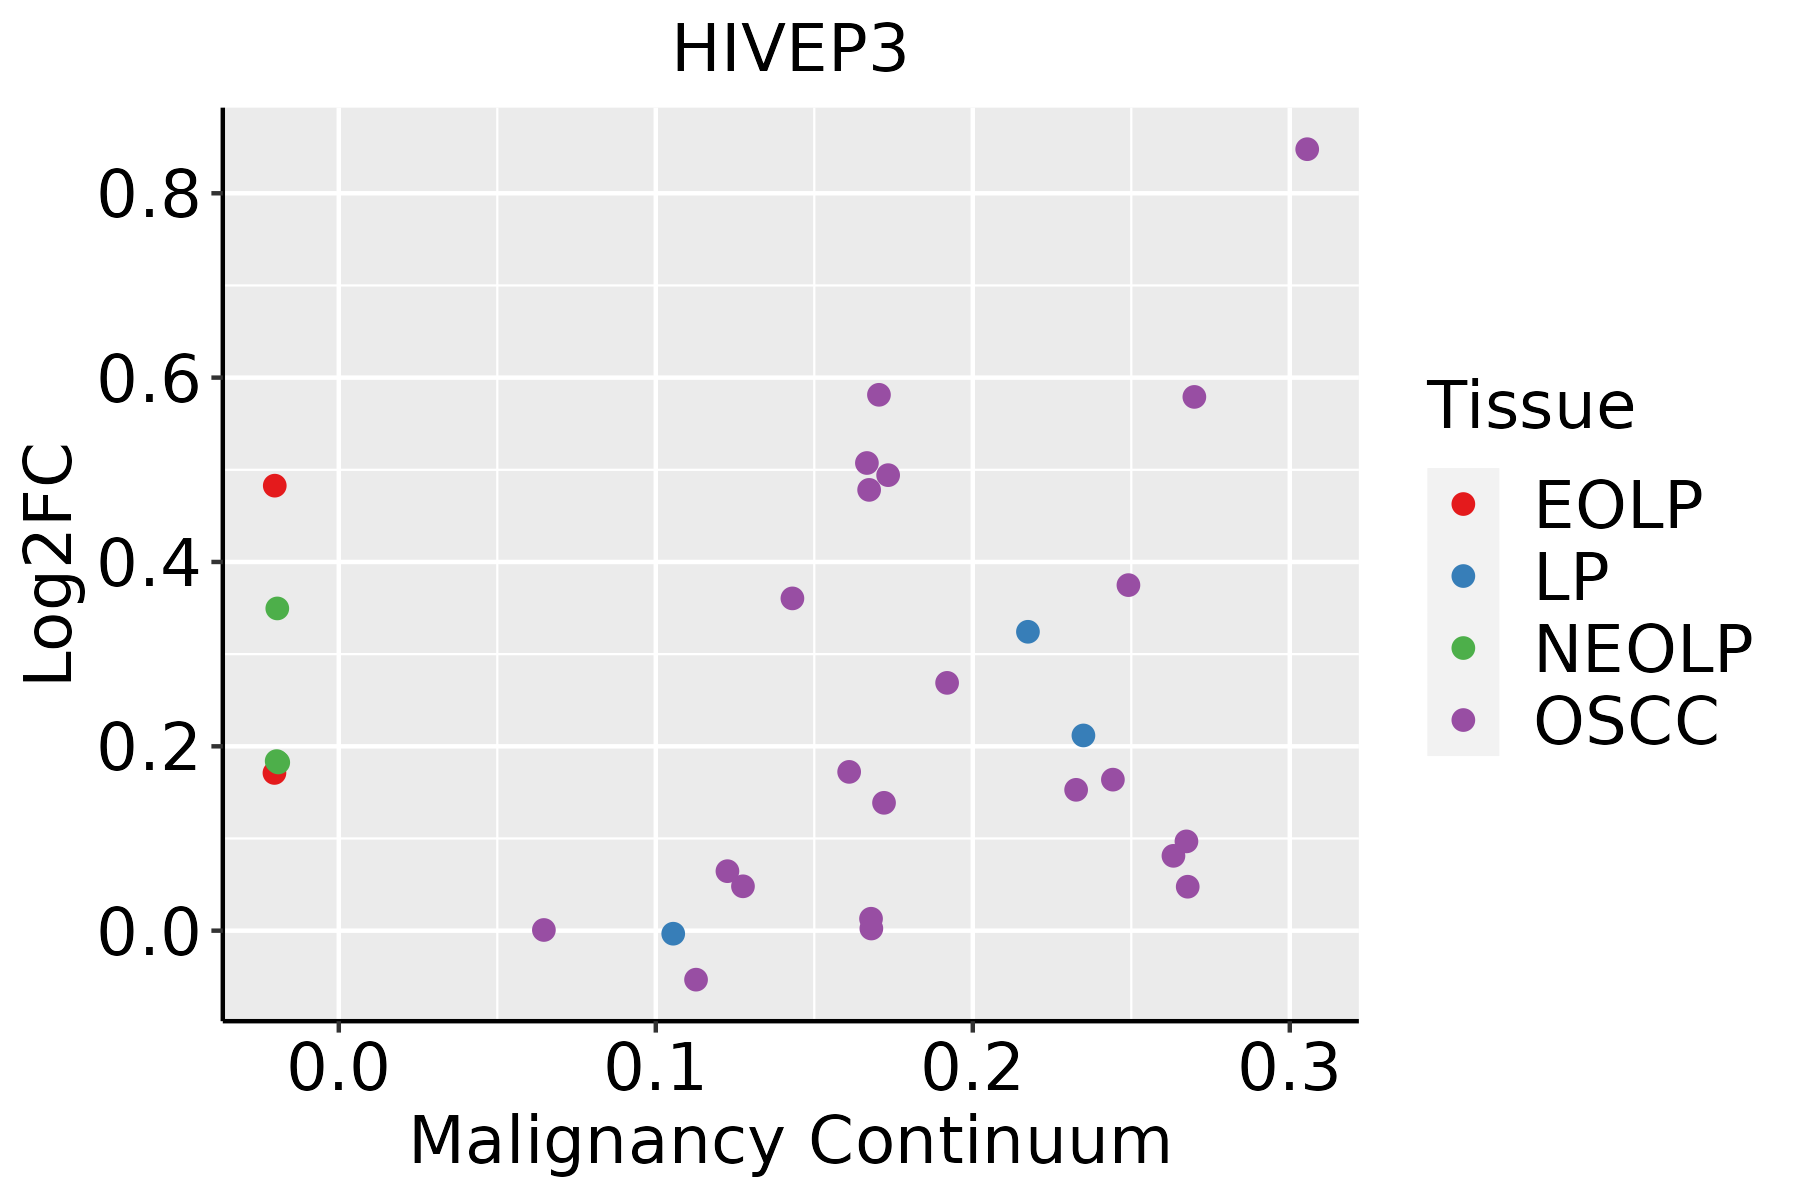 | EOLP: Erosive Oral lichen planus |
| LP: leukoplakia |
| NEOLP: Non-erosive oral lichen planus |
| OSCC: Oral squamous cell carcinoma |
| Prostate | 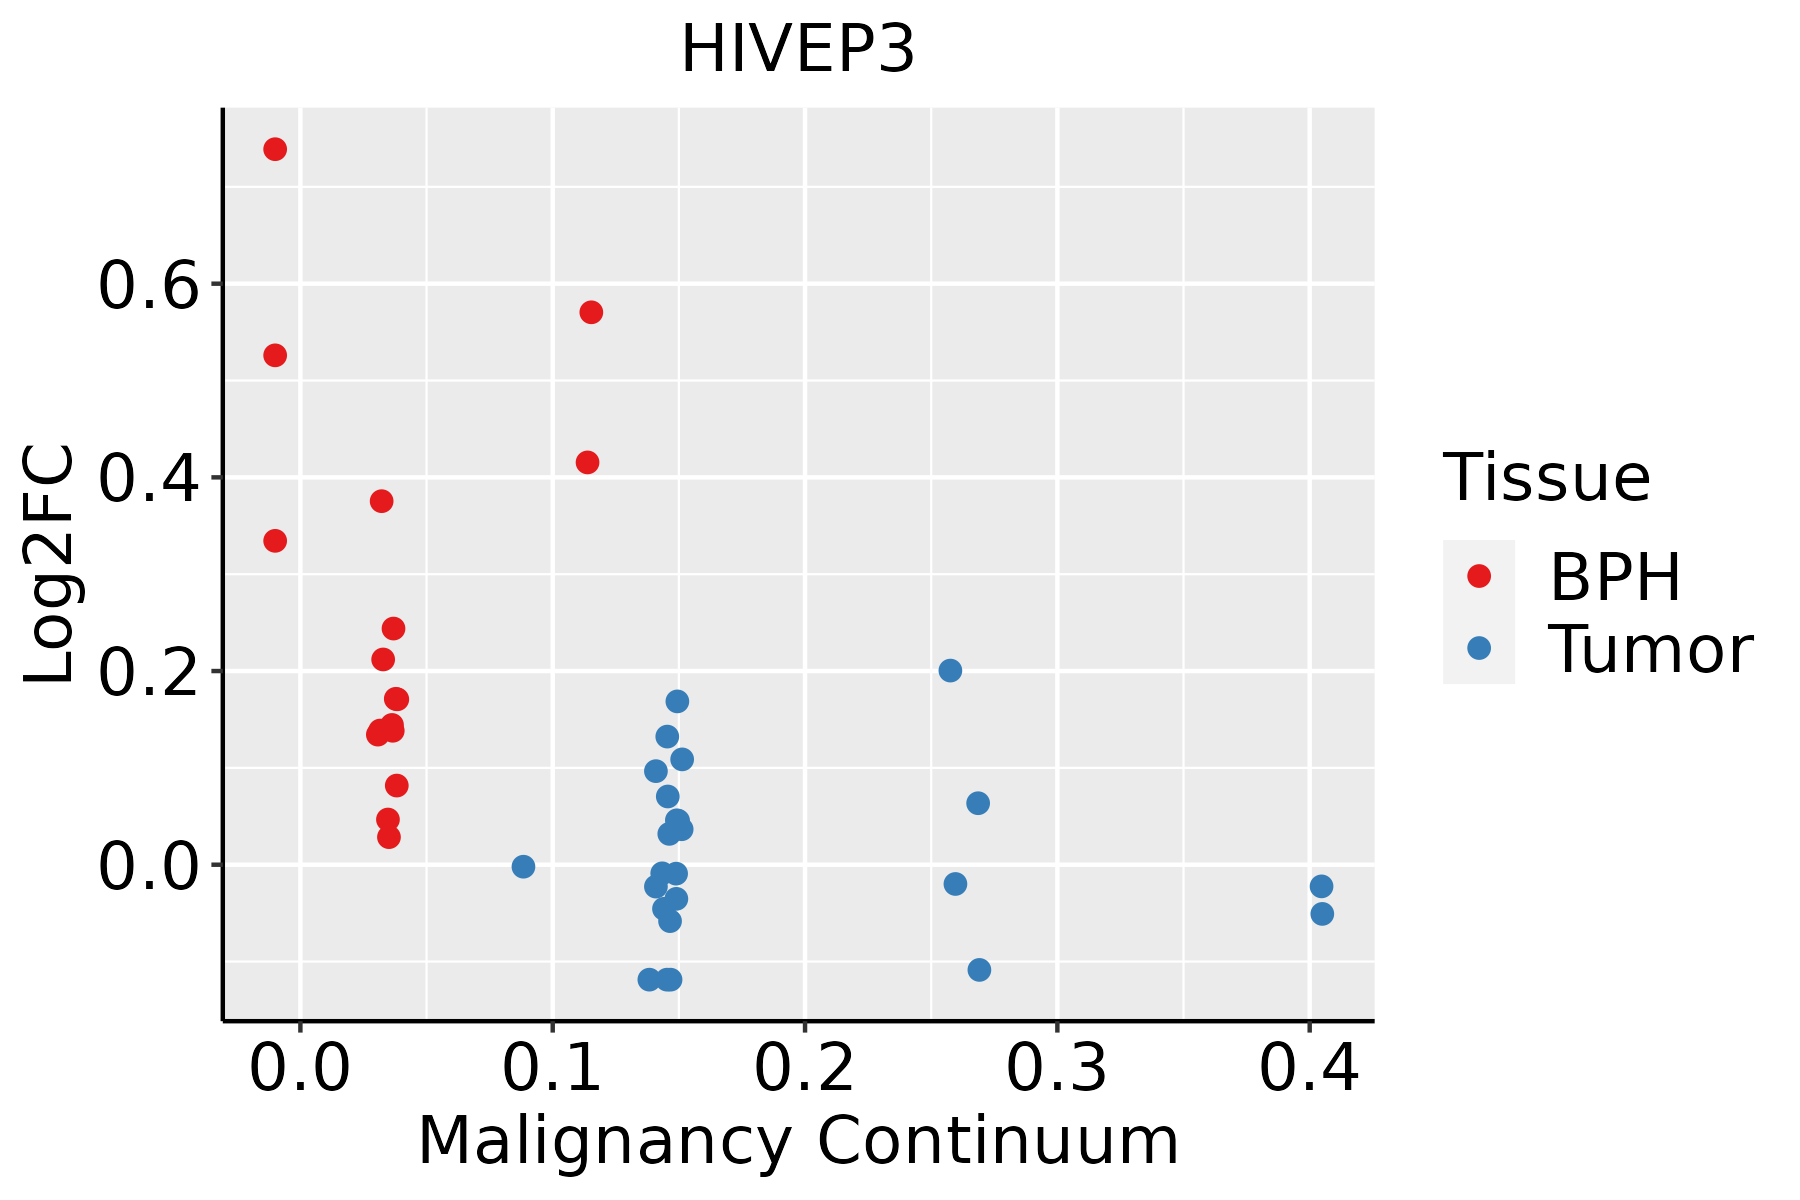 | BPH: Benign Prostatic Hyperplasia |
| Skin |  | AK: Actinic keratosis |
| cSCC: Cutaneous squamous cell carcinoma |
| SCCIS:squamous cell carcinoma in situ |
| GO ID | Tissue | Disease Stage | Description | Gene Ratio | Bg Ratio | pvalue | p.adjust | Count |
| GO:00605375 | Cervix | CC | muscle tissue development | 76/2311 | 403/18723 | 9.76e-05 | 1.27e-03 | 76 |
| GO:00147064 | Cervix | CC | striated muscle tissue development | 72/2311 | 384/18723 | 1.76e-04 | 2.07e-03 | 72 |
| GO:00075173 | Cervix | CC | muscle organ development | 58/2311 | 327/18723 | 2.73e-03 | 1.85e-02 | 58 |
| GO:00075192 | Cervix | CC | skeletal muscle tissue development | 30/2311 | 155/18723 | 7.97e-03 | 4.18e-02 | 30 |
| GO:006053716 | Esophagus | ESCC | muscle tissue development | 211/8552 | 403/18723 | 3.84e-03 | 1.56e-02 | 211 |
| GO:001470615 | Esophagus | ESCC | striated muscle tissue development | 197/8552 | 384/18723 | 1.46e-02 | 4.74e-02 | 197 |
| GO:00605373 | Lung | IAC | muscle tissue development | 61/2061 | 403/18723 | 6.24e-03 | 4.48e-02 | 61 |
| GO:00605371 | Lung | AIS | muscle tissue development | 58/1849 | 403/18723 | 2.22e-03 | 2.37e-02 | 58 |
| GO:0060538 | Lung | AAH | skeletal muscle organ development | 14/613 | 166/18723 | 1.15e-03 | 3.33e-02 | 14 |
| GO:0007517 | Lung | AAH | muscle organ development | 22/613 | 327/18723 | 1.20e-03 | 3.33e-02 | 22 |
| GO:0007519 | Lung | AAH | skeletal muscle tissue development | 13/613 | 155/18723 | 1.79e-03 | 4.22e-02 | 13 |
| GO:00605372 | Lung | AAH | muscle tissue development | 25/613 | 403/18723 | 1.79e-03 | 4.22e-02 | 25 |
| GO:00605378 | Oral cavity | OSCC | muscle tissue development | 185/7305 | 403/18723 | 2.60e-03 | 1.14e-02 | 185 |
| GO:00147067 | Oral cavity | OSCC | striated muscle tissue development | 174/7305 | 384/18723 | 6.45e-03 | 2.40e-02 | 174 |
| GO:006053715 | Oral cavity | EOLP | muscle tissue development | 77/2218 | 403/18723 | 1.37e-05 | 2.31e-04 | 77 |
| GO:001470614 | Oral cavity | EOLP | striated muscle tissue development | 72/2218 | 384/18723 | 4.87e-05 | 6.43e-04 | 72 |
| GO:00605384 | Oral cavity | EOLP | skeletal muscle organ development | 35/2218 | 166/18723 | 4.65e-04 | 4.08e-03 | 35 |
| GO:00075195 | Oral cavity | EOLP | skeletal muscle tissue development | 32/2218 | 155/18723 | 1.15e-03 | 8.37e-03 | 32 |
| GO:00075176 | Oral cavity | EOLP | muscle organ development | 57/2218 | 327/18723 | 1.76e-03 | 1.15e-02 | 57 |
| GO:006053723 | Oral cavity | NEOLP | muscle tissue development | 75/2005 | 403/18723 | 1.22e-06 | 3.15e-05 | 75 |
| TF | Cell Type | Tissue | Disease Stage | Target Gene | RSS | Regulon Activity |
| HIVEP3 | IMGOB | Colorectum | ADJ | GRAMD1B,ABCA5,LINC00278, etc. | 9.63e-02 |  |
| HIVEP3 | IMENT | Colorectum | CRC | GRAMD1B,ABCA5,LINC00278, etc. | 6.57e-02 |  |
| HIVEP3 | GOB | Colorectum | CRC | GRAMD1B,ABCA5,LINC00278, etc. | 4.11e-02 | |
| HIVEP3 | PLA | Endometrium | Healthy | TAF4B,POLR3C,PARD6B, etc. | 0.00e+00 |  |
| HIVEP3 | CD8TEXINT | Endometrium | Healthy | TAF4B,POLR3C,PARD6B, etc. | 0.00e+00 | |
| HIVEP3 | NK | Lung | IAC | AP005482.1,SLC16A1-AS1,AC243829.2, etc. | 4.35e-02 |  |
| HIVEP3 | MEGA | Pancreas | PDAC | ARL8B,AC026202.2,DCBLD2, etc. | 5.47e-05 |  |
| HIVEP3 | MSC | Pancreas | PDAC | ARL8B,AC026202.2,DCBLD2, etc. | 1.30e-01 | |
| HIVEP3 | LYMEND | Pancreas | PDAC | ARL8B,AC026202.2,DCBLD2, etc. | 0.00e+00 | |
| HIVEP3 | APCAF | Pancreas | PDAC | ARL8B,AC026202.2,DCBLD2, etc. | 2.70e-04 | |
| Hugo Symbol | Variant Class | Variant Classification | dbSNP RS | HGVSc | HGVSp | HGVSp Short | SWISSPROT | BIOTYPE | SIFT | PolyPhen | Tumor Sample Barcode | Tissue | Histology | Sex | Age | Stage | Therapy Types | Drugs | Outcome |
| HIVEP3 | SNV | Missense_Mutation | rs751390922 | c.1754N>A | p.Arg585Gln | p.R585Q | Q5T1R4 | protein_coding | deleterious(0) | probably_damaging(0.992) | TCGA-A2-A0YM-01 | Breast | breast invasive carcinoma | Female | >=65 | I/II | Unknown | Unknown | SD |
| HIVEP3 | SNV | Missense_Mutation | | c.5599G>C | p.Glu1867Gln | p.E1867Q | Q5T1R4 | protein_coding | deleterious_low_confidence(0.02) | probably_damaging(0.965) | TCGA-AC-A23H-01 | Breast | breast invasive carcinoma | Female | >=65 | I/II | Unknown | Unknown | PD |
| HIVEP3 | SNV | Missense_Mutation | | c.3122G>C | p.Arg1041Thr | p.R1041T | Q5T1R4 | protein_coding | deleterious(0) | probably_damaging(0.941) | TCGA-AC-A23H-01 | Breast | breast invasive carcinoma | Female | >=65 | I/II | Unknown | Unknown | PD |
| HIVEP3 | SNV | Missense_Mutation | | c.2695G>C | p.Glu899Gln | p.E899Q | Q5T1R4 | protein_coding | deleterious(0) | probably_damaging(0.994) | TCGA-AC-A23H-01 | Breast | breast invasive carcinoma | Female | >=65 | I/II | Unknown | Unknown | PD |
| HIVEP3 | SNV | Missense_Mutation | | c.1879G>A | p.Glu627Lys | p.E627K | Q5T1R4 | protein_coding | tolerated(0.15) | benign(0.078) | TCGA-AC-A23H-01 | Breast | breast invasive carcinoma | Female | >=65 | I/II | Unknown | Unknown | PD |
| HIVEP3 | SNV | Missense_Mutation | novel | c.6675C>A | p.Phe2225Leu | p.F2225L | Q5T1R4 | protein_coding | deleterious_low_confidence(0.01) | benign(0.056) | TCGA-AN-A046-01 | Breast | breast invasive carcinoma | Female | >=65 | I/II | Unknown | Unknown | SD |
| HIVEP3 | SNV | Missense_Mutation | rs560610413 | c.964G>A | p.Glu322Lys | p.E322K | Q5T1R4 | protein_coding | tolerated(0.05) | benign(0.122) | TCGA-AN-A046-01 | Breast | breast invasive carcinoma | Female | >=65 | I/II | Unknown | Unknown | SD |
| HIVEP3 | SNV | Missense_Mutation | | c.3149N>T | p.Ser1050Phe | p.S1050F | Q5T1R4 | protein_coding | deleterious(0) | probably_damaging(0.996) | TCGA-AO-A03V-01 | Breast | breast invasive carcinoma | Female | <65 | I/II | Chemotherapy | fluorouracil | SD |
| HIVEP3 | SNV | Missense_Mutation | | c.4310N>T | p.Ser1437Ile | p.S1437I | Q5T1R4 | protein_coding | deleterious(0) | probably_damaging(0.998) | TCGA-AO-A0J6-01 | Breast | breast invasive carcinoma | Female | <65 | I/II | Chemotherapy | doxorubicin | SD |
| HIVEP3 | SNV | Missense_Mutation | rs377282990 | c.6232N>A | p.Glu2078Lys | p.E2078K | Q5T1R4 | protein_coding | tolerated(0.57) | benign(0.073) | TCGA-B6-A0I8-01 | Breast | breast invasive carcinoma | Female | <65 | I/II | Unknown | Unknown | PD |


