
|
|||||
|
 | |
| |
| |
| |
| |
| |
|
Gene: HIVEP2 |
Gene summary for HIVEP2 |
| Gene information | Species | Human | Gene symbol | HIVEP2 | Gene ID | 3097 |
| Gene name | HIVEP zinc finger 2 | |
| Gene Alias | HIV-EP2 | |
| Cytomap | 6q24.2 | |
| Gene Type | protein-coding | GO ID | GO:0006139 | UniProtAcc | P31629 |
Top |
Malignant transformation analysis |
| Identification of the aberrant gene expression in precancerous and cancerous lesions by comparing the gene expression of stem-like cells in diseased tissues with normal stem cells |
| Entrez ID | Symbol | Replicates | Species | Organ | Tissue | Adj P-value | Log2FC | Malignancy |
| 3097 | HIVEP2 | CCI_1 | Human | Cervix | CC | 2.89e-10 | 1.01e+00 | 0.528 |
| 3097 | HIVEP2 | CCI_2 | Human | Cervix | CC | 5.21e-11 | 1.17e+00 | 0.5249 |
| 3097 | HIVEP2 | CCI_3 | Human | Cervix | CC | 2.80e-25 | 1.10e+00 | 0.516 |
| 3097 | HIVEP2 | H2 | Human | Cervix | HSIL_HPV | 6.14e-04 | 2.05e-01 | 0.0632 |
| 3097 | HIVEP2 | AEH-subject1 | Human | Endometrium | AEH | 3.63e-52 | 9.78e-01 | -0.3059 |
| 3097 | HIVEP2 | AEH-subject2 | Human | Endometrium | AEH | 6.81e-25 | 6.88e-01 | -0.2525 |
| 3097 | HIVEP2 | AEH-subject3 | Human | Endometrium | AEH | 2.38e-14 | 5.59e-01 | -0.2576 |
| 3097 | HIVEP2 | AEH-subject4 | Human | Endometrium | AEH | 3.13e-25 | 7.83e-01 | -0.2657 |
| 3097 | HIVEP2 | AEH-subject5 | Human | Endometrium | AEH | 7.29e-55 | 1.27e+00 | -0.2953 |
| 3097 | HIVEP2 | EEC-subject1 | Human | Endometrium | EEC | 3.12e-35 | 8.38e-01 | -0.2682 |
| 3097 | HIVEP2 | EEC-subject2 | Human | Endometrium | EEC | 3.15e-22 | 6.27e-01 | -0.2607 |
| 3097 | HIVEP2 | EEC-subject3 | Human | Endometrium | EEC | 8.70e-31 | 7.32e-01 | -0.2525 |
| 3097 | HIVEP2 | EEC-subject4 | Human | Endometrium | EEC | 2.46e-26 | 7.53e-01 | -0.2571 |
| 3097 | HIVEP2 | EEC-subject5 | Human | Endometrium | EEC | 3.47e-16 | 5.47e-01 | -0.249 |
| 3097 | HIVEP2 | GSM5276934 | Human | Endometrium | EEC | 1.07e-08 | 3.60e-01 | -0.0913 |
| 3097 | HIVEP2 | GSM5276937 | Human | Endometrium | EEC | 8.67e-04 | 2.59e-01 | -0.0897 |
| 3097 | HIVEP2 | GSM6177620_NYU_UCEC1_lib1_lib1 | Human | Endometrium | EEC | 1.25e-06 | -6.37e-03 | -0.1869 |
| 3097 | HIVEP2 | GSM6177620_NYU_UCEC1_lib2_lib2 | Human | Endometrium | EEC | 1.20e-02 | -3.85e-02 | -0.1875 |
| 3097 | HIVEP2 | GSM6177620_NYU_UCEC1_lib3_lib3 | Human | Endometrium | EEC | 1.12e-05 | -7.23e-03 | -0.1883 |
| 3097 | HIVEP2 | GSM6177622_NYU_UCEC3_lib1_lib1 | Human | Endometrium | EEC | 2.74e-09 | 8.34e-02 | -0.1917 |
| Page: 1 2 3 4 5 |
| Tissue | Expression Dynamics | Abbreviation |
| Cervix | 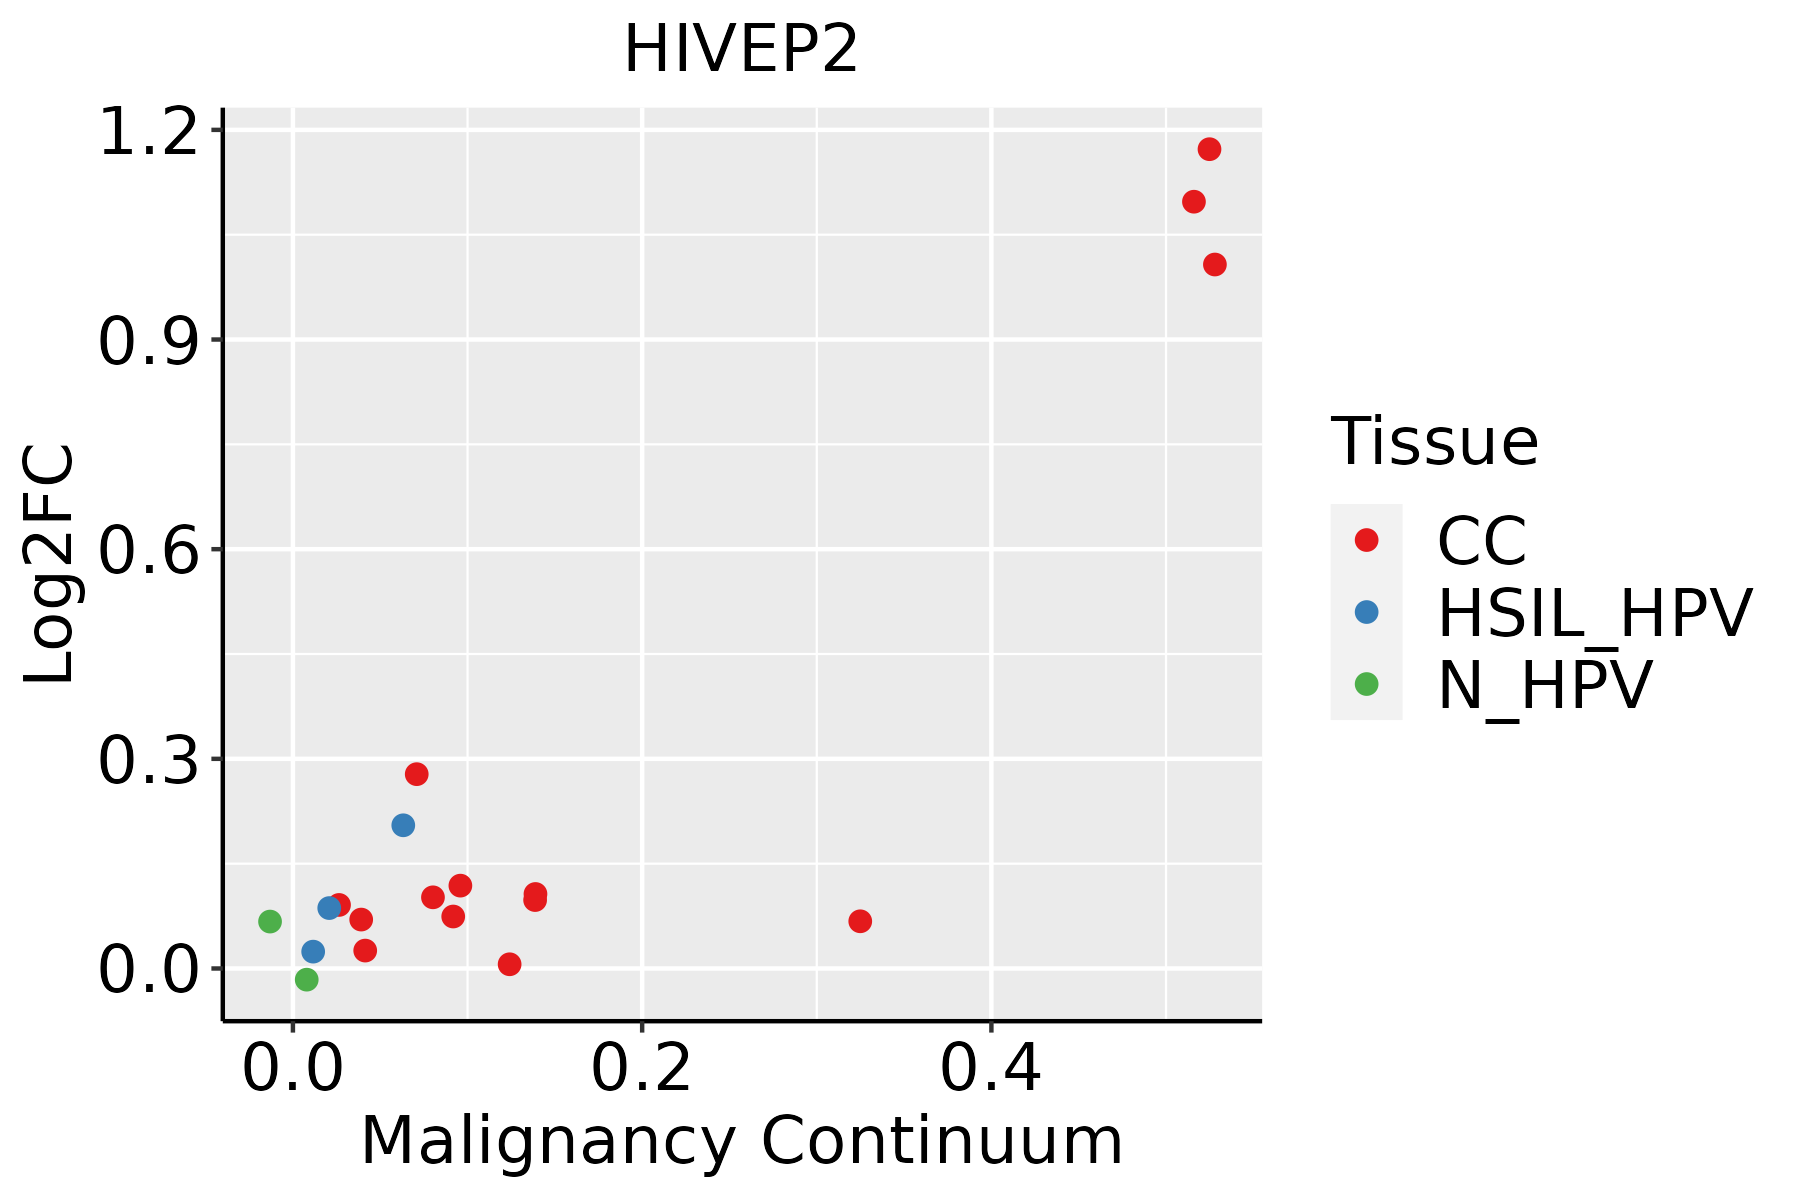 | CC: Cervix cancer |
| HSIL_HPV: HPV-infected high-grade squamous intraepithelial lesions | ||
| N_HPV: HPV-infected normal cervix | ||
| Endometrium |  | AEH: Atypical endometrial hyperplasia |
| EEC: Endometrioid Cancer | ||
| Lung |  | AAH: Atypical adenomatous hyperplasia |
| AIS: Adenocarcinoma in situ | ||
| IAC: Invasive lung adenocarcinoma | ||
| MIA: Minimally invasive adenocarcinoma | ||
| Oral Cavity | 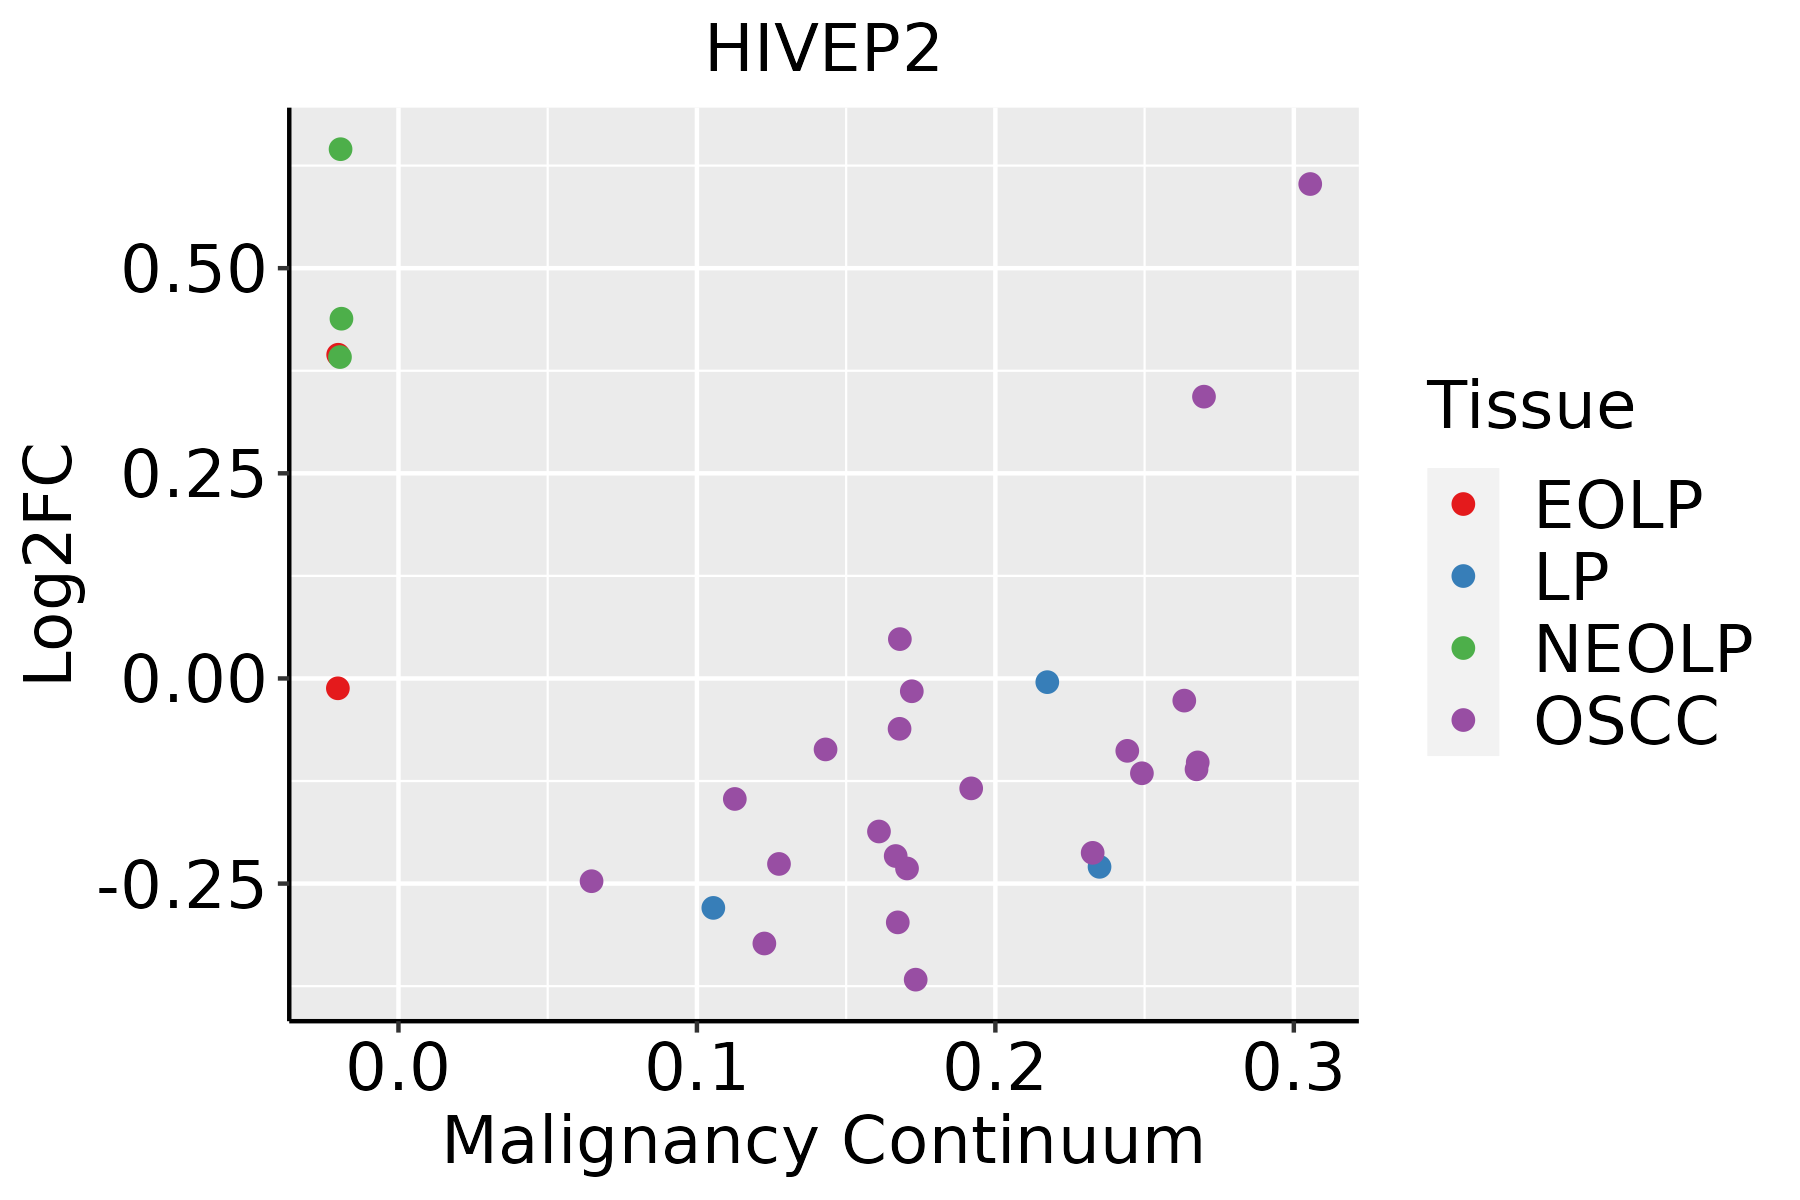 | EOLP: Erosive Oral lichen planus |
| LP: leukoplakia | ||
| NEOLP: Non-erosive oral lichen planus | ||
| OSCC: Oral squamous cell carcinoma | ||
| Prostate | 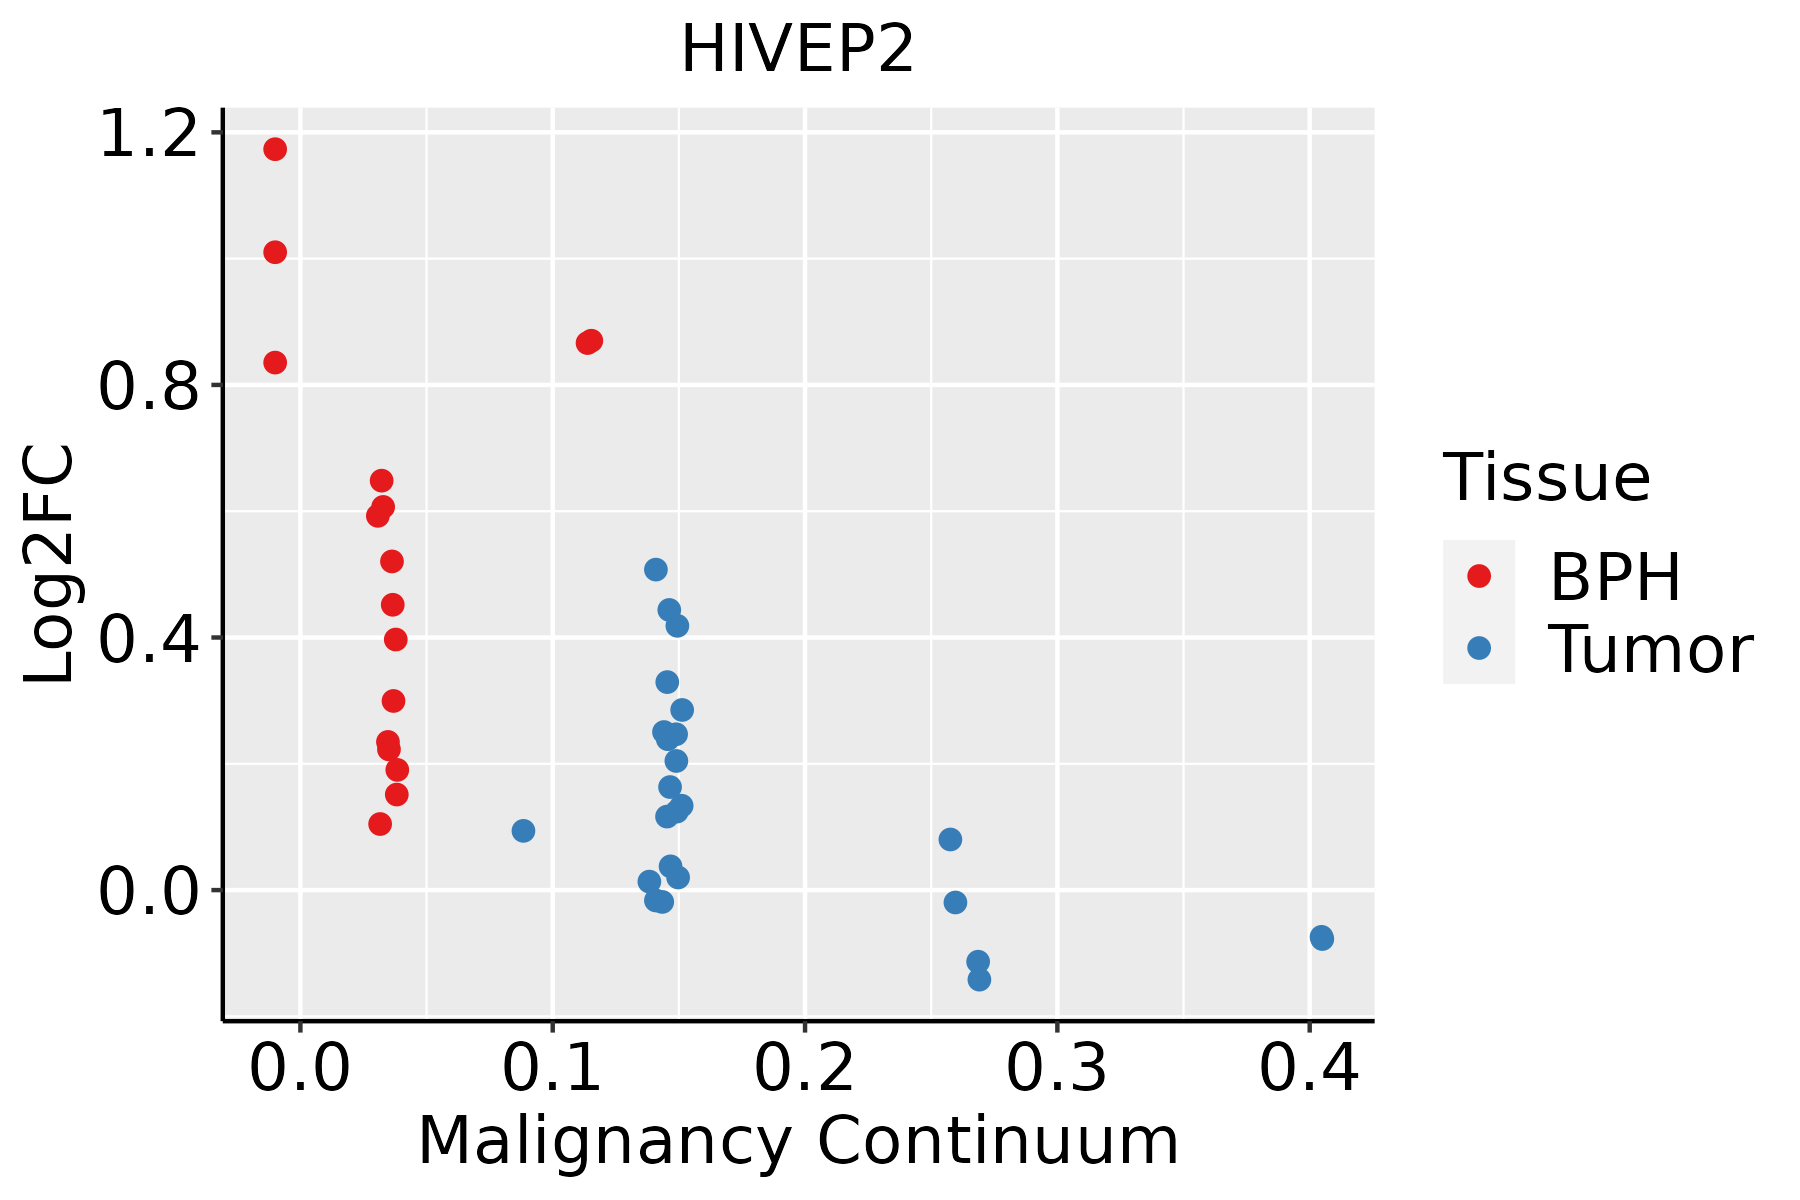 | BPH: Benign Prostatic Hyperplasia |
| Skin | 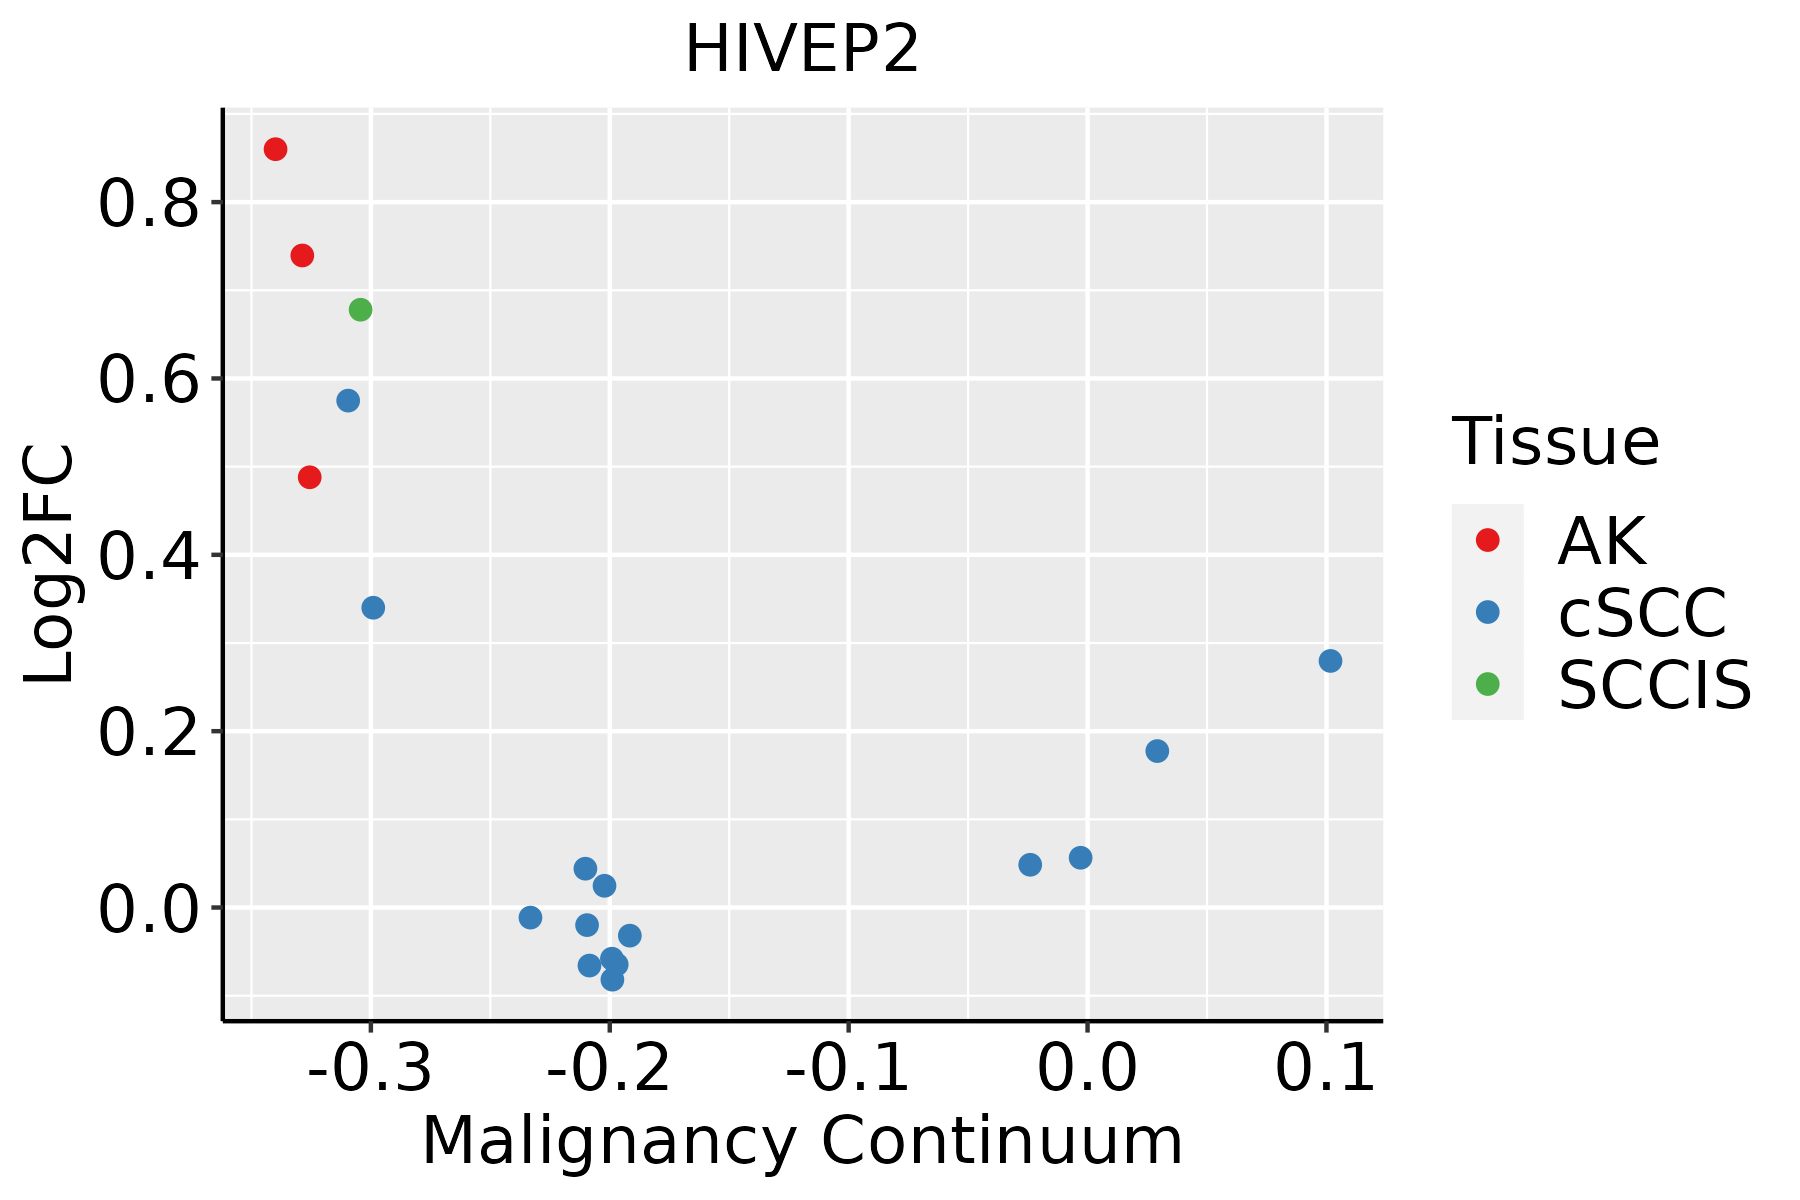 | AK: Actinic keratosis |
| cSCC: Cutaneous squamous cell carcinoma | ||
| SCCIS:squamous cell carcinoma in situ |
| ∗log2FC in expression of this searched gene in stem-like cells from each diseased tissue sample relative to stem-like cells in normal samples in each tissue plotted against the malignancy continuum. Samples are colored based on if they are from different disease stage. |
Top |
Malignant transformation related pathway analysis |
| Find out the enriched GO biological processes and KEGG pathways involved in transition from healthy to precancer to cancer |
| Tissue | Disease Stage | Enriched GO biological Processes |
| Colorectum | AD |  |
| Colorectum | SER |  |
| Colorectum | MSS |  |
| Colorectum | MSI-H |  |
| Colorectum | FAP |  |
| ∗Top 15 enriched GO BP terms are showed in the bar plot of each disease state in each tissue. Each row represents a significant GO biological process which is colored according to the -log10(p.adjust). |
| Page: 1 2 3 4 5 6 7 8 9 |
| GO ID | Tissue | Disease Stage | Description | Gene Ratio | Bg Ratio | pvalue | p.adjust | Count |
| Page: 1 |
| Pathway ID | Tissue | Disease Stage | Description | Gene Ratio | Bg Ratio | pvalue | p.adjust | qvalue | Count |
| Page: 1 |
Top |
Cell-cell communication analysis |
| Identification of potential cell-cell interactions between two cell types and their ligand-receptor pairs for different disease states |
| Ligand | Receptor | LRpair | Pathway | Tissue | Disease Stage |
| Page: 1 |
Top |
Single-cell gene regulatory network inference analysis |
| Find out the significant the regulons (TFs) and the target genes of each regulon across cell types for different disease states |
| TF | Cell Type | Tissue | Disease Stage | Target Gene | RSS | Regulon Activity |
| HIVEP2 | INMON | Breast | Healthy | FHL3,CSRNP2,NBPF19, etc. | 1.94e-01 |  |
| HIVEP2 | CAF | Breast | IDC | ATP13A3,PLPP3,NFKB1, etc. | 4.05e-02 |  |
| HIVEP2 | CAF | Breast | Precancer | ATP13A3,PLPP3,NFKB1, etc. | 2.53e-01 |  |
| HIVEP2 | MAIT | Liver | Cirrhotic | PTPRM,GADD45B,OGA, etc. | 4.55e-02 |  |
| HIVEP2 | MAIT | Liver | HCC | PTPRM,GADD45B,OGA, etc. | 1.33e-02 |  |
| HIVEP2 | KER | Skin | Healthy | TWF1,RASSF5,NDUFB5, etc. | 1.62e-01 |  |
| HIVEP2 | BAS | Skin | Healthy | TWF1,RASSF5,NDUFB5, etc. | 1.41e-01 | |
| HIVEP2 | GOB | Stomach | Healthy | LINC00152,CAST,TIMP1, etc. | 4.94e-01 |  |
| HIVEP2 | PTC | Thyroid | ADJ | SOSTDC1,RAB15,PKP2, etc. | 1.61e-01 |  |
| HIVEP2 | TREG | Thyroid | ADJ | MCC,TCF7,RASGRF2, etc. | 1.58e-01 | |
| ∗The dot plots of a searched regulon are shown for all cell subpopulations in each disease state of each tissue based on the regulon specific score inferred using pySCENIC and by calculating the average expression. |
| Page: 1 2 |
Top |
Somatic mutation of malignant transformation related genes |
| Annotation of somatic variants for genes involved in malignant transformation |
| Hugo Symbol | Variant Class | Variant Classification | dbSNP RS | HGVSc | HGVSp | HGVSp Short | SWISSPROT | BIOTYPE | SIFT | PolyPhen | Tumor Sample Barcode | Tissue | Histology | Sex | Age | Stage | Therapy Types | Drugs | Outcome |
| HIVEP2 | SNV | Missense_Mutation | novel | c.1516N>A | p.Gln506Lys | p.Q506K | P31629 | protein_coding | tolerated(0.11) | benign(0.024) | TCGA-A7-A0DB-01 | Breast | breast invasive carcinoma | Female | <65 | I/II | Hormone Therapy | arimidex | SD |
| HIVEP2 | SNV | Missense_Mutation | c.4517N>G | p.Asp1506Gly | p.D1506G | P31629 | protein_coding | tolerated(0.1) | possibly_damaging(0.707) | TCGA-A7-A26F-01 | Breast | breast invasive carcinoma | Female | <65 | I/II | Chemotherapy | taxotere | SD | |
| HIVEP2 | SNV | Missense_Mutation | c.6575N>A | p.Gly2192Asp | p.G2192D | P31629 | protein_coding | tolerated(0.37) | probably_damaging(0.928) | TCGA-A7-A3RF-01 | Breast | breast invasive carcinoma | Female | >=65 | I/II | Hormone Therapy | anastrozole | PD | |
| HIVEP2 | SNV | Missense_Mutation | novel | c.838G>A | p.Asp280Asn | p.D280N | P31629 | protein_coding | deleterious(0) | probably_damaging(0.999) | TCGA-AC-A23H-01 | Breast | breast invasive carcinoma | Female | >=65 | I/II | Unknown | Unknown | PD |
| HIVEP2 | SNV | Missense_Mutation | c.4601G>T | p.Arg1534Met | p.R1534M | P31629 | protein_coding | tolerated(0.18) | benign(0.174) | TCGA-AN-A0AT-01 | Breast | breast invasive carcinoma | Female | <65 | I/II | Unknown | Unknown | SD | |
| HIVEP2 | SNV | Missense_Mutation | c.6290G>T | p.Arg2097Ile | p.R2097I | P31629 | protein_coding | deleterious(0.01) | probably_damaging(0.997) | TCGA-AO-A0JF-01 | Breast | breast invasive carcinoma | Female | >=65 | I/II | Chemotherapy | doxorubicin | SD | |
| HIVEP2 | SNV | Missense_Mutation | novel | c.5661N>G | p.Ser1887Arg | p.S1887R | P31629 | protein_coding | tolerated(0.09) | probably_damaging(0.986) | TCGA-AR-A0U0-01 | Breast | breast invasive carcinoma | Female | >=65 | I/II | Unknown | Unknown | SD |
| HIVEP2 | SNV | Missense_Mutation | c.4483N>A | p.Leu1495Met | p.L1495M | P31629 | protein_coding | deleterious(0.03) | possibly_damaging(0.809) | TCGA-AR-A1AO-01 | Breast | breast invasive carcinoma | Female | <65 | I/II | Chemotherapy | doxorubicin | SD | |
| HIVEP2 | SNV | Missense_Mutation | c.1904N>T | p.Gly635Val | p.G635V | P31629 | protein_coding | tolerated(0.61) | benign(0) | TCGA-BH-A0H9-01 | Breast | breast invasive carcinoma | Female | >=65 | I/II | Hormone Therapy | arimidex | SD | |
| HIVEP2 | SNV | Missense_Mutation | c.337A>G | p.Thr113Ala | p.T113A | P31629 | protein_coding | tolerated(1) | benign(0) | TCGA-BH-A0HA-01 | Breast | breast invasive carcinoma | Female | <65 | I/II | Unknown | Unknown | SD |
| Page: 1 2 3 4 5 6 7 8 9 10 11 12 13 14 15 16 17 18 19 20 21 22 23 24 25 26 27 28 29 30 31 |
Top |
Related drugs of malignant transformation related genes |
| Identification of chemicals and drugs interact with genes involved in malignant transfromation |
| (DGIdb 4.0) |
| Entrez ID | Symbol | Category | Interaction Types | Drug Claim Name | Drug Name | PMIDs |
| Page: 1 |

Copyright 2023-Present -The University of Texas Health Science Center at Houston |