| Tissue | Expression Dynamics | Abbreviation |
| Cervix | 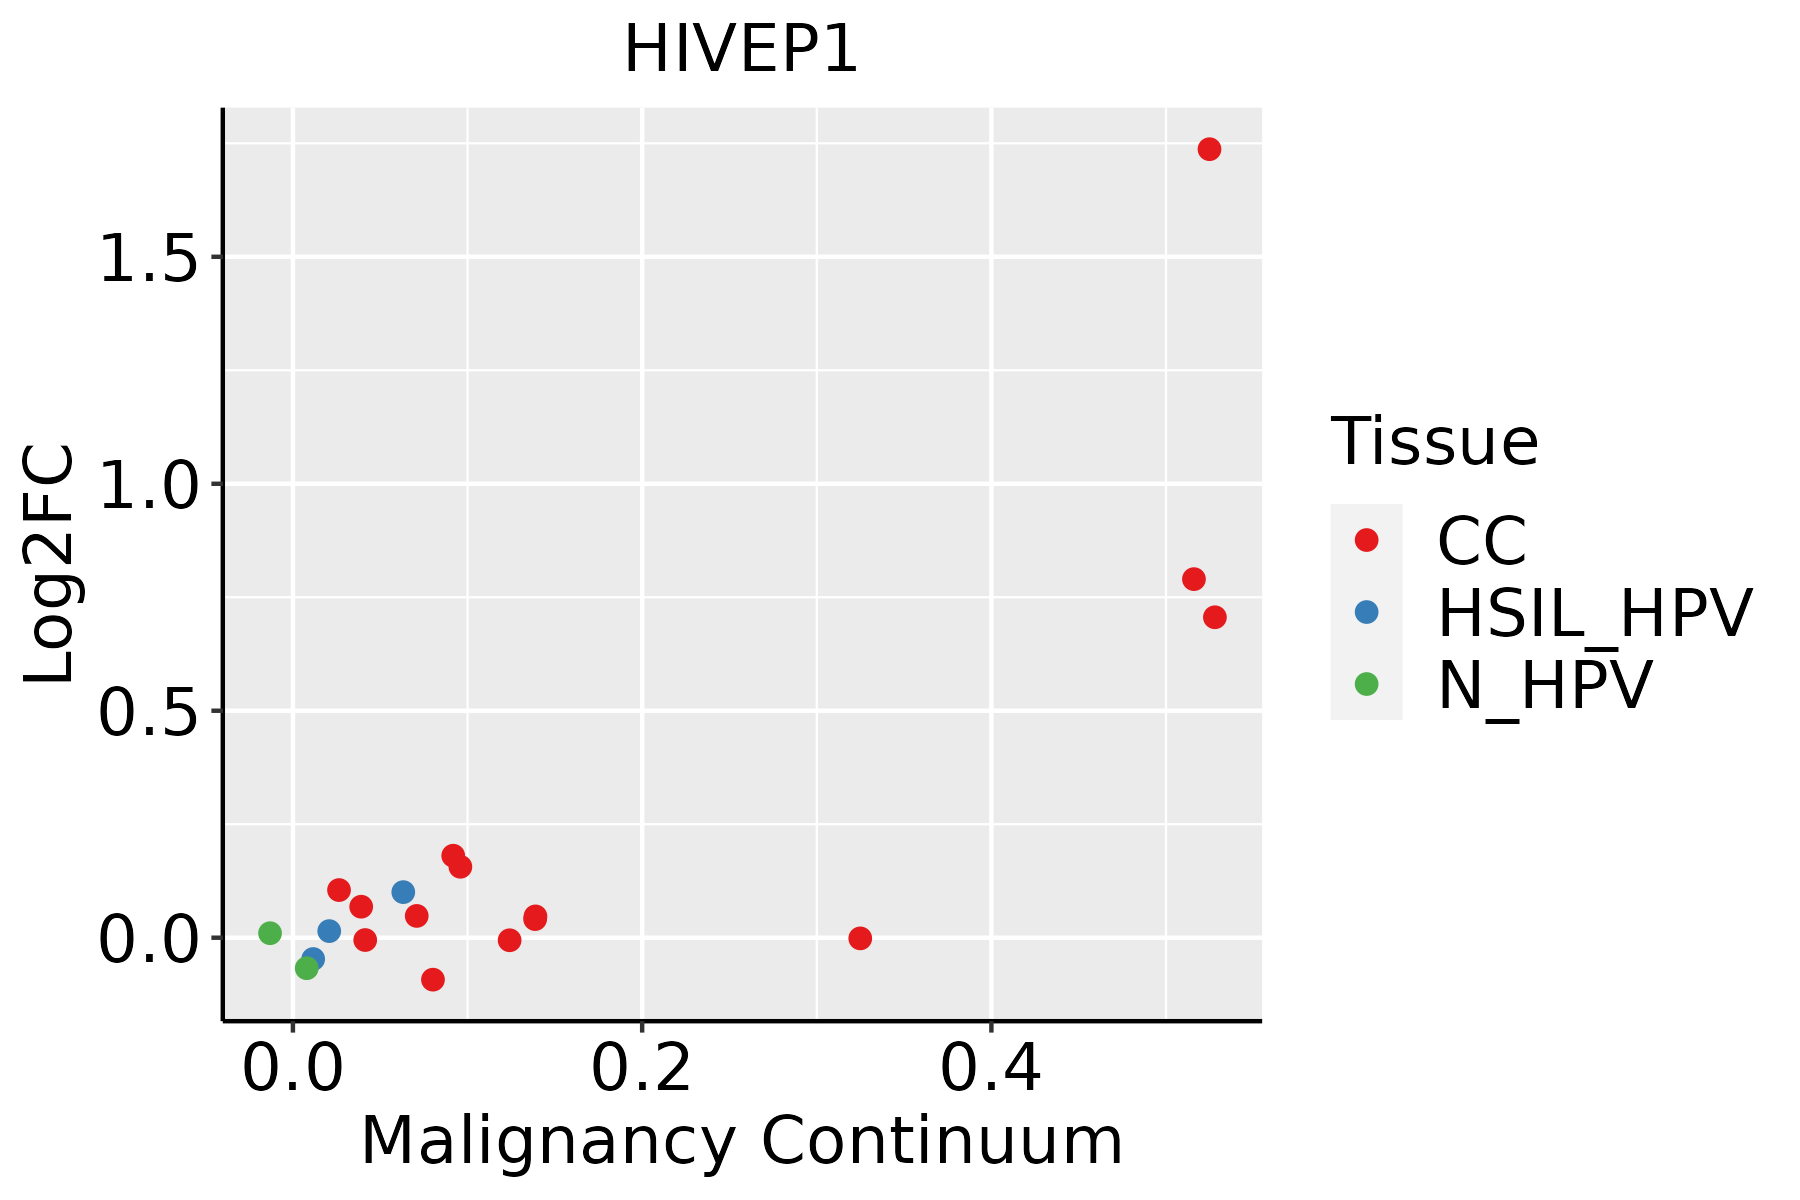 | CC: Cervix cancer |
| HSIL_HPV: HPV-infected high-grade squamous intraepithelial lesions |
| N_HPV: HPV-infected normal cervix |
| Colorectum (GSE201348) | 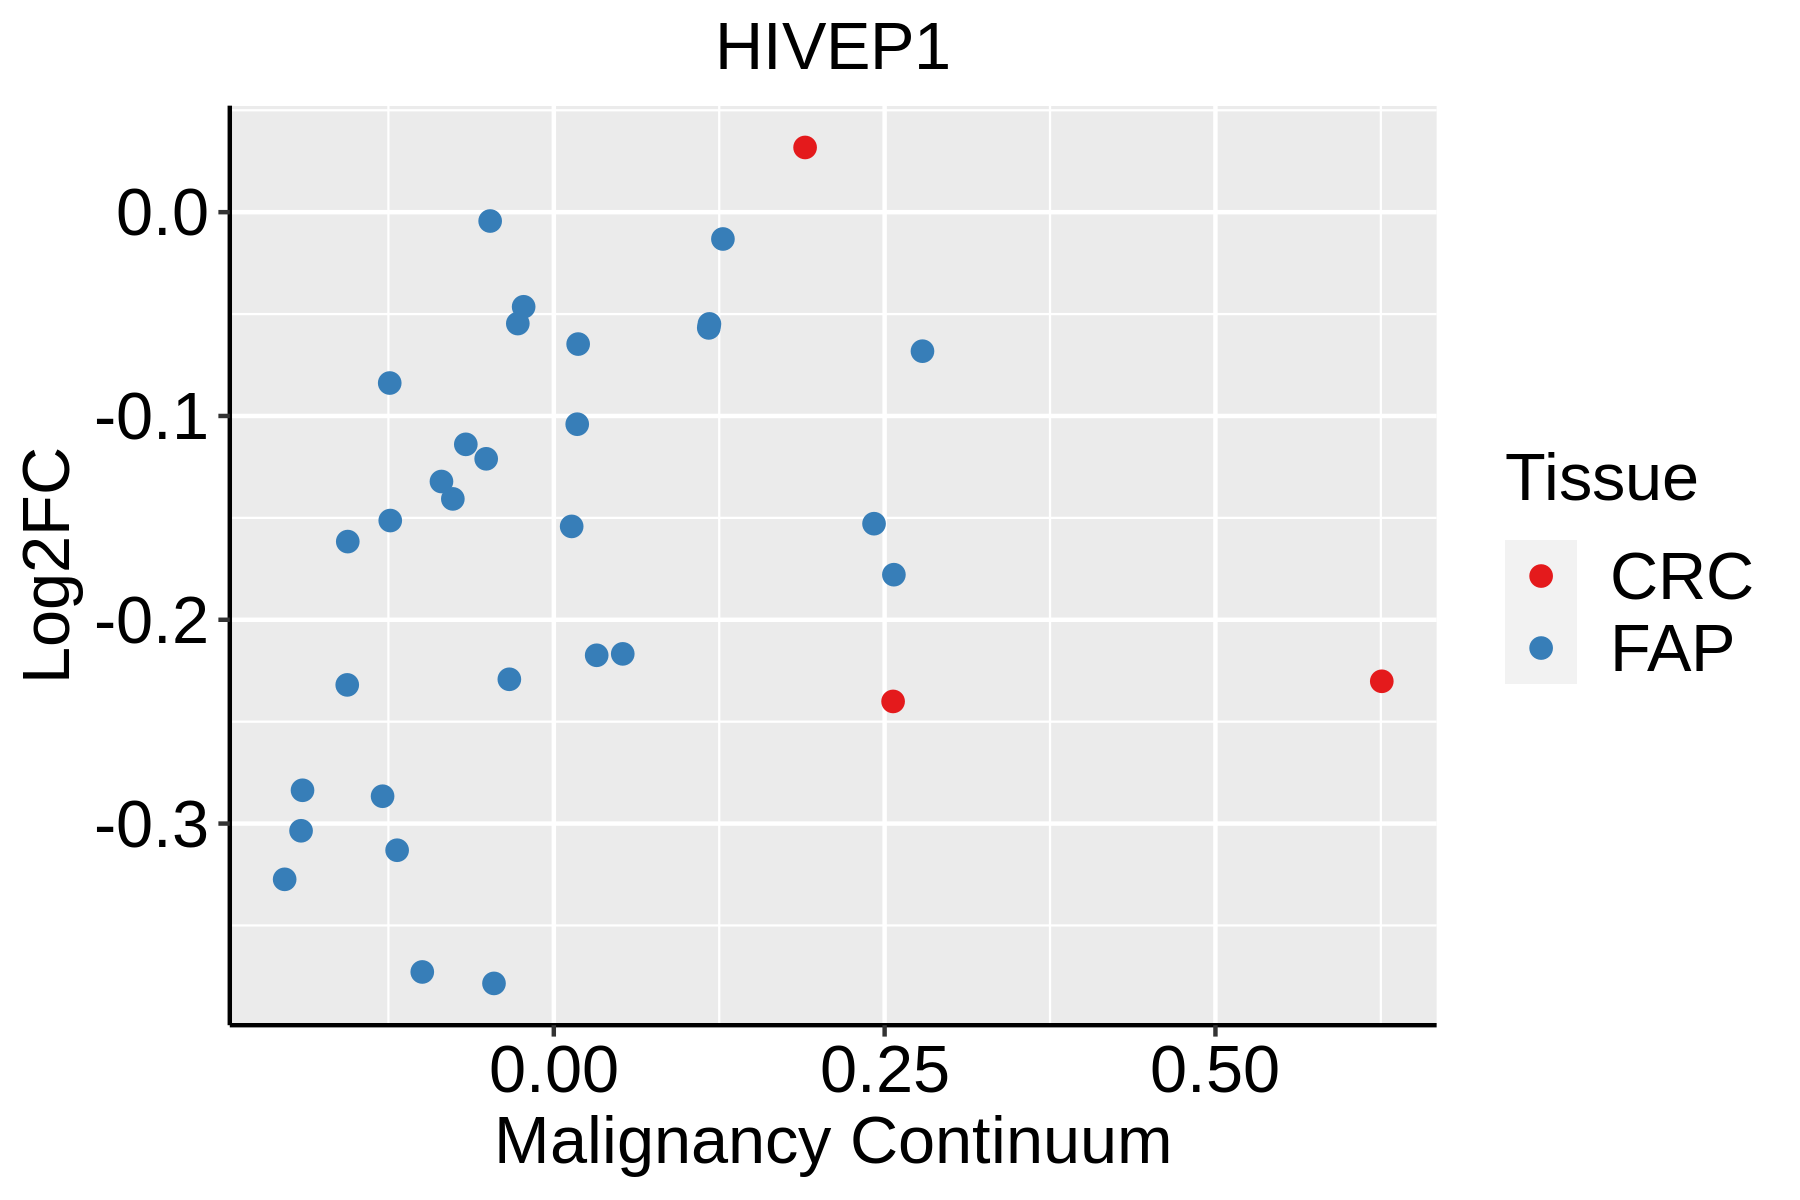 | FAP: Familial adenomatous polyposis |
| CRC: Colorectal cancer |
| Colorectum (HTA11) |  | AD: Adenomas |
| SER: Sessile serrated lesions |
| MSI-H: Microsatellite-high colorectal cancer |
| MSS: Microsatellite stable colorectal cancer |
| Endometrium | 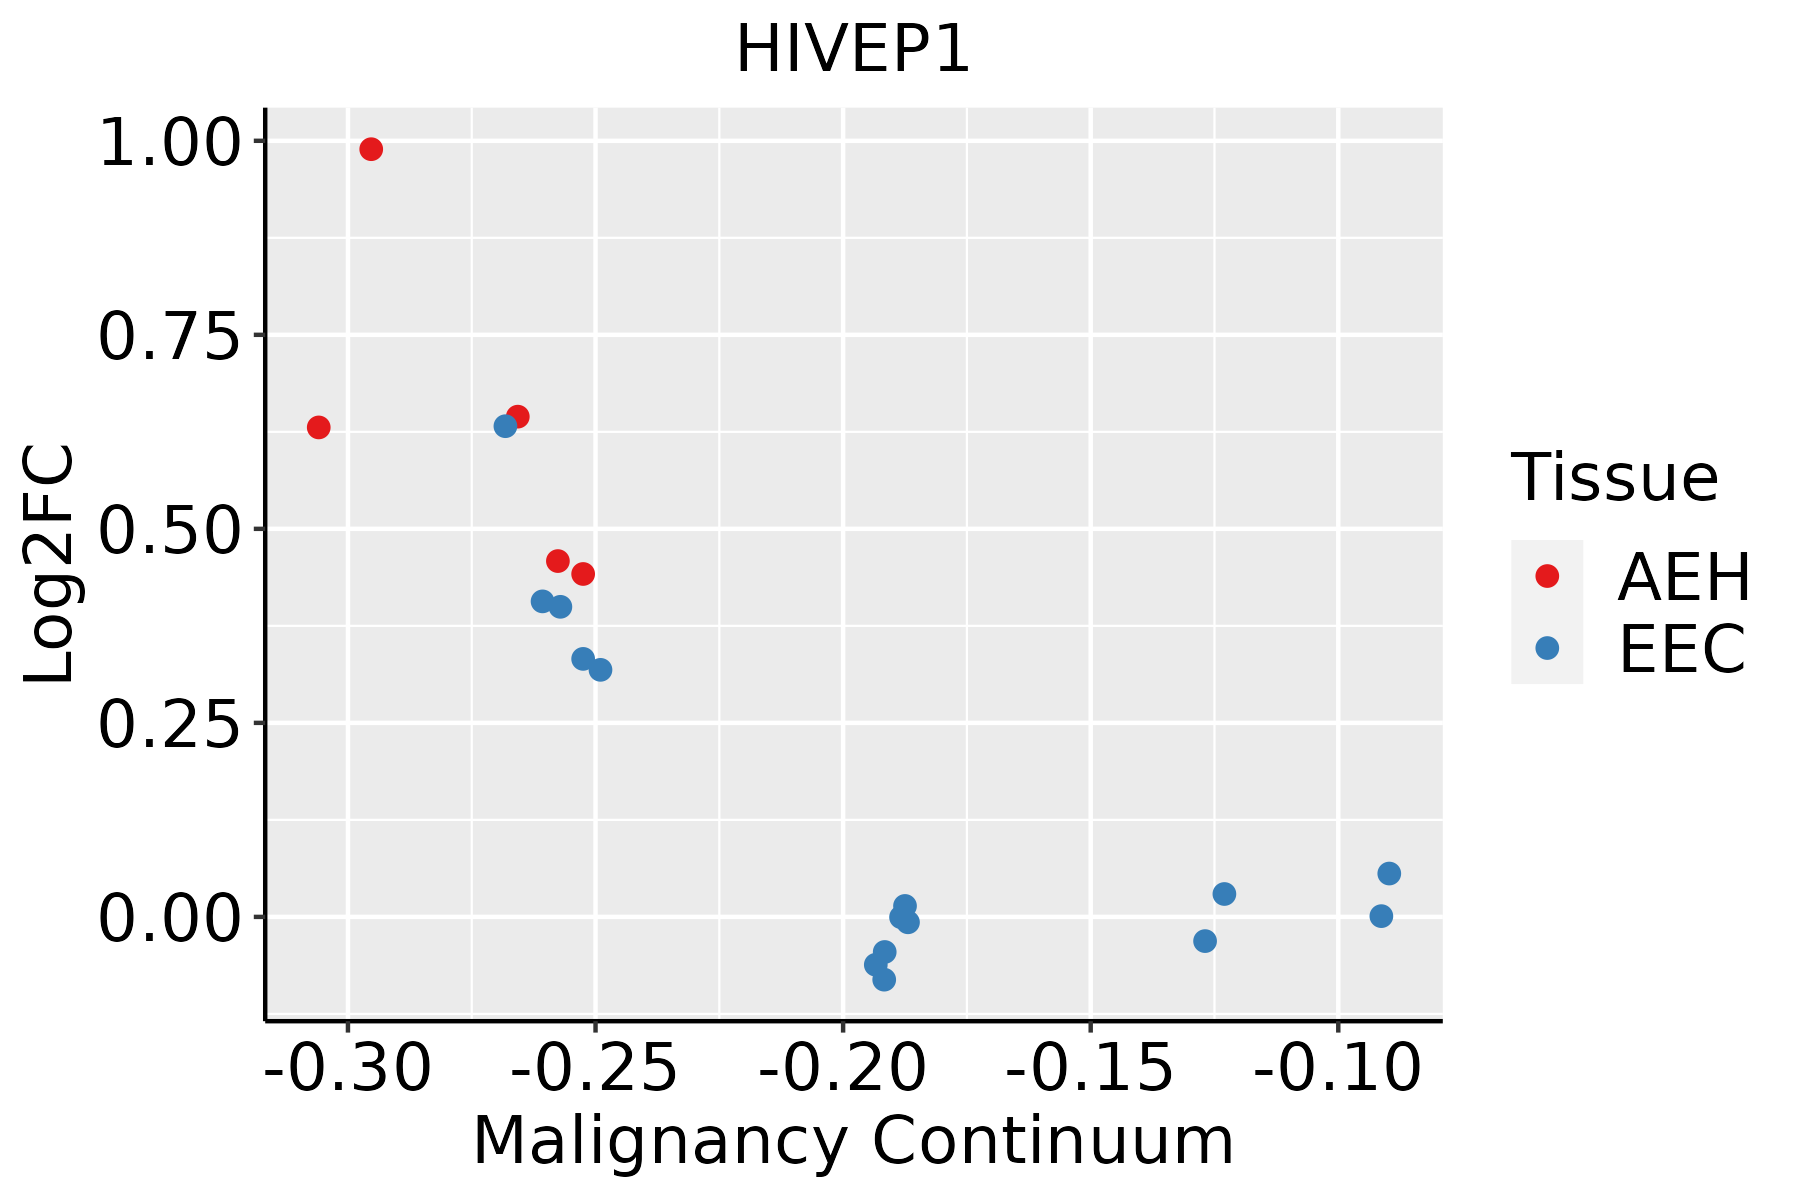 | AEH: Atypical endometrial hyperplasia |
| EEC: Endometrioid Cancer |
| Esophagus | 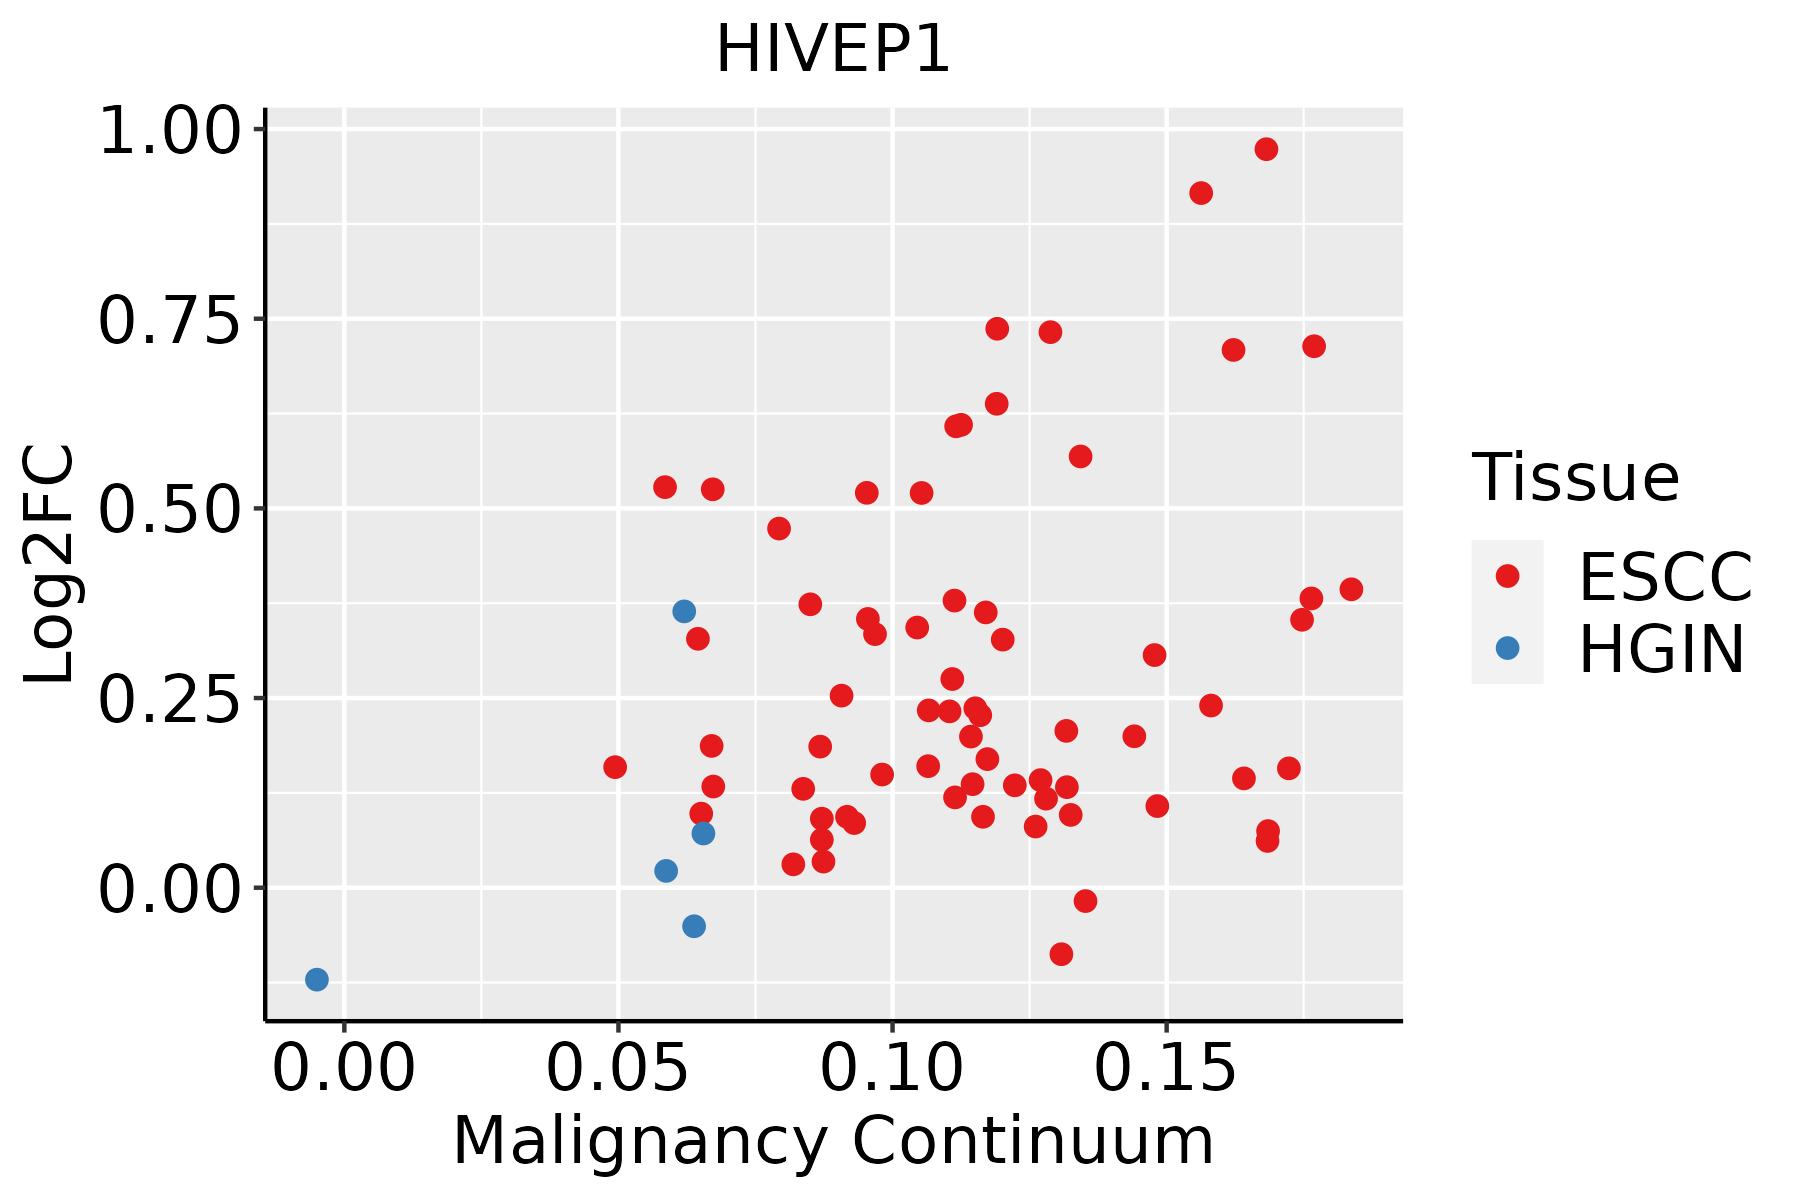 | ESCC: Esophageal squamous cell carcinoma |
| HGIN: High-grade intraepithelial neoplasias |
| LGIN: Low-grade intraepithelial neoplasias |
| Lung | 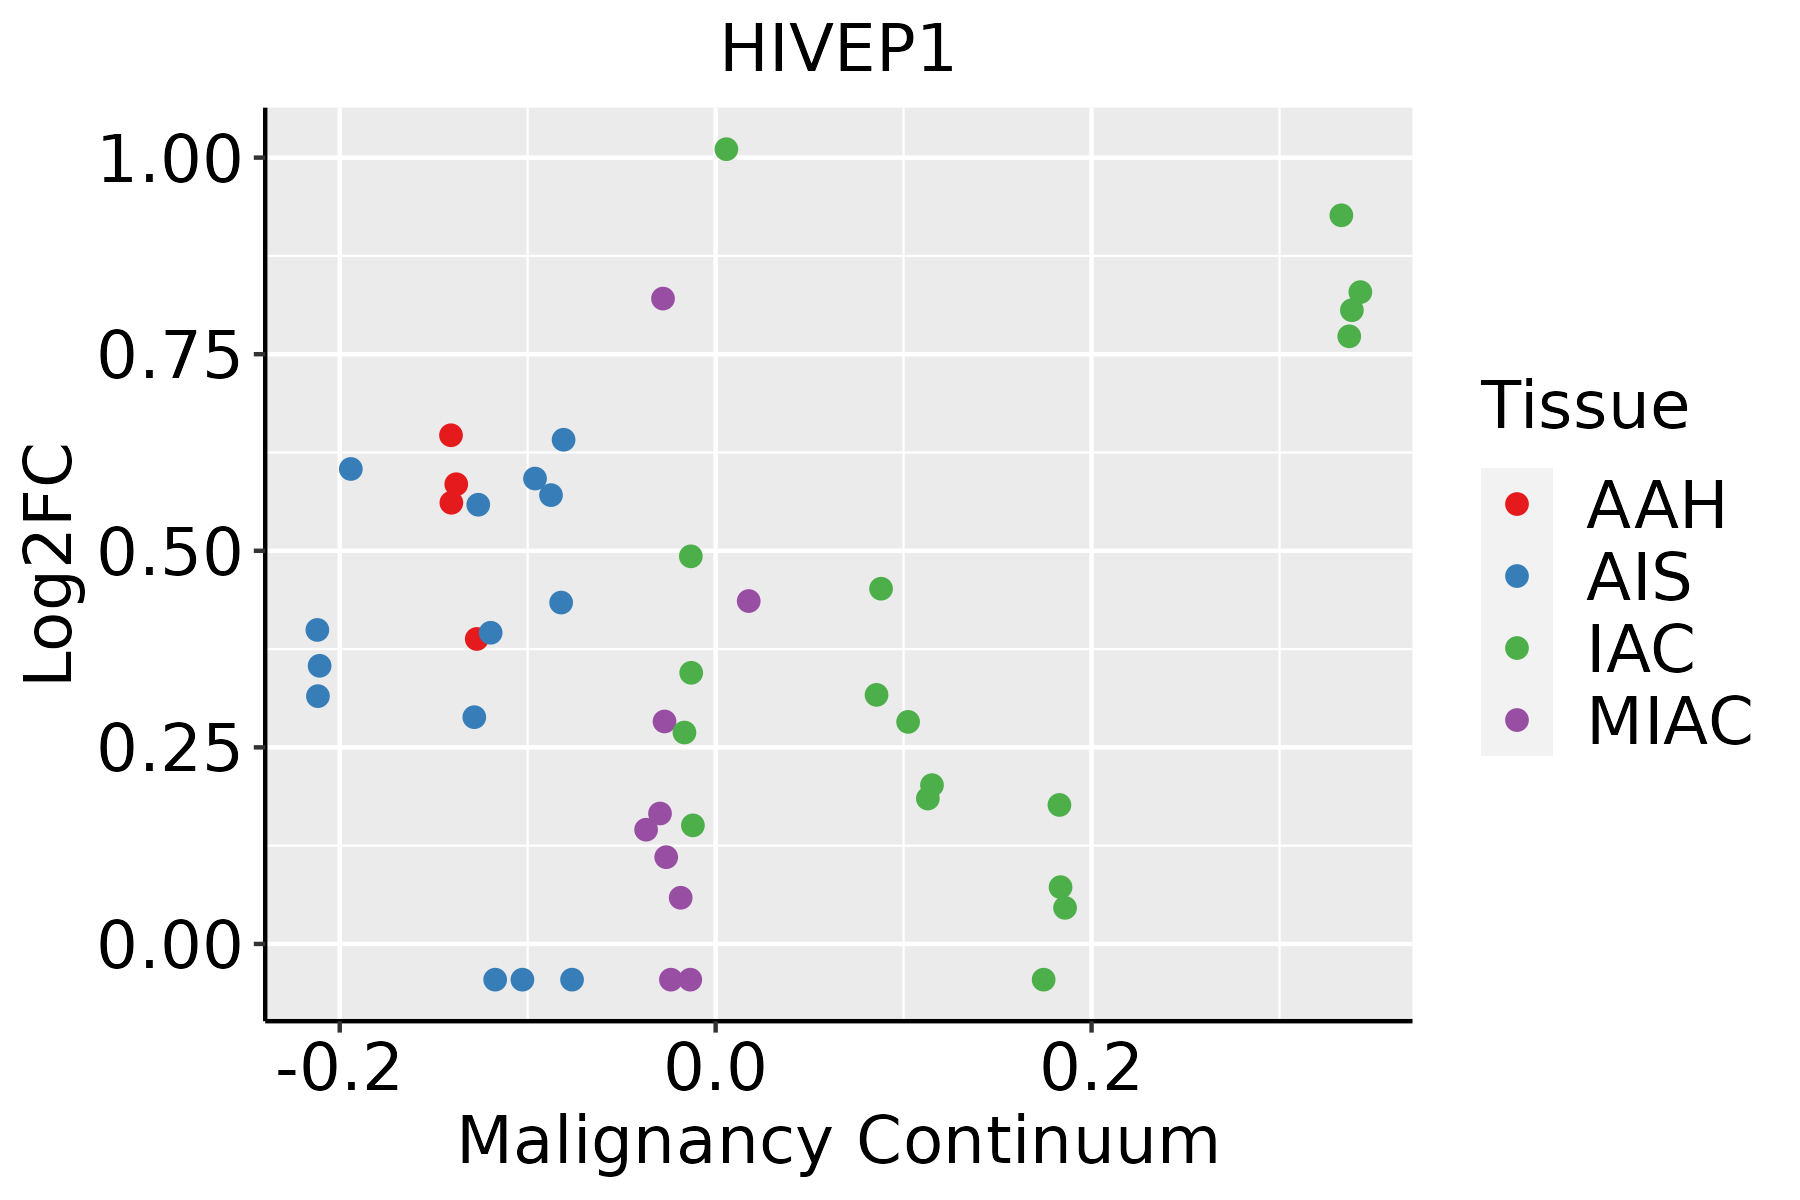 | AAH: Atypical adenomatous hyperplasia |
| AIS: Adenocarcinoma in situ |
| IAC: Invasive lung adenocarcinoma |
| MIA: Minimally invasive adenocarcinoma |
| Oral Cavity | 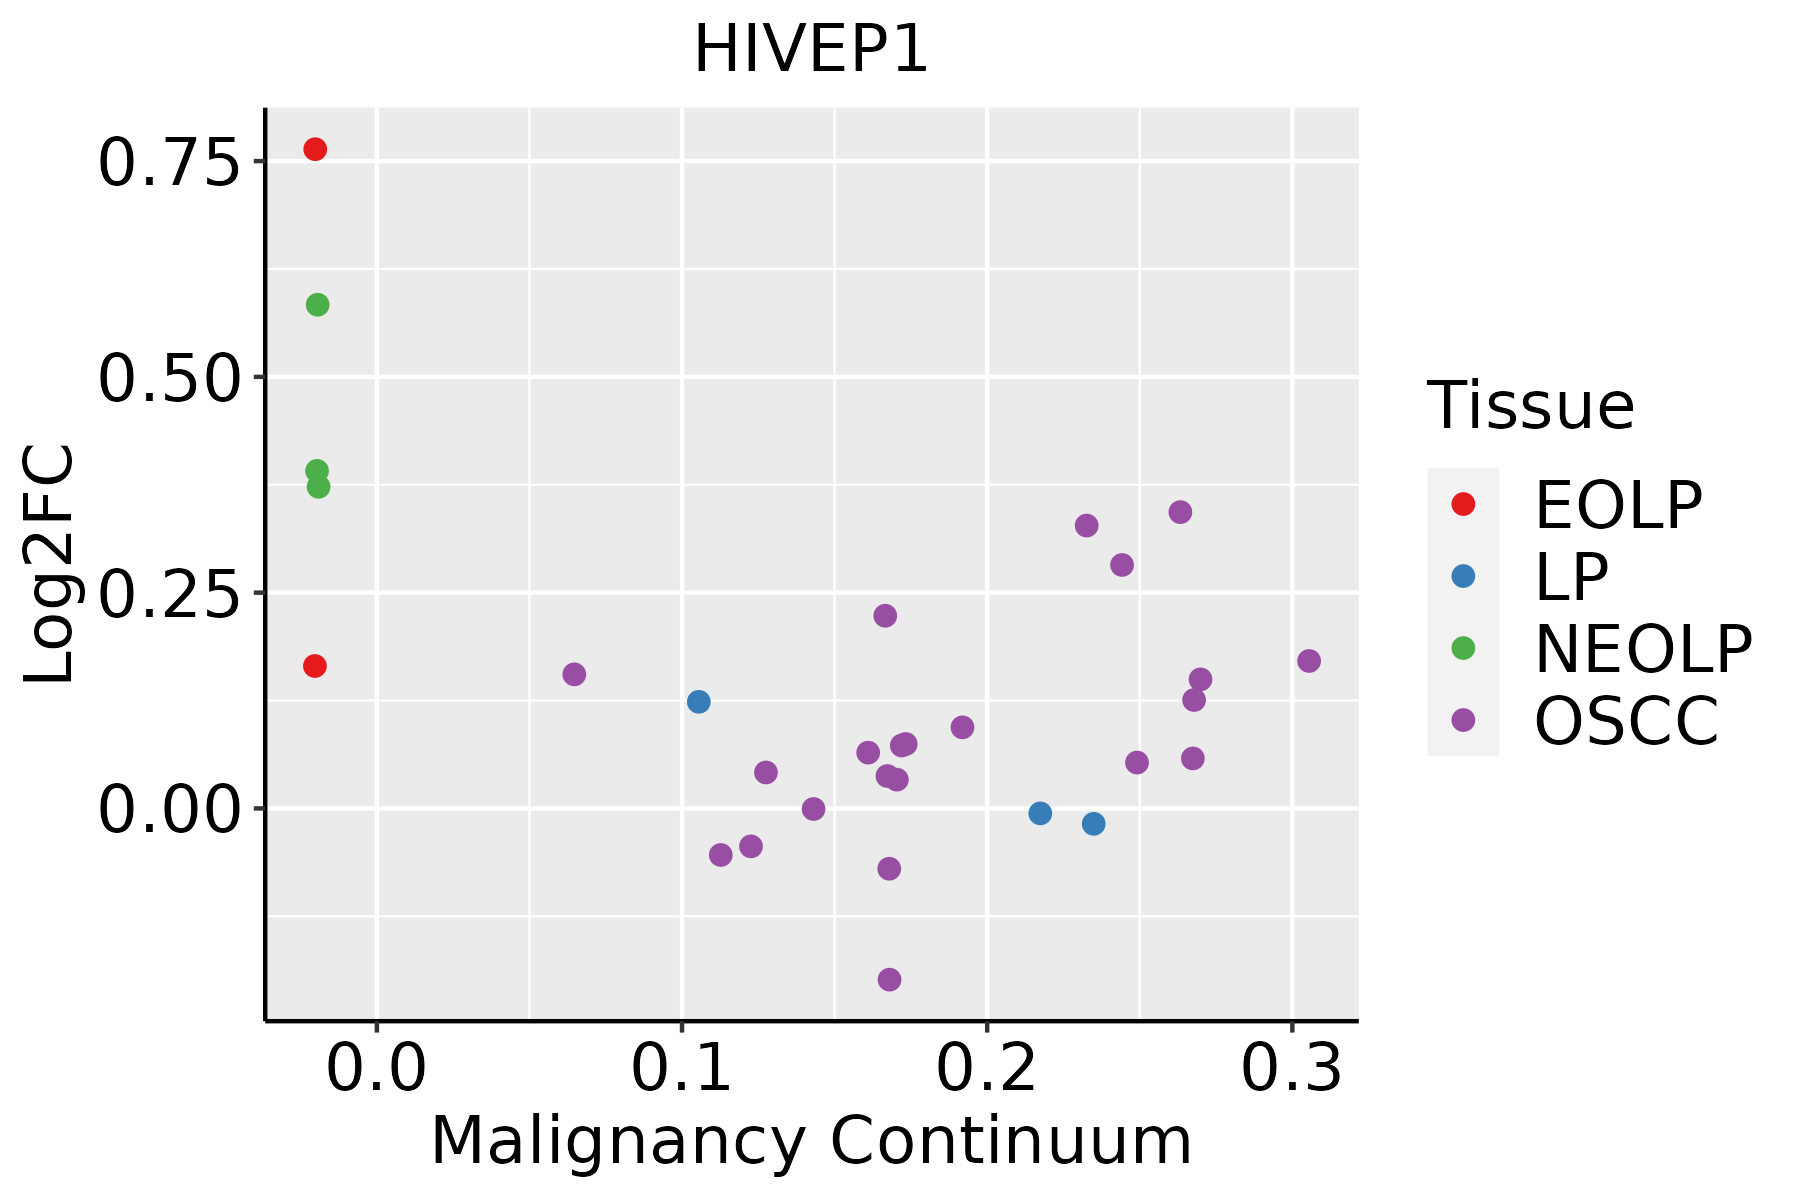 | EOLP: Erosive Oral lichen planus |
| LP: leukoplakia |
| NEOLP: Non-erosive oral lichen planus |
| OSCC: Oral squamous cell carcinoma |
| Prostate | 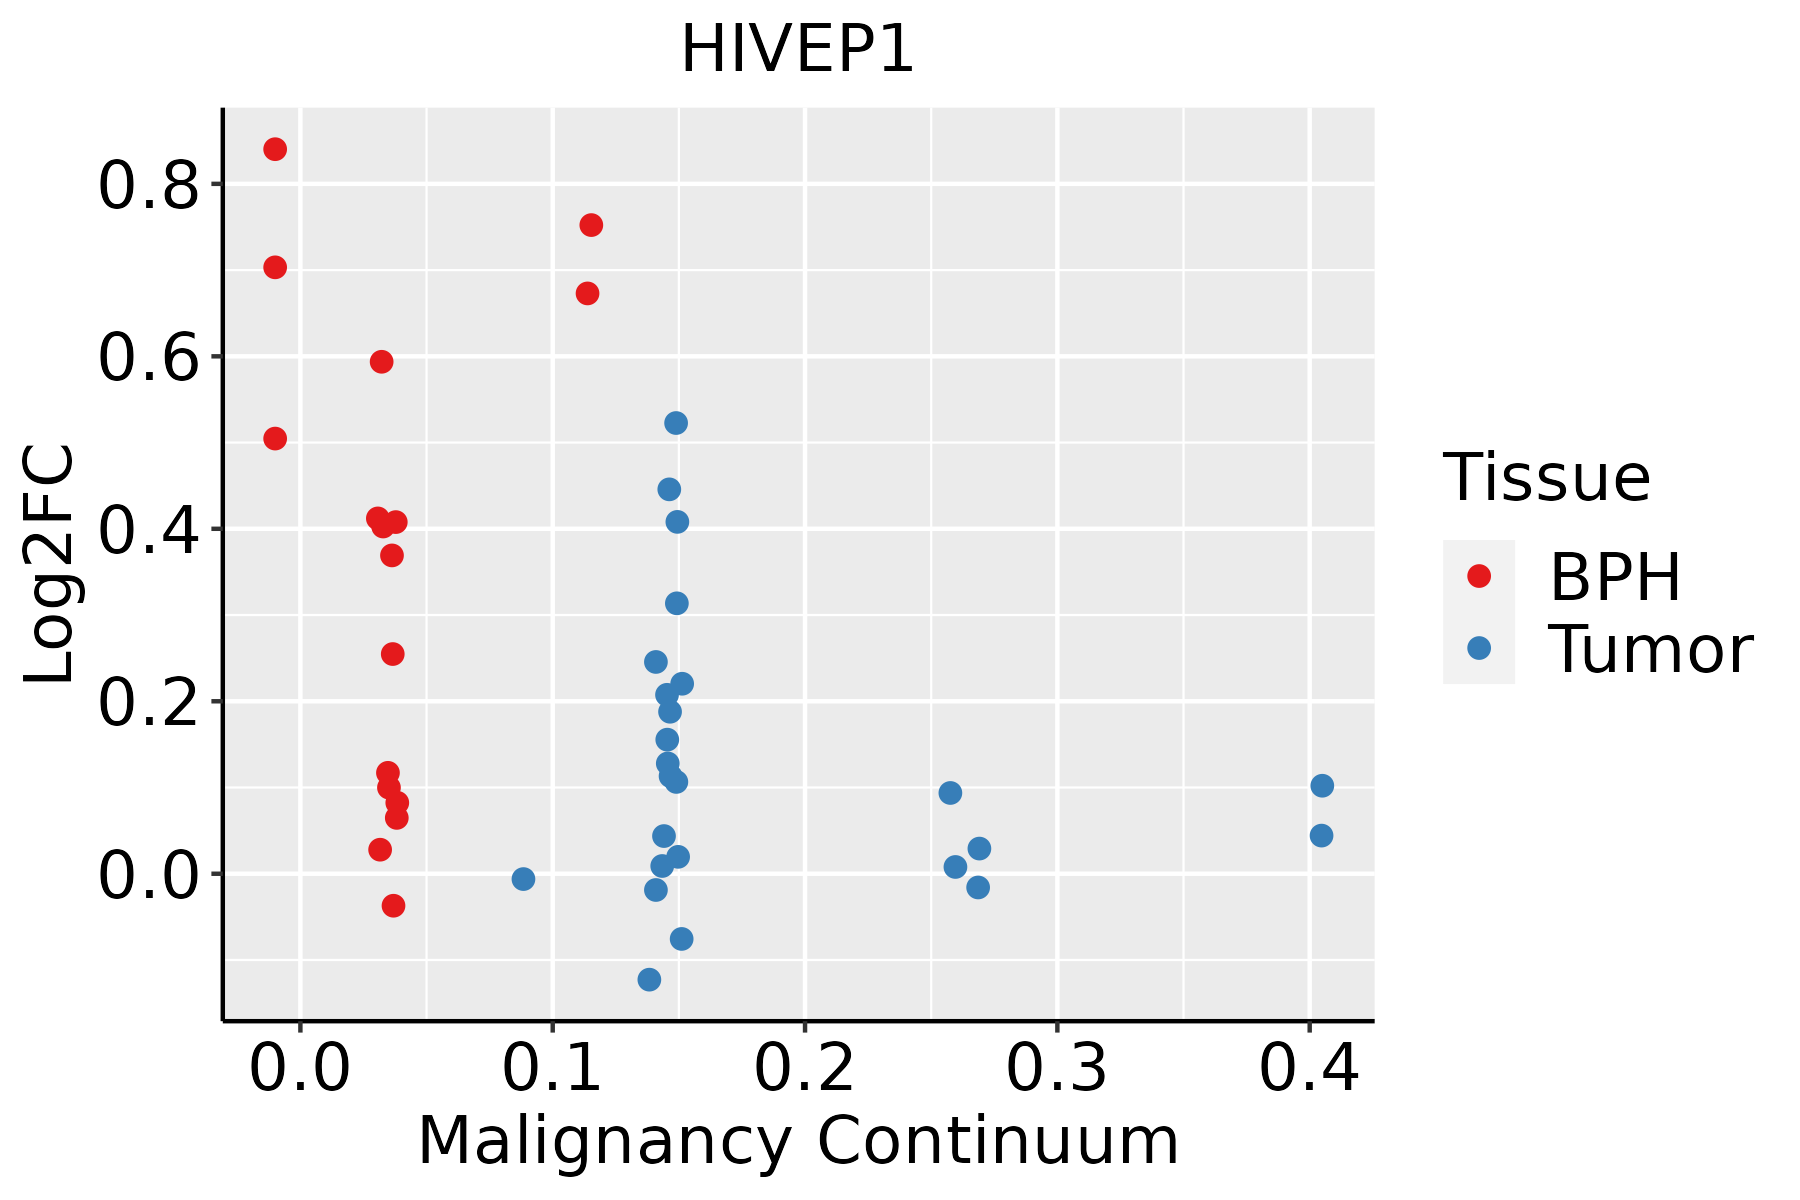 | BPH: Benign Prostatic Hyperplasia |
| Skin |  | AK: Actinic keratosis |
| cSCC: Cutaneous squamous cell carcinoma |
| SCCIS:squamous cell carcinoma in situ |
| Thyroid |  | ATC: Anaplastic thyroid cancer |
| HT: Hashimoto's thyroiditis |
| PTC: Papillary thyroid cancer |
| GO ID | Tissue | Disease Stage | Description | Gene Ratio | Bg Ratio | pvalue | p.adjust | Count |
| GO:00071786 | Cervix | CC | transmembrane receptor protein serine/threonine kinase signaling pathway | 67/2311 | 355/18723 | 2.39e-04 | 2.67e-03 | 67 |
| GO:0007178 | Colorectum | AD | transmembrane receptor protein serine/threonine kinase signaling pathway | 99/3918 | 355/18723 | 9.92e-04 | 9.28e-03 | 99 |
| GO:00071781 | Colorectum | MSS | transmembrane receptor protein serine/threonine kinase signaling pathway | 86/3467 | 355/18723 | 4.04e-03 | 2.95e-02 | 86 |
| GO:00071782 | Colorectum | FAP | transmembrane receptor protein serine/threonine kinase signaling pathway | 81/2622 | 355/18723 | 4.28e-06 | 1.46e-04 | 81 |
| GO:0071772 | Colorectum | FAP | response to BMP | 37/2622 | 165/18723 | 2.20e-03 | 1.80e-02 | 37 |
| GO:0071773 | Colorectum | FAP | cellular response to BMP stimulus | 37/2622 | 165/18723 | 2.20e-03 | 1.80e-02 | 37 |
| GO:0030509 | Colorectum | FAP | BMP signaling pathway | 34/2622 | 152/18723 | 3.38e-03 | 2.47e-02 | 34 |
| GO:00071783 | Colorectum | CRC | transmembrane receptor protein serine/threonine kinase signaling pathway | 66/2078 | 355/18723 | 1.74e-05 | 5.28e-04 | 66 |
| GO:00305091 | Colorectum | CRC | BMP signaling pathway | 31/2078 | 152/18723 | 5.73e-04 | 7.89e-03 | 31 |
| GO:00717721 | Colorectum | CRC | response to BMP | 32/2078 | 165/18723 | 1.16e-03 | 1.33e-02 | 32 |
| GO:00717731 | Colorectum | CRC | cellular response to BMP stimulus | 32/2078 | 165/18723 | 1.16e-03 | 1.33e-02 | 32 |
| GO:00071787 | Endometrium | AEH | transmembrane receptor protein serine/threonine kinase signaling pathway | 67/2100 | 355/18723 | 1.28e-05 | 2.80e-04 | 67 |
| GO:00305092 | Endometrium | AEH | BMP signaling pathway | 32/2100 | 152/18723 | 3.15e-04 | 3.54e-03 | 32 |
| GO:00717722 | Endometrium | AEH | response to BMP | 32/2100 | 165/18723 | 1.38e-03 | 1.16e-02 | 32 |
| GO:00717732 | Endometrium | AEH | cellular response to BMP stimulus | 32/2100 | 165/18723 | 1.38e-03 | 1.16e-02 | 32 |
| GO:000717814 | Endometrium | EEC | transmembrane receptor protein serine/threonine kinase signaling pathway | 68/2168 | 355/18723 | 1.90e-05 | 3.50e-04 | 68 |
| GO:003050911 | Endometrium | EEC | BMP signaling pathway | 32/2168 | 152/18723 | 5.52e-04 | 5.52e-03 | 32 |
| GO:007177211 | Endometrium | EEC | response to BMP | 33/2168 | 165/18723 | 1.16e-03 | 9.90e-03 | 33 |
| GO:007177311 | Endometrium | EEC | cellular response to BMP stimulus | 33/2168 | 165/18723 | 1.16e-03 | 9.90e-03 | 33 |
| GO:000717810 | Esophagus | ESCC | transmembrane receptor protein serine/threonine kinase signaling pathway | 195/8552 | 355/18723 | 2.58e-04 | 1.58e-03 | 195 |
| TF | Cell Type | Tissue | Disease Stage | Target Gene | RSS | Regulon Activity |
| HIVEP1 | CFIB | Colorectum | ADJ | PTPRD,UNC13C,MED12, etc. | 4.30e-01 |  |
| HIVEP1 | CFIB | Colorectum | FAP | PTPRD,UNC13C,MED12, etc. | 2.82e-01 |  |
| HIVEP1 | CFIB | Colorectum | Healthy | PTPRD,UNC13C,MED12, etc. | 1.79e-01 |  |
| HIVEP1 | ECM | Colorectum | Healthy | PTPRD,UNC13C,MED12, etc. | 1.40e-01 | |
| HIVEP1 | STM | Endometrium | ADJ | HIVEP2,NFKB1,DENND4A, etc. | 6.44e-01 |  |
| HIVEP1 | MSC | Liver | Cirrhotic | GPBP1,GMDS-DT,NUP153, etc. | 2.63e-01 |  |
| HIVEP1 | LC | Lung | ADJ | SIPA1L1,HIVEP2,NFKB1, etc. | 1.93e-01 |  |
| HIVEP1 | MALTB | Lung | MIAC | HIVEP2,ATP2B1,DLEU2, etc. | 9.05e-02 |  |
| HIVEP1 | INCAF | Oral cavity | ADJ | DENND4A,RACK1,TRABD2B, etc. | 8.43e-02 |  |
| HIVEP1 | ECM | Pancreas | PDAC | AFTPH,FP236383.3,NFKB1, etc. | 2.53e-01 |  |
| Hugo Symbol | Variant Class | Variant Classification | dbSNP RS | HGVSc | HGVSp | HGVSp Short | SWISSPROT | BIOTYPE | SIFT | PolyPhen | Tumor Sample Barcode | Tissue | Histology | Sex | Age | Stage | Therapy Types | Drugs | Outcome |
| HIVEP1 | SNV | Missense_Mutation | novel | c.6496N>G | p.Gln2166Glu | p.Q2166E | P15822 | protein_coding | deleterious(0.02) | possibly_damaging(0.519) | TCGA-A2-A4RW-01 | Breast | breast invasive carcinoma | Female | <65 | III/IV | Unknown | Unknown | SD |
| HIVEP1 | SNV | Missense_Mutation | rs753435750 | c.125C>T | p.Ser42Leu | p.S42L | P15822 | protein_coding | tolerated(0.12) | probably_damaging(0.918) | TCGA-AN-A046-01 | Breast | breast invasive carcinoma | Female | >=65 | I/II | Unknown | Unknown | SD |
| HIVEP1 | SNV | Missense_Mutation | | c.1148T>C | p.Val383Ala | p.V383A | P15822 | protein_coding | deleterious(0.01) | probably_damaging(0.928) | TCGA-AN-A046-01 | Breast | breast invasive carcinoma | Female | >=65 | I/II | Unknown | Unknown | SD |
| HIVEP1 | SNV | Missense_Mutation | rs373301856 | c.4835C>T | p.Ser1612Leu | p.S1612L | P15822 | protein_coding | tolerated(0.4) | benign(0.026) | TCGA-AN-A046-01 | Breast | breast invasive carcinoma | Female | >=65 | I/II | Unknown | Unknown | SD |
| HIVEP1 | SNV | Missense_Mutation | | c.5461N>T | p.Pro1821Ser | p.P1821S | P15822 | protein_coding | tolerated(0.12) | probably_damaging(1) | TCGA-AO-A0J5-01 | Breast | breast invasive carcinoma | Female | <65 | III/IV | Other, specify in notesBisphosphonate | zoledronic | PD |
| HIVEP1 | SNV | Missense_Mutation | rs371327892 | c.4604N>T | p.Thr1535Met | p.T1535M | P15822 | protein_coding | tolerated(0.09) | benign(0.202) | TCGA-AO-A0JM-01 | Breast | breast invasive carcinoma | Female | <65 | I/II | Chemotherapy | doxorubicin | SD |
| HIVEP1 | SNV | Missense_Mutation | rs368115054 | c.3794N>A | p.Arg1265His | p.R1265H | P15822 | protein_coding | deleterious(0) | probably_damaging(1) | TCGA-AR-A0TS-01 | Breast | breast invasive carcinoma | Female | <65 | I/II | Chemotherapy | doxorubicin | SD |
| HIVEP1 | SNV | Missense_Mutation | | c.7345N>C | p.Ser2449Pro | p.S2449P | P15822 | protein_coding | tolerated(0.38) | benign(0.024) | TCGA-AR-A1AL-01 | Breast | breast invasive carcinoma | Female | <65 | III/IV | Hormone Therapy | anastrozole | SD |
| HIVEP1 | SNV | Missense_Mutation | | c.2372N>G | p.Ser791Cys | p.S791C | P15822 | protein_coding | deleterious(0) | probably_damaging(1) | TCGA-B6-A0IJ-01 | Breast | breast invasive carcinoma | Female | <65 | I/II | Unknown | Unknown | SD |
| HIVEP1 | SNV | Missense_Mutation | rs746004351 | c.1930G>A | p.Ala644Thr | p.A644T | P15822 | protein_coding | deleterious(0) | probably_damaging(0.999) | TCGA-BH-A0AW-01 | Breast | breast invasive carcinoma | Female | <65 | I/II | Chemotherapy | carboplatin | SD |


