
|
|||||
|
 | |
| |
| |
| |
| |
| |
|
Gene: HIST2H3D |
Gene summary for HIST2H3D |
| Gene information | Species | Human | Gene symbol | HIST2H3D | Gene ID | 653604 |
| Gene name | H3 clustered histone 13 | |
| Gene Alias | H3C14 | |
| Cytomap | 1q21.2 | |
| Gene Type | protein-coding | GO ID | GO:0006323 | UniProtAcc | Q71DI3 |
Top |
Malignant transformation analysis |
| Identification of the aberrant gene expression in precancerous and cancerous lesions by comparing the gene expression of stem-like cells in diseased tissues with normal stem cells |
| Entrez ID | Symbol | Replicates | Species | Organ | Tissue | Adj P-value | Log2FC | Malignancy |
| 653604 | HIST2H3D | LZE21T | Human | Esophagus | ESCC | 6.52e-03 | 2.77e-01 | 0.0655 |
| 653604 | HIST2H3D | P1T-E | Human | Esophagus | ESCC | 3.50e-13 | 5.99e-01 | 0.0875 |
| 653604 | HIST2H3D | P10T-E | Human | Esophagus | ESCC | 1.66e-02 | 7.52e-02 | 0.116 |
| 653604 | HIST2H3D | P20T-E | Human | Esophagus | ESCC | 2.16e-09 | 2.74e-01 | 0.1124 |
| 653604 | HIST2H3D | P22T-E | Human | Esophagus | ESCC | 1.78e-03 | 1.07e-01 | 0.1236 |
| 653604 | HIST2H3D | P39T-E | Human | Esophagus | ESCC | 2.02e-06 | 1.76e-01 | 0.0894 |
| 653604 | HIST2H3D | P42T-E | Human | Esophagus | ESCC | 3.05e-02 | 1.26e-01 | 0.1175 |
| 653604 | HIST2H3D | P48T-E | Human | Esophagus | ESCC | 4.31e-06 | 2.02e-01 | 0.0959 |
| 653604 | HIST2H3D | P52T-E | Human | Esophagus | ESCC | 9.44e-07 | 1.75e-01 | 0.1555 |
| 653604 | HIST2H3D | P54T-E | Human | Esophagus | ESCC | 1.28e-04 | 2.23e-01 | 0.0975 |
| 653604 | HIST2H3D | P61T-E | Human | Esophagus | ESCC | 6.18e-25 | 6.83e-01 | 0.099 |
| 653604 | HIST2H3D | P65T-E | Human | Esophagus | ESCC | 1.06e-02 | 9.52e-02 | 0.0978 |
| 653604 | HIST2H3D | P75T-E | Human | Esophagus | ESCC | 1.96e-05 | 1.26e-01 | 0.1125 |
| 653604 | HIST2H3D | P79T-E | Human | Esophagus | ESCC | 1.66e-02 | 9.25e-02 | 0.1154 |
| 653604 | HIST2H3D | P104T-E | Human | Esophagus | ESCC | 4.14e-03 | 1.87e-01 | 0.0931 |
| 653604 | HIST2H3D | P127T-E | Human | Esophagus | ESCC | 1.65e-03 | 1.03e-01 | 0.0826 |
| 653604 | HIST2H3D | P130T-E | Human | Esophagus | ESCC | 9.20e-06 | 1.59e-01 | 0.1676 |
| Page: 1 |
| Tissue | Expression Dynamics | Abbreviation |
| Esophagus | 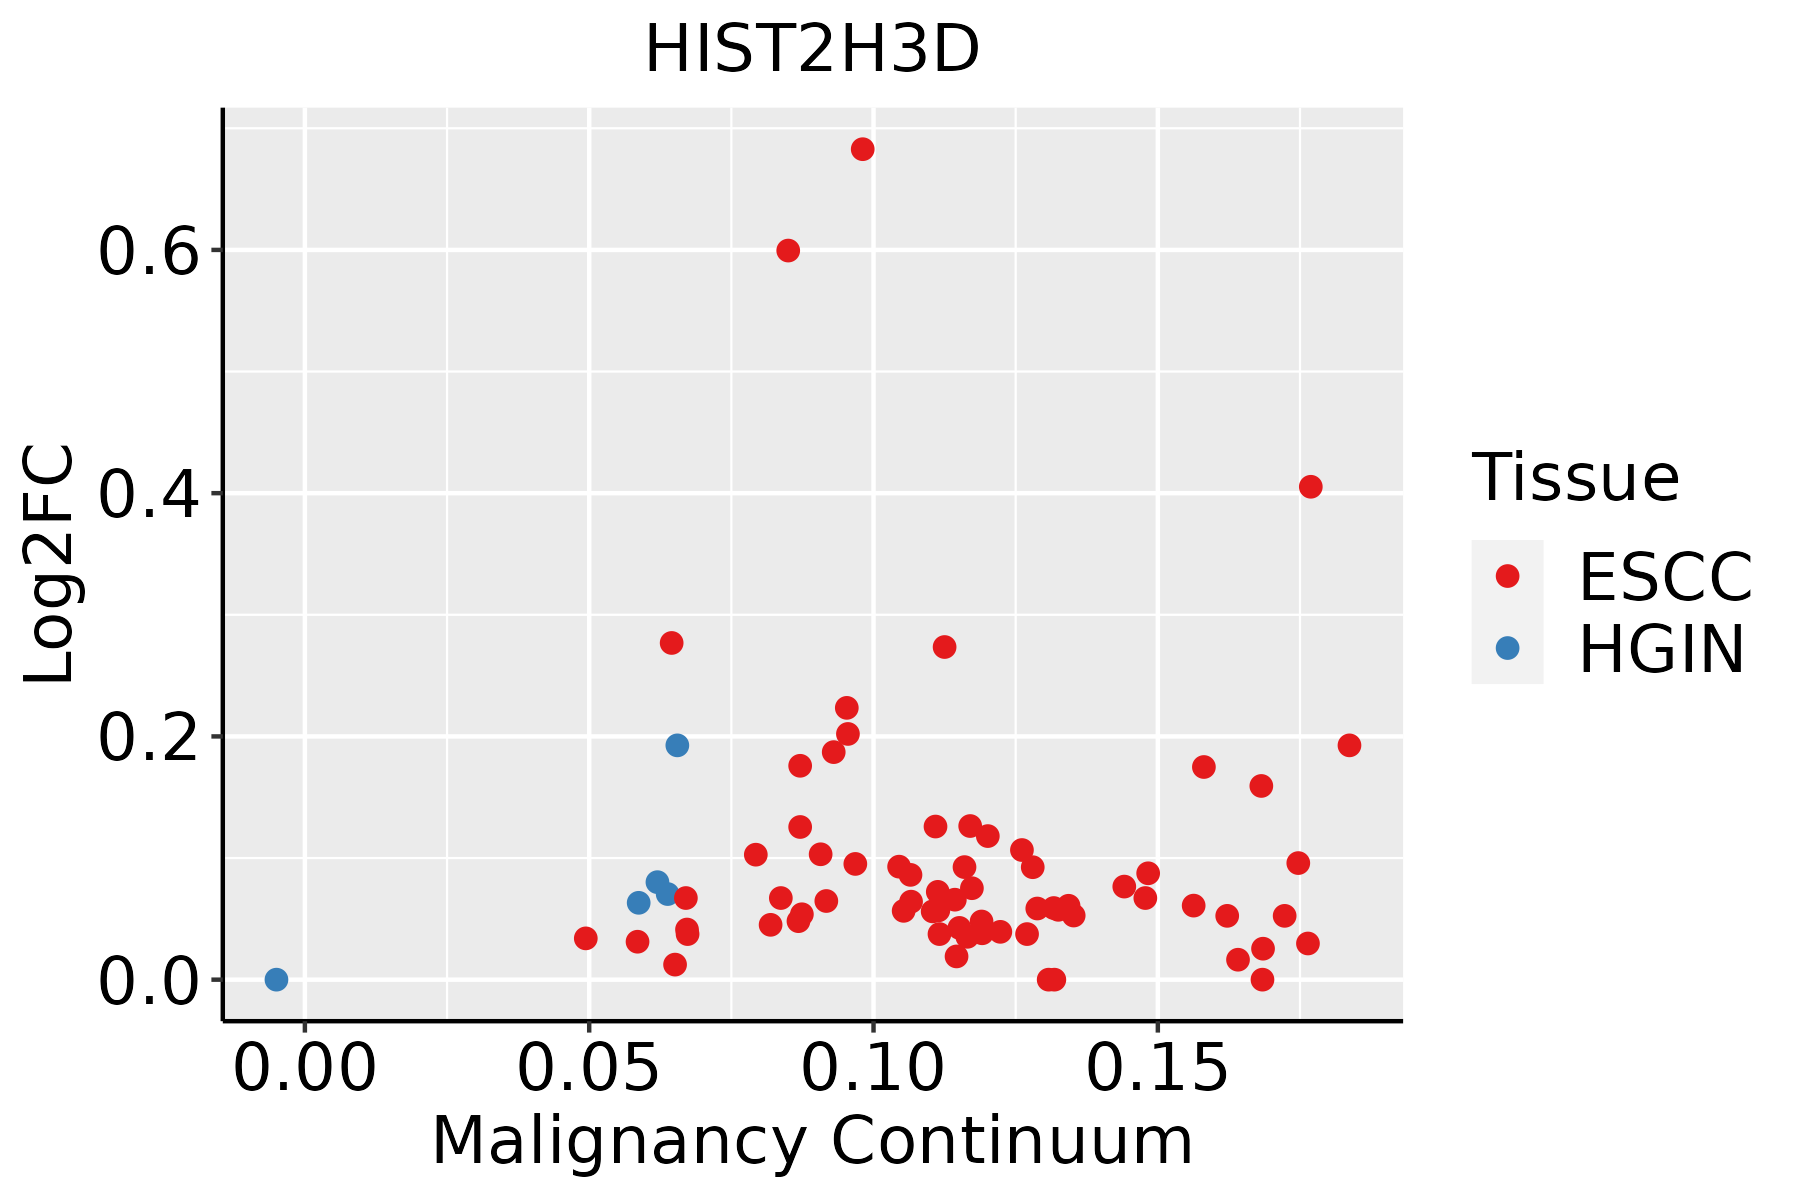 | ESCC: Esophageal squamous cell carcinoma |
| HGIN: High-grade intraepithelial neoplasias | ||
| LGIN: Low-grade intraepithelial neoplasias |
| ∗log2FC in expression of this searched gene in stem-like cells from each diseased tissue sample relative to stem-like cells in normal samples in each tissue plotted against the malignancy continuum. Samples are colored based on if they are from different disease stage. |
Top |
Malignant transformation related pathway analysis |
| Find out the enriched GO biological processes and KEGG pathways involved in transition from healthy to precancer to cancer |
| Tissue | Disease Stage | Enriched GO biological Processes |
| Colorectum | AD |  |
| Colorectum | SER |  |
| Colorectum | MSS |  |
| Colorectum | MSI-H |  |
| Colorectum | FAP |  |
| ∗Top 15 enriched GO BP terms are showed in the bar plot of each disease state in each tissue. Each row represents a significant GO biological process which is colored according to the -log10(p.adjust). |
| Page: 1 2 3 4 5 6 7 8 9 |
| GO ID | Tissue | Disease Stage | Description | Gene Ratio | Bg Ratio | pvalue | p.adjust | Count |
| Page: 1 |
| Pathway ID | Tissue | Disease Stage | Description | Gene Ratio | Bg Ratio | pvalue | p.adjust | qvalue | Count |
| Page: 1 |
Top |
Cell-cell communication analysis |
| Identification of potential cell-cell interactions between two cell types and their ligand-receptor pairs for different disease states |
| Ligand | Receptor | LRpair | Pathway | Tissue | Disease Stage |
| Page: 1 |
Top |
Single-cell gene regulatory network inference analysis |
| Find out the significant the regulons (TFs) and the target genes of each regulon across cell types for different disease states |
| TF | Cell Type | Tissue | Disease Stage | Target Gene | RSS | Regulon Activity |
| ∗The dot plots of a searched regulon are shown for all cell subpopulations in each disease state of each tissue based on the regulon specific score inferred using pySCENIC and by calculating the average expression. |
| Page: 1 |
Top |
Somatic mutation of malignant transformation related genes |
| Annotation of somatic variants for genes involved in malignant transformation |
| Hugo Symbol | Variant Class | Variant Classification | dbSNP RS | HGVSc | HGVSp | HGVSp Short | SWISSPROT | BIOTYPE | SIFT | PolyPhen | Tumor Sample Barcode | Tissue | Histology | Sex | Age | Stage | Therapy Types | Drugs | Outcome |
| HIST2H3D | SNV | Missense_Mutation | novel | c.137C>A | p.Thr46Asn | p.T46N | Q71DI3 | protein_coding | deleterious_low_confidence(0) | possibly_damaging(0.691) | TCGA-AC-A23G-01 | Breast | breast invasive carcinoma | Female | >=65 | I/II | Chemotherapy | cytoxan | CR |
| HIST2H3D | SNV | Missense_Mutation | novel | c.388C>T | p.Arg130Cys | p.R130C | Q71DI3 | protein_coding | tolerated_low_confidence(0.06) | benign(0.072) | TCGA-AN-A046-01 | Breast | breast invasive carcinoma | Female | >=65 | I/II | Unknown | Unknown | SD |
| HIST2H3D | SNV | Missense_Mutation | c.370N>T | p.Asp124Tyr | p.D124Y | Q71DI3 | protein_coding | deleterious_low_confidence(0) | probably_damaging(0.955) | TCGA-AN-A0AL-01 | Breast | breast invasive carcinoma | Female | <65 | III/IV | Unknown | Unknown | SD | |
| HIST2H3D | SNV | Missense_Mutation | c.369N>T | p.Lys123Asn | p.K123N | Q71DI3 | protein_coding | deleterious_low_confidence(0) | probably_damaging(0.944) | TCGA-AN-A0AL-01 | Breast | breast invasive carcinoma | Female | <65 | III/IV | Unknown | Unknown | SD | |
| HIST2H3D | SNV | Missense_Mutation | c.292N>C | p.Glu98Gln | p.E98Q | Q71DI3 | protein_coding | deleterious_low_confidence(0) | probably_damaging(0.974) | TCGA-BH-A2L8-01 | Breast | breast invasive carcinoma | Female | <65 | I/II | Chemotherapy | cytoxan | CR | |
| HIST2H3D | SNV | Missense_Mutation | rs781912457 | c.261N>A | p.Ser87Arg | p.S87R | Q71DI3 | protein_coding | deleterious_low_confidence(0) | benign(0.232) | TCGA-C8-A274-01 | Breast | breast invasive carcinoma | Female | <65 | I/II | Hormone Therapy | tamoxiphen | SD |
| HIST2H3D | SNV | Missense_Mutation | c.32N>T | p.Ser11Leu | p.S11L | Q71DI3 | protein_coding | deleterious_low_confidence(0.01) | benign(0.27) | TCGA-E2-A159-01 | Breast | breast invasive carcinoma | Female | <65 | I/II | Chemotherapy | cyclophosphamide | SD | |
| HIST2H3D | SNV | Missense_Mutation | c.292G>A | p.Glu98Lys | p.E98K | Q71DI3 | protein_coding | deleterious_low_confidence(0.02) | possibly_damaging(0.904) | TCGA-Q1-A73Q-01 | Cervix | cervical & endocervical cancer | Female | <65 | I/II | Chemotherapy | cisplatin | SD | |
| HIST2H3D | insertion | In_Frame_Ins | novel | c.271_272insCGGCGC | p.Met91delinsThrAlaLeu | p.M91delinsTAL | Q71DI3 | protein_coding | TCGA-DS-A1OA-01 | Cervix | cervical & endocervical cancer | Female | >=65 | I/II | Chemotherapy | carboplatin | PD | ||
| HIST2H3D | SNV | Missense_Mutation | c.381G>T | p.Leu127Phe | p.L127F | Q71DI3 | protein_coding | deleterious_low_confidence(0) | probably_damaging(1) | TCGA-AA-A022-01 | Colorectum | colon adenocarcinoma | Female | >=65 | I/II | Unknown | Unknown | SD |
| Page: 1 2 3 |
Top |
Related drugs of malignant transformation related genes |
| Identification of chemicals and drugs interact with genes involved in malignant transfromation |
| (DGIdb 4.0) |
| Entrez ID | Symbol | Category | Interaction Types | Drug Claim Name | Drug Name | PMIDs |
| Page: 1 |

Copyright 2023-Present -The University of Texas Health Science Center at Houston |