
|
|||||
|
 | |
| |
| |
| |
| |
| |
|
Gene: HIST2H2BF |
Gene summary for HIST2H2BF |
| Gene information | Species | Human | Gene symbol | HIST2H2BF | Gene ID | 440689 |
| Gene name | H2B clustered histone 18 | |
| Gene Alias | HIST2H2BF | |
| Cytomap | 1q21.2 | |
| Gene Type | protein-coding | GO ID | GO:0006323 | UniProtAcc | Q5QNW6 |
Top |
Malignant transformation analysis |
| Identification of the aberrant gene expression in precancerous and cancerous lesions by comparing the gene expression of stem-like cells in diseased tissues with normal stem cells |
| Entrez ID | Symbol | Replicates | Species | Organ | Tissue | Adj P-value | Log2FC | Malignancy |
| 440689 | HIST2H2BF | CCI_2 | Human | Cervix | CC | 6.66e-14 | 8.36e-01 | 0.5249 |
| 440689 | HIST2H2BF | T1 | Human | Cervix | CC | 6.85e-08 | 2.87e-01 | 0.0918 |
| 440689 | HIST2H2BF | LZE2T | Human | Esophagus | ESCC | 4.26e-03 | 4.57e-01 | 0.082 |
| 440689 | HIST2H2BF | LZE4T | Human | Esophagus | ESCC | 2.14e-10 | 3.45e-01 | 0.0811 |
| 440689 | HIST2H2BF | LZE7T | Human | Esophagus | ESCC | 2.05e-03 | 1.86e-01 | 0.0667 |
| 440689 | HIST2H2BF | LZE20T | Human | Esophagus | ESCC | 1.45e-02 | 1.22e-01 | 0.0662 |
| 440689 | HIST2H2BF | LZE22T | Human | Esophagus | ESCC | 2.25e-07 | 4.57e-01 | 0.068 |
| 440689 | HIST2H2BF | LZE24T | Human | Esophagus | ESCC | 1.03e-09 | 3.08e-01 | 0.0596 |
| 440689 | HIST2H2BF | LZE21T | Human | Esophagus | ESCC | 1.09e-02 | 2.45e-01 | 0.0655 |
| 440689 | HIST2H2BF | P1T-E | Human | Esophagus | ESCC | 9.77e-09 | 4.70e-01 | 0.0875 |
| 440689 | HIST2H2BF | P2T-E | Human | Esophagus | ESCC | 4.31e-06 | 1.53e-01 | 0.1177 |
| 440689 | HIST2H2BF | P4T-E | Human | Esophagus | ESCC | 1.53e-06 | 2.51e-01 | 0.1323 |
| 440689 | HIST2H2BF | P5T-E | Human | Esophagus | ESCC | 4.12e-11 | 3.28e-01 | 0.1327 |
| 440689 | HIST2H2BF | P9T-E | Human | Esophagus | ESCC | 1.14e-02 | 1.73e-01 | 0.1131 |
| 440689 | HIST2H2BF | P10T-E | Human | Esophagus | ESCC | 5.00e-17 | 2.86e-01 | 0.116 |
| 440689 | HIST2H2BF | P11T-E | Human | Esophagus | ESCC | 1.08e-04 | 2.28e-01 | 0.1426 |
| 440689 | HIST2H2BF | P12T-E | Human | Esophagus | ESCC | 7.31e-14 | 3.24e-01 | 0.1122 |
| 440689 | HIST2H2BF | P15T-E | Human | Esophagus | ESCC | 3.15e-06 | 1.71e-01 | 0.1149 |
| 440689 | HIST2H2BF | P16T-E | Human | Esophagus | ESCC | 1.60e-07 | 2.26e-01 | 0.1153 |
| 440689 | HIST2H2BF | P20T-E | Human | Esophagus | ESCC | 5.66e-13 | 6.35e-01 | 0.1124 |
| Page: 1 2 3 |
| Tissue | Expression Dynamics | Abbreviation |
| Cervix | 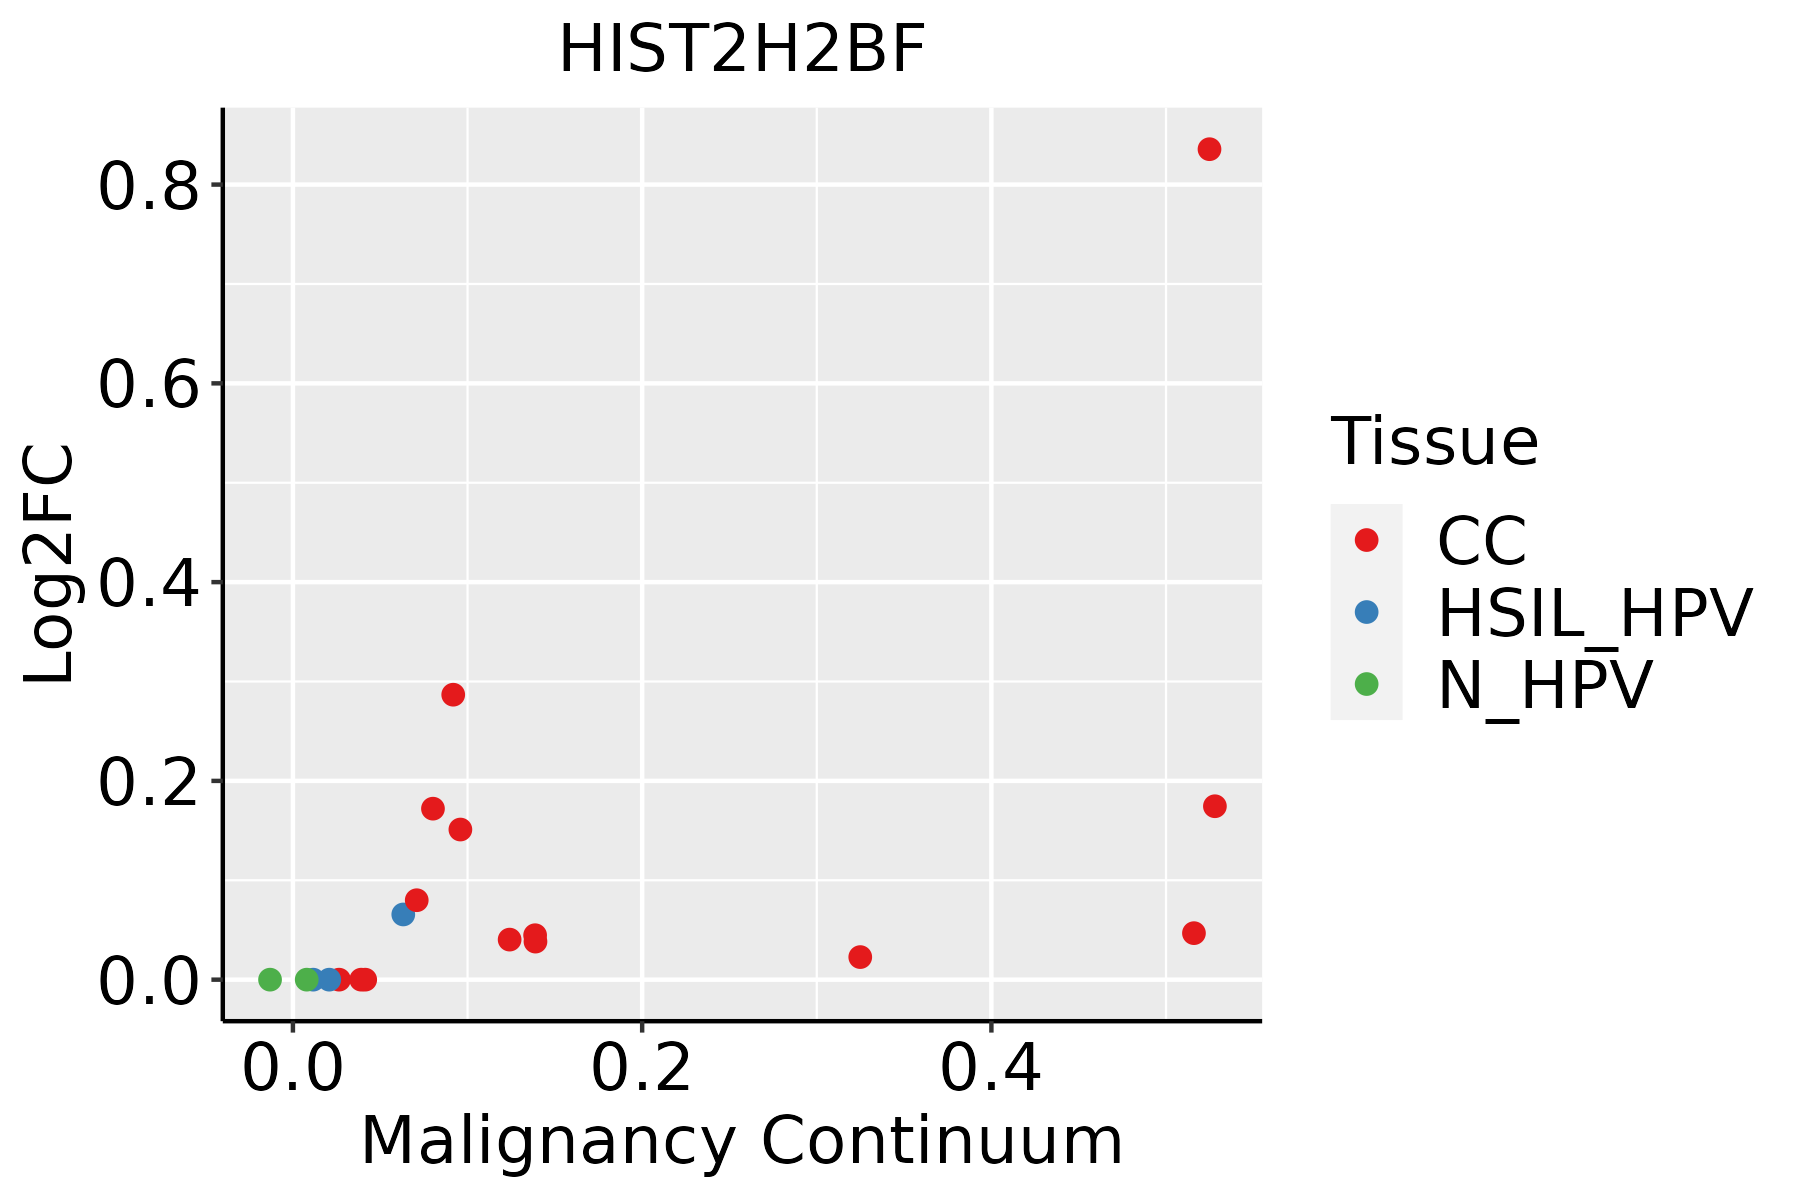 | CC: Cervix cancer |
| HSIL_HPV: HPV-infected high-grade squamous intraepithelial lesions | ||
| N_HPV: HPV-infected normal cervix | ||
| Esophagus | 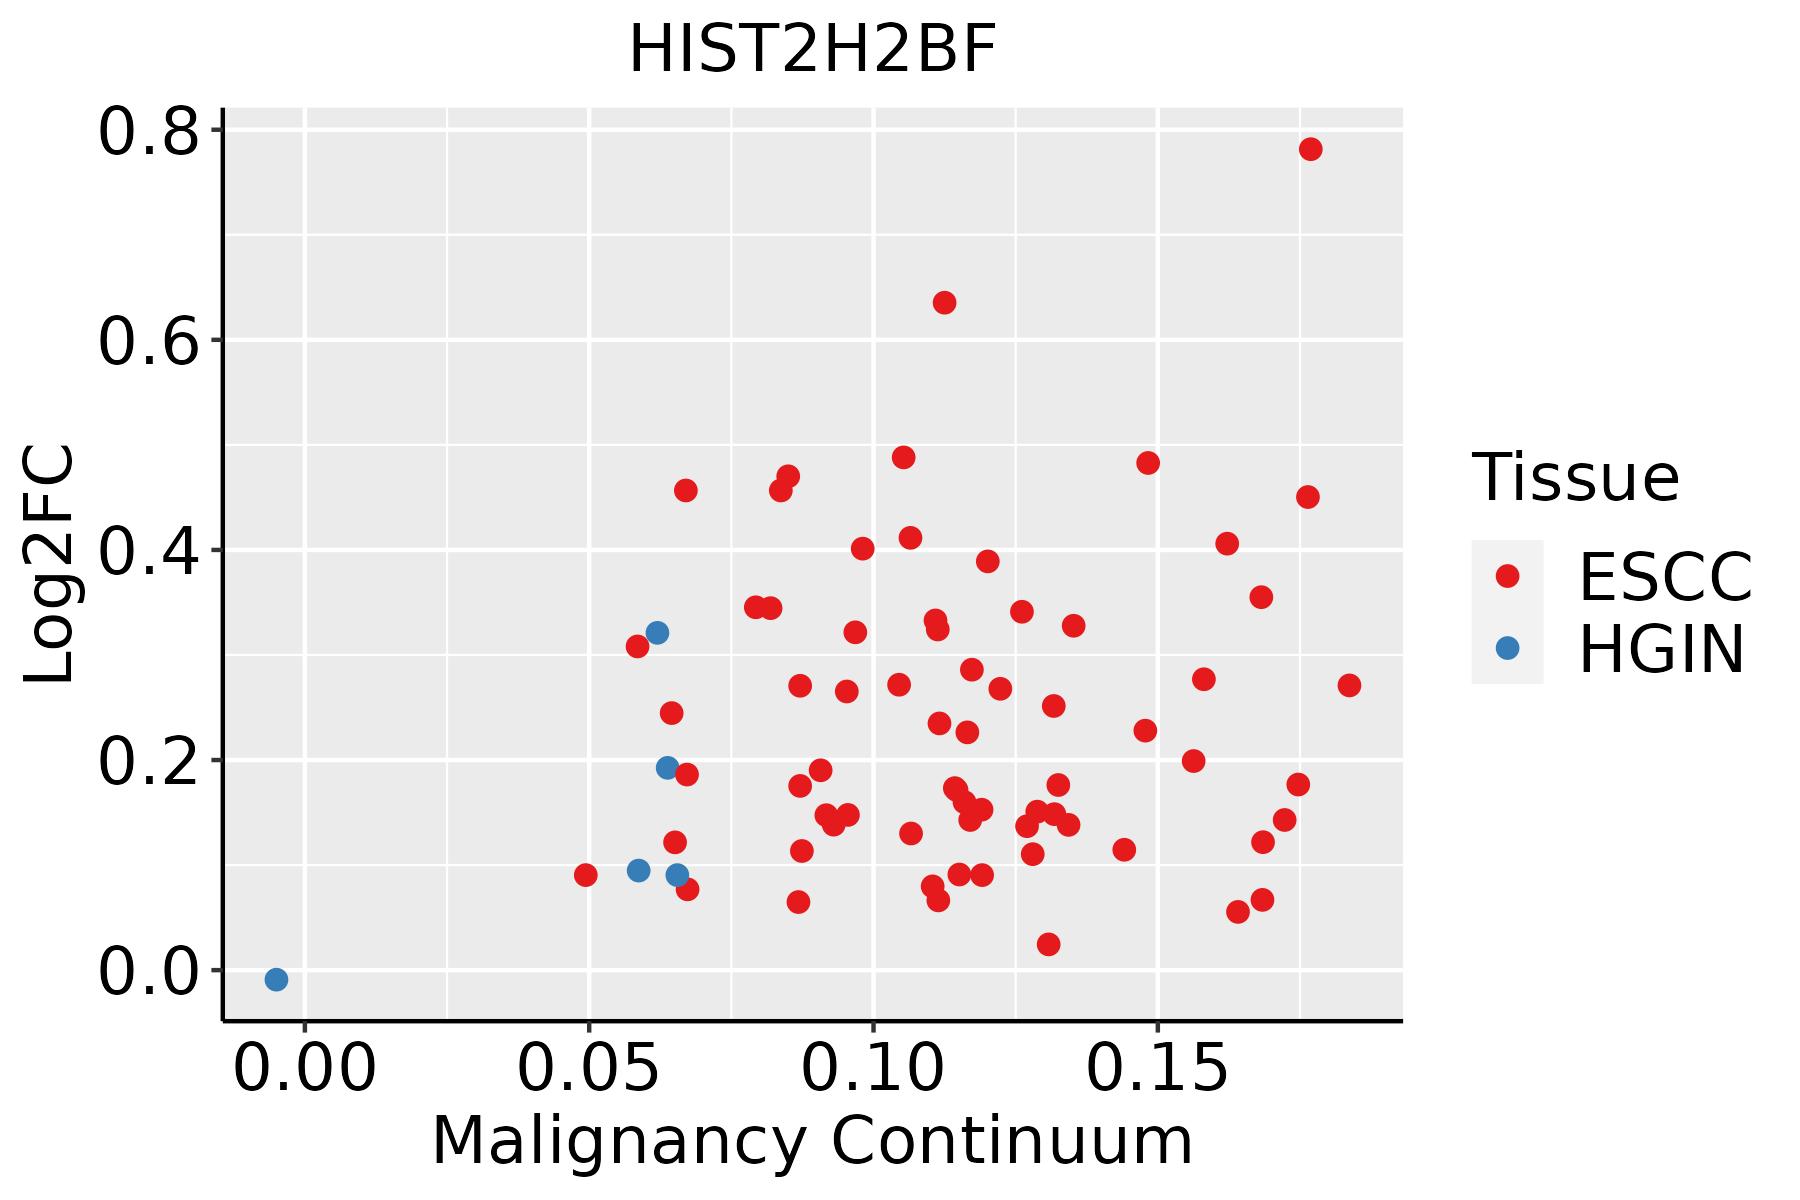 | ESCC: Esophageal squamous cell carcinoma |
| HGIN: High-grade intraepithelial neoplasias | ||
| LGIN: Low-grade intraepithelial neoplasias |
| ∗log2FC in expression of this searched gene in stem-like cells from each diseased tissue sample relative to stem-like cells in normal samples in each tissue plotted against the malignancy continuum. Samples are colored based on if they are from different disease stage. |
Top |
Malignant transformation related pathway analysis |
| Find out the enriched GO biological processes and KEGG pathways involved in transition from healthy to precancer to cancer |
| Tissue | Disease Stage | Enriched GO biological Processes |
| Colorectum | AD |  |
| Colorectum | SER |  |
| Colorectum | MSS |  |
| Colorectum | MSI-H |  |
| Colorectum | FAP |  |
| ∗Top 15 enriched GO BP terms are showed in the bar plot of each disease state in each tissue. Each row represents a significant GO biological process which is colored according to the -log10(p.adjust). |
| Page: 1 2 3 4 5 6 7 8 9 |
| GO ID | Tissue | Disease Stage | Description | Gene Ratio | Bg Ratio | pvalue | p.adjust | Count |
| Page: 1 |
| Pathway ID | Tissue | Disease Stage | Description | Gene Ratio | Bg Ratio | pvalue | p.adjust | qvalue | Count |
| Page: 1 |
Top |
Cell-cell communication analysis |
| Identification of potential cell-cell interactions between two cell types and their ligand-receptor pairs for different disease states |
| Ligand | Receptor | LRpair | Pathway | Tissue | Disease Stage |
| Page: 1 |
Top |
Single-cell gene regulatory network inference analysis |
| Find out the significant the regulons (TFs) and the target genes of each regulon across cell types for different disease states |
| TF | Cell Type | Tissue | Disease Stage | Target Gene | RSS | Regulon Activity |
| ∗The dot plots of a searched regulon are shown for all cell subpopulations in each disease state of each tissue based on the regulon specific score inferred using pySCENIC and by calculating the average expression. |
| Page: 1 |
Top |
Somatic mutation of malignant transformation related genes |
| Annotation of somatic variants for genes involved in malignant transformation |
| Hugo Symbol | Variant Class | Variant Classification | dbSNP RS | HGVSc | HGVSp | HGVSp Short | SWISSPROT | BIOTYPE | SIFT | PolyPhen | Tumor Sample Barcode | Tissue | Histology | Sex | Age | Stage | Therapy Types | Drugs | Outcome |
| HIST2H2BF | SNV | Missense_Mutation | c.210C>G | p.Ile70Met | p.I70M | Q5QNW6 | protein_coding | deleterious_low_confidence(0.01) | probably_damaging(0.985) | TCGA-AC-A23H-01 | Breast | breast invasive carcinoma | Female | >=65 | I/II | Unknown | Unknown | PD | |
| HIST2H2BF | SNV | Missense_Mutation | c.295N>A | p.Val99Met | p.V99M | Q5QNW6 | protein_coding | tolerated_low_confidence(0.08) | benign(0.439) | TCGA-BH-A0H5-01 | Breast | breast invasive carcinoma | Female | <65 | I/II | Chemotherapy | cytoxan | CR | |
| HIST2H2BF | SNV | Missense_Mutation | c.271A>G | p.Thr91Ala | p.T91A | Q5QNW6 | protein_coding | deleterious_low_confidence(0.03) | possibly_damaging(0.491) | TCGA-A6-5665-01 | Colorectum | colon adenocarcinoma | Female | >=65 | I/II | Unknown | Unknown | PD | |
| HIST2H2BF | SNV | Missense_Mutation | c.251N>G | p.Tyr84Cys | p.Y84C | Q5QNW6 | protein_coding | deleterious_low_confidence(0.01) | probably_damaging(1) | TCGA-A6-6653-01 | Colorectum | colon adenocarcinoma | Male | >=65 | I/II | Unknown | Unknown | SD | |
| HIST2H2BF | SNV | Missense_Mutation | novel | c.25C>G | p.Pro9Ala | p.P9A | Q5QNW6 | protein_coding | tolerated_low_confidence(0.07) | benign(0.147) | TCGA-AA-3949-01 | Colorectum | colon adenocarcinoma | Female | >=65 | III/IV | Unknown | Unknown | SD |
| HIST2H2BF | SNV | Missense_Mutation | c.146T>C | p.Val49Ala | p.V49A | Q5QNW6 | protein_coding | deleterious_low_confidence(0.01) | probably_damaging(0.999) | TCGA-AD-6964-01 | Colorectum | colon adenocarcinoma | Male | <65 | III/IV | Chemotherapy | folfox | PD | |
| HIST2H2BF | SNV | Missense_Mutation | novel | c.356N>G | p.Val119Gly | p.V119G | Q5QNW6 | protein_coding | deleterious_low_confidence(0) | probably_damaging(0.925) | TCGA-AP-A054-01 | Endometrium | uterine corpus endometrioid carcinoma | Female | <65 | III/IV | Chemotherapy | carboplatin | PD |
| HIST2H2BF | SNV | Missense_Mutation | c.131N>T | p.Lys44Met | p.K44M | Q5QNW6 | protein_coding | deleterious_low_confidence(0) | probably_damaging(0.982) | TCGA-AP-A1DP-01 | Endometrium | uterine corpus endometrioid carcinoma | Female | >=65 | I/II | Chemotherapy | paclitaxel | PD | |
| HIST2H2BF | SNV | Missense_Mutation | rs782732328 | c.244G>A | p.Ala82Thr | p.A82T | Q5QNW6 | protein_coding | deleterious_low_confidence(0.02) | probably_damaging(0.984) | TCGA-B5-A11E-01 | Endometrium | uterine corpus endometrioid carcinoma | Female | <65 | I/II | Unknown | Unknown | SD |
| HIST2H2BF | SNV | Missense_Mutation | novel | c.214G>A | p.Glu72Lys | p.E72K | Q5QNW6 | protein_coding | deleterious_low_confidence(0.04) | benign(0.115) | TCGA-DF-A2KZ-01 | Endometrium | uterine corpus endometrioid carcinoma | Female | >=65 | I/II | Unknown | Unknown | SD |
| Page: 1 2 3 |
Top |
Related drugs of malignant transformation related genes |
| Identification of chemicals and drugs interact with genes involved in malignant transfromation |
| (DGIdb 4.0) |
| Entrez ID | Symbol | Category | Interaction Types | Drug Claim Name | Drug Name | PMIDs |
| Page: 1 |

Copyright 2023-Present -The University of Texas Health Science Center at Houston |