
|
|||||
|
 | |
| |
| |
| |
| |
| |
|
Gene: HIST2H2BE |
Gene summary for HIST2H2BE |
| Gene information | Species | Human | Gene symbol | HIST2H2BE | Gene ID | 8349 |
| Gene name | H2B clustered histone 21 | |
| Gene Alias | GL105 | |
| Cytomap | 1q21.2 | |
| Gene Type | protein-coding | GO ID | GO:0002227 | UniProtAcc | Q16778 |
Top |
Malignant transformation analysis |
| Identification of the aberrant gene expression in precancerous and cancerous lesions by comparing the gene expression of stem-like cells in diseased tissues with normal stem cells |
| Entrez ID | Symbol | Replicates | Species | Organ | Tissue | Adj P-value | Log2FC | Malignancy |
| 8349 | HIST2H2BE | LZE4T | Human | Esophagus | ESCC | 1.93e-05 | 2.03e-01 | 0.0811 |
| 8349 | HIST2H2BE | LZE20T | Human | Esophagus | ESCC | 4.39e-04 | 1.64e-01 | 0.0662 |
| 8349 | HIST2H2BE | LZE24T | Human | Esophagus | ESCC | 2.89e-09 | 2.86e-01 | 0.0596 |
| 8349 | HIST2H2BE | LZE21T | Human | Esophagus | ESCC | 6.96e-03 | 3.00e-01 | 0.0655 |
| 8349 | HIST2H2BE | P1T-E | Human | Esophagus | ESCC | 4.87e-11 | 4.39e-01 | 0.0875 |
| 8349 | HIST2H2BE | P2T-E | Human | Esophagus | ESCC | 1.49e-16 | 1.88e-01 | 0.1177 |
| 8349 | HIST2H2BE | P4T-E | Human | Esophagus | ESCC | 6.36e-15 | 2.05e-01 | 0.1323 |
| 8349 | HIST2H2BE | P5T-E | Human | Esophagus | ESCC | 4.91e-03 | -3.37e-03 | 0.1327 |
| 8349 | HIST2H2BE | P8T-E | Human | Esophagus | ESCC | 7.03e-16 | 3.99e-01 | 0.0889 |
| 8349 | HIST2H2BE | P9T-E | Human | Esophagus | ESCC | 1.53e-05 | 2.63e-01 | 0.1131 |
| 8349 | HIST2H2BE | P10T-E | Human | Esophagus | ESCC | 9.43e-18 | 3.89e-01 | 0.116 |
| 8349 | HIST2H2BE | P12T-E | Human | Esophagus | ESCC | 4.15e-13 | 4.92e-01 | 0.1122 |
| 8349 | HIST2H2BE | P15T-E | Human | Esophagus | ESCC | 8.39e-10 | 3.47e-01 | 0.1149 |
| 8349 | HIST2H2BE | P16T-E | Human | Esophagus | ESCC | 1.15e-12 | 1.76e-01 | 0.1153 |
| 8349 | HIST2H2BE | P20T-E | Human | Esophagus | ESCC | 4.01e-16 | 6.19e-01 | 0.1124 |
| 8349 | HIST2H2BE | P21T-E | Human | Esophagus | ESCC | 6.90e-07 | 1.66e-02 | 0.1617 |
| 8349 | HIST2H2BE | P22T-E | Human | Esophagus | ESCC | 1.77e-20 | 3.98e-01 | 0.1236 |
| 8349 | HIST2H2BE | P23T-E | Human | Esophagus | ESCC | 1.33e-24 | 7.38e-01 | 0.108 |
| 8349 | HIST2H2BE | P24T-E | Human | Esophagus | ESCC | 1.20e-05 | 3.63e-01 | 0.1287 |
| 8349 | HIST2H2BE | P26T-E | Human | Esophagus | ESCC | 4.89e-23 | 5.62e-01 | 0.1276 |
| Page: 1 2 3 4 |
| Tissue | Expression Dynamics | Abbreviation |
| Esophagus |  | ESCC: Esophageal squamous cell carcinoma |
| HGIN: High-grade intraepithelial neoplasias | ||
| LGIN: Low-grade intraepithelial neoplasias | ||
| Oral Cavity |  | EOLP: Erosive Oral lichen planus |
| LP: leukoplakia | ||
| NEOLP: Non-erosive oral lichen planus | ||
| OSCC: Oral squamous cell carcinoma | ||
| Prostate |  | BPH: Benign Prostatic Hyperplasia |
| Skin | 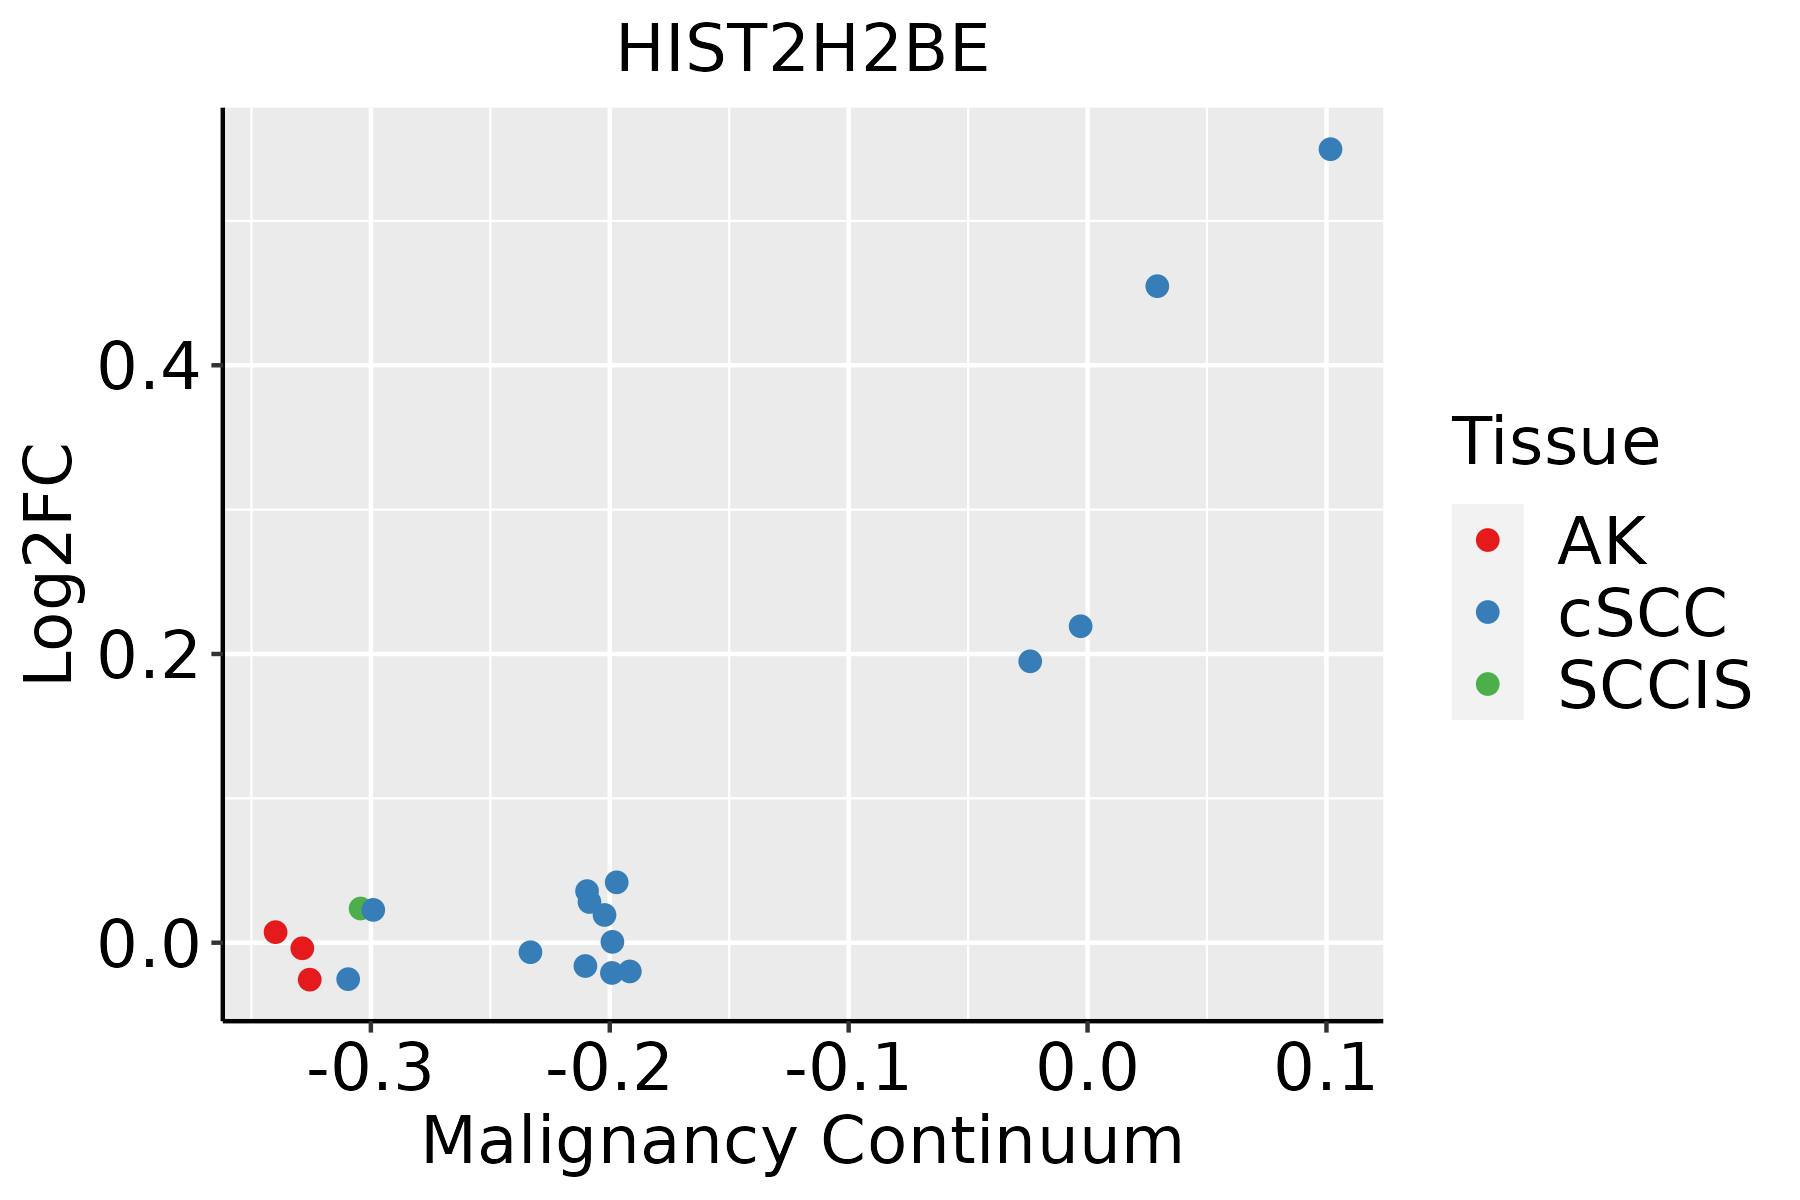 | AK: Actinic keratosis |
| cSCC: Cutaneous squamous cell carcinoma | ||
| SCCIS:squamous cell carcinoma in situ |
| ∗log2FC in expression of this searched gene in stem-like cells from each diseased tissue sample relative to stem-like cells in normal samples in each tissue plotted against the malignancy continuum. Samples are colored based on if they are from different disease stage. |
Top |
Malignant transformation related pathway analysis |
| Find out the enriched GO biological processes and KEGG pathways involved in transition from healthy to precancer to cancer |
| Tissue | Disease Stage | Enriched GO biological Processes |
| Colorectum | AD |  |
| Colorectum | SER |  |
| Colorectum | MSS |  |
| Colorectum | MSI-H |  |
| Colorectum | FAP |  |
| ∗Top 15 enriched GO BP terms are showed in the bar plot of each disease state in each tissue. Each row represents a significant GO biological process which is colored according to the -log10(p.adjust). |
| Page: 1 2 3 4 5 6 7 8 9 |
| GO ID | Tissue | Disease Stage | Description | Gene Ratio | Bg Ratio | pvalue | p.adjust | Count |
| Page: 1 |
| Pathway ID | Tissue | Disease Stage | Description | Gene Ratio | Bg Ratio | pvalue | p.adjust | qvalue | Count |
| Page: 1 |
Top |
Cell-cell communication analysis |
| Identification of potential cell-cell interactions between two cell types and their ligand-receptor pairs for different disease states |
| Ligand | Receptor | LRpair | Pathway | Tissue | Disease Stage |
| Page: 1 |
Top |
Single-cell gene regulatory network inference analysis |
| Find out the significant the regulons (TFs) and the target genes of each regulon across cell types for different disease states |
| TF | Cell Type | Tissue | Disease Stage | Target Gene | RSS | Regulon Activity |
| ∗The dot plots of a searched regulon are shown for all cell subpopulations in each disease state of each tissue based on the regulon specific score inferred using pySCENIC and by calculating the average expression. |
| Page: 1 |
Top |
Somatic mutation of malignant transformation related genes |
| Annotation of somatic variants for genes involved in malignant transformation |
| Hugo Symbol | Variant Class | Variant Classification | dbSNP RS | HGVSc | HGVSp | HGVSp Short | SWISSPROT | BIOTYPE | SIFT | PolyPhen | Tumor Sample Barcode | Tissue | Histology | Sex | Age | Stage | Therapy Types | Drugs | Outcome |
| HIST2H2BE | SNV | Missense_Mutation | c.340N>A | p.Glu114Lys | p.E114K | Q16778 | protein_coding | tolerated_low_confidence(0.07) | benign(0.014) | TCGA-A2-A0EO-01 | Breast | breast invasive carcinoma | Female | <65 | I/II | Hormone Therapy | tamoxiphen | SD | |
| HIST2H2BE | SNV | Missense_Mutation | novel | c.263N>G | p.Ser88Cys | p.S88C | Q16778 | protein_coding | deleterious_low_confidence(0) | probably_damaging(0.924) | TCGA-AC-A5XS-01 | Breast | breast invasive carcinoma | Female | >=65 | I/II | Hormone Therapy | femara | SD |
| HIST2H2BE | SNV | Missense_Mutation | c.213N>G | p.Phe71Leu | p.F71L | Q16778 | protein_coding | deleterious_low_confidence(0.02) | benign(0.404) | TCGA-C8-A8HP-01 | Breast | breast invasive carcinoma | Female | <65 | III/IV | Chemotherapy | 5-fluorouracil | CR | |
| HIST2H2BE | SNV | Missense_Mutation | c.120C>G | p.Ile40Met | p.I40M | Q16778 | protein_coding | tolerated_low_confidence(0.14) | benign(0.005) | TCGA-E2-A10C-01 | Breast | breast invasive carcinoma | Female | <65 | I/II | Chemotherapy | cytoxan | SD | |
| HIST2H2BE | SNV | Missense_Mutation | c.213N>G | p.Phe71Leu | p.F71L | Q16778 | protein_coding | deleterious_low_confidence(0.02) | benign(0.404) | TCGA-C5-A1BL-01 | Cervix | cervical & endocervical cancer | Female | <65 | I/II | Unknown | Unknown | SD | |
| HIST2H2BE | SNV | Missense_Mutation | c.213C>G | p.Phe71Leu | p.F71L | Q16778 | protein_coding | deleterious_low_confidence(0.02) | benign(0.404) | TCGA-C5-A2LX-01 | Cervix | cervical & endocervical cancer | Female | <65 | I/II | Chemotherapy | cisplatin | SD | |
| HIST2H2BE | SNV | Missense_Mutation | c.17A>T | p.Lys6Ile | p.K6I | Q16778 | protein_coding | deleterious_low_confidence(0) | benign(0.041) | TCGA-CK-4951-01 | Colorectum | colon adenocarcinoma | Female | >=65 | I/II | Unknown | Unknown | PD | |
| HIST2H2BE | SNV | Missense_Mutation | novel | c.310N>T | p.Pro104Ser | p.P104S | Q16778 | protein_coding | deleterious_low_confidence(0) | possibly_damaging(0.905) | TCGA-A5-A0G2-01 | Endometrium | uterine corpus endometrioid carcinoma | Female | <65 | III/IV | Unknown | Unknown | SD |
| HIST2H2BE | SNV | Missense_Mutation | novel | c.172A>G | p.Lys58Glu | p.K58E | Q16778 | protein_coding | deleterious_low_confidence(0.01) | probably_damaging(0.933) | TCGA-AX-A1CE-01 | Endometrium | uterine corpus endometrioid carcinoma | Female | <65 | I/II | Unspecific | Paclitaxel | SD |
| HIST2H2BE | SNV | Missense_Mutation | c.189G>T | p.Met63Ile | p.M63I | Q16778 | protein_coding | deleterious_low_confidence(0.03) | benign(0.087) | TCGA-B5-A0JY-01 | Endometrium | uterine corpus endometrioid carcinoma | Female | <65 | III/IV | Chemotherapy | doxorubicin | SD |
| Page: 1 2 3 |
Top |
Related drugs of malignant transformation related genes |
| Identification of chemicals and drugs interact with genes involved in malignant transfromation |
| (DGIdb 4.0) |
| Entrez ID | Symbol | Category | Interaction Types | Drug Claim Name | Drug Name | PMIDs |
| Page: 1 |

Copyright 2023-Present -The University of Texas Health Science Center at Houston |