
|
|||||
|
 | |
| |
| |
| |
| |
| |
|
Gene: HIST2H2AC |
Gene summary for HIST2H2AC |
| Gene information | Species | Human | Gene symbol | HIST2H2AC | Gene ID | 8338 |
| Gene name | H2A clustered histone 20 | |
| Gene Alias | H2A | |
| Cytomap | 1q21.2 | |
| Gene Type | protein-coding | GO ID | GO:0008150 | UniProtAcc | Q16777 |
Top |
Malignant transformation analysis |
| Identification of the aberrant gene expression in precancerous and cancerous lesions by comparing the gene expression of stem-like cells in diseased tissues with normal stem cells |
| Entrez ID | Symbol | Replicates | Species | Organ | Tissue | Adj P-value | Log2FC | Malignancy |
| 8338 | HIST2H2AC | LZE4T | Human | Esophagus | ESCC | 2.81e-02 | 1.10e-01 | 0.0811 |
| 8338 | HIST2H2AC | LZE7T | Human | Esophagus | ESCC | 2.23e-03 | 1.55e-01 | 0.0667 |
| 8338 | HIST2H2AC | P1T-E | Human | Esophagus | ESCC | 2.13e-07 | 3.77e-01 | 0.0875 |
| 8338 | HIST2H2AC | P2T-E | Human | Esophagus | ESCC | 2.02e-06 | 2.61e-01 | 0.1177 |
| 8338 | HIST2H2AC | P4T-E | Human | Esophagus | ESCC | 3.93e-04 | 1.28e-01 | 0.1323 |
| 8338 | HIST2H2AC | P5T-E | Human | Esophagus | ESCC | 4.71e-13 | 3.18e-01 | 0.1327 |
| 8338 | HIST2H2AC | P8T-E | Human | Esophagus | ESCC | 1.01e-05 | 7.78e-02 | 0.0889 |
| 8338 | HIST2H2AC | P9T-E | Human | Esophagus | ESCC | 2.74e-03 | 8.66e-02 | 0.1131 |
| 8338 | HIST2H2AC | P10T-E | Human | Esophagus | ESCC | 1.84e-08 | 1.47e-01 | 0.116 |
| 8338 | HIST2H2AC | P11T-E | Human | Esophagus | ESCC | 4.29e-04 | 2.01e-01 | 0.1426 |
| 8338 | HIST2H2AC | P12T-E | Human | Esophagus | ESCC | 1.34e-04 | 1.43e-01 | 0.1122 |
| 8338 | HIST2H2AC | P15T-E | Human | Esophagus | ESCC | 3.59e-12 | 2.20e-01 | 0.1149 |
| 8338 | HIST2H2AC | P16T-E | Human | Esophagus | ESCC | 2.15e-07 | 1.25e-01 | 0.1153 |
| 8338 | HIST2H2AC | P17T-E | Human | Esophagus | ESCC | 3.63e-05 | 2.32e-01 | 0.1278 |
| 8338 | HIST2H2AC | P20T-E | Human | Esophagus | ESCC | 3.56e-11 | 3.36e-01 | 0.1124 |
| 8338 | HIST2H2AC | P21T-E | Human | Esophagus | ESCC | 5.43e-05 | 1.10e-01 | 0.1617 |
| 8338 | HIST2H2AC | P22T-E | Human | Esophagus | ESCC | 1.23e-05 | 8.94e-02 | 0.1236 |
| 8338 | HIST2H2AC | P23T-E | Human | Esophagus | ESCC | 3.73e-03 | 2.07e-01 | 0.108 |
| 8338 | HIST2H2AC | P24T-E | Human | Esophagus | ESCC | 1.87e-05 | 1.51e-01 | 0.1287 |
| 8338 | HIST2H2AC | P26T-E | Human | Esophagus | ESCC | 4.47e-06 | 1.47e-01 | 0.1276 |
| Page: 1 2 3 4 |
| Tissue | Expression Dynamics | Abbreviation |
| Esophagus | 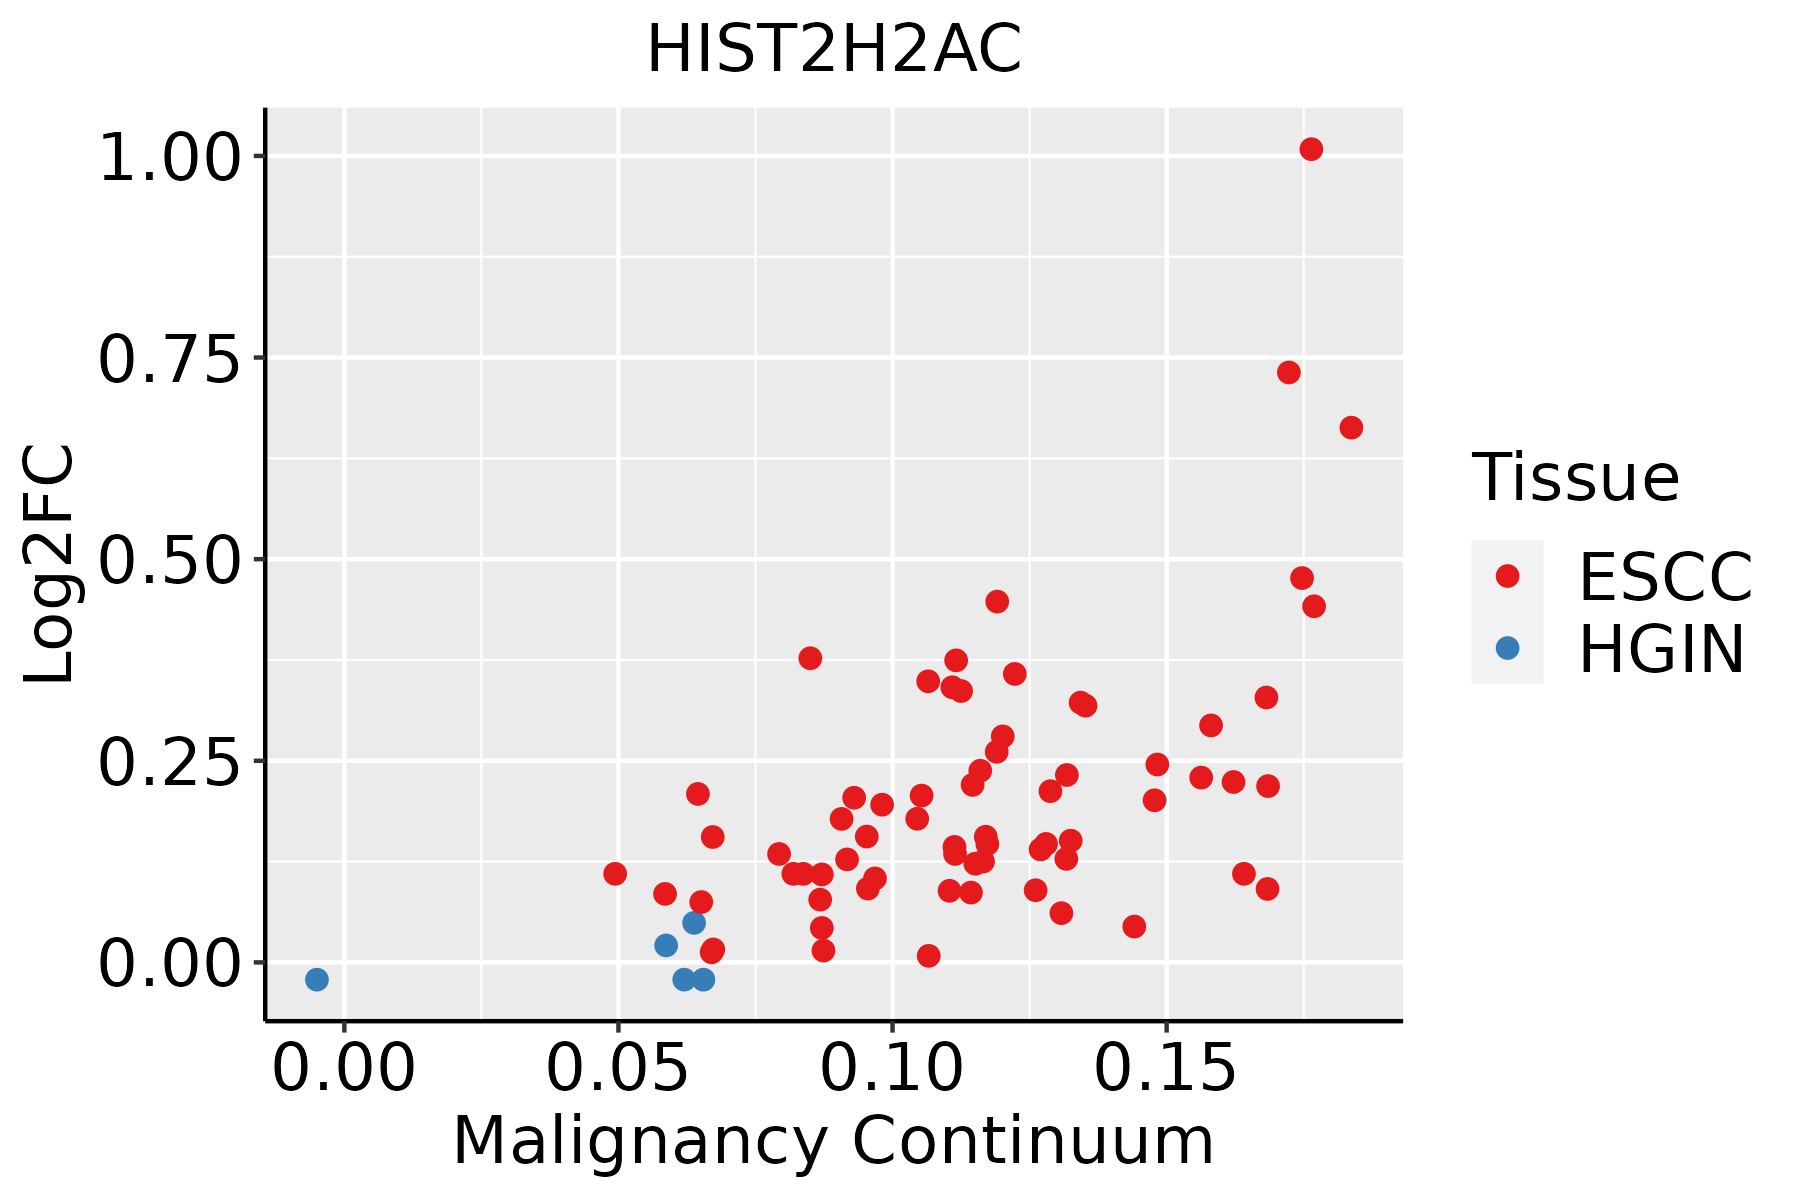 | ESCC: Esophageal squamous cell carcinoma |
| HGIN: High-grade intraepithelial neoplasias | ||
| LGIN: Low-grade intraepithelial neoplasias | ||
| Skin |  | AK: Actinic keratosis |
| cSCC: Cutaneous squamous cell carcinoma | ||
| SCCIS:squamous cell carcinoma in situ | ||
| Thyroid | 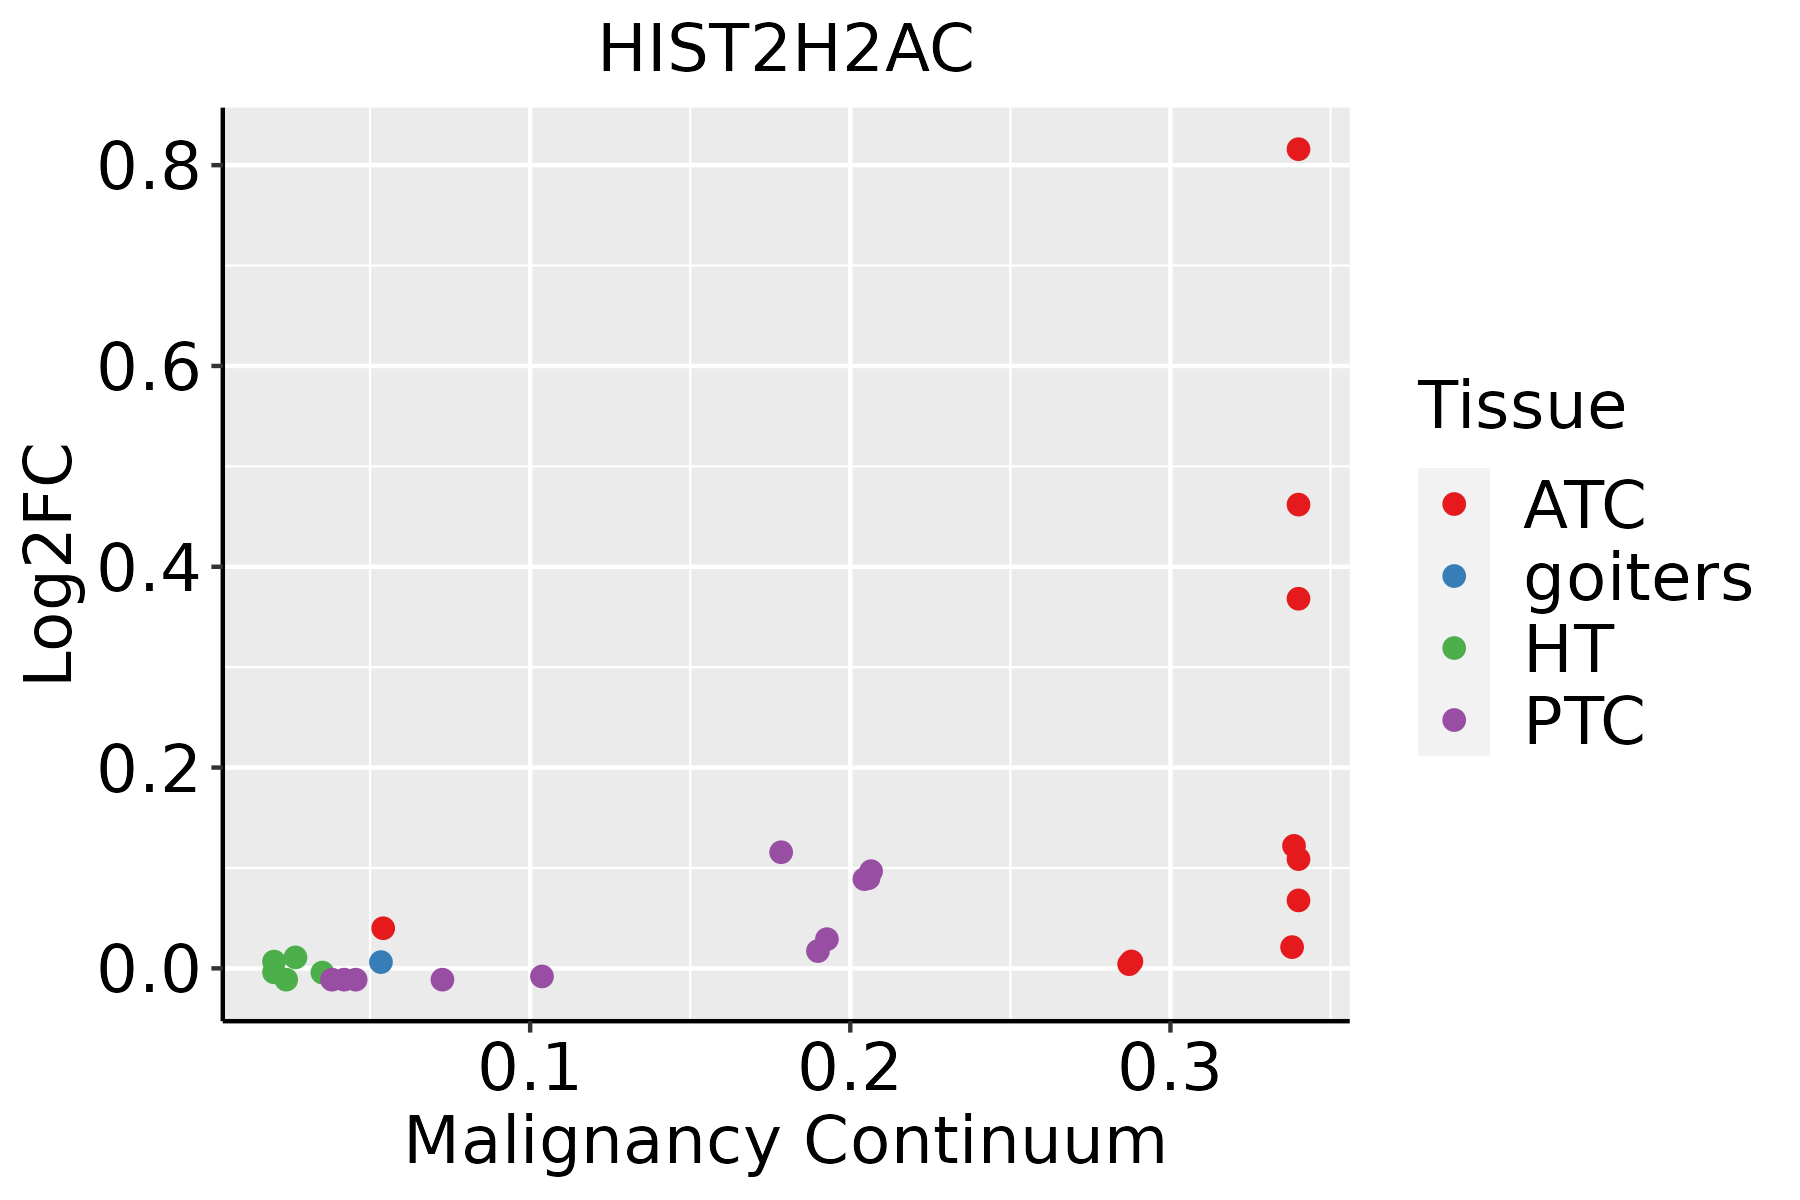 | ATC: Anaplastic thyroid cancer |
| HT: Hashimoto's thyroiditis | ||
| PTC: Papillary thyroid cancer |
| ∗log2FC in expression of this searched gene in stem-like cells from each diseased tissue sample relative to stem-like cells in normal samples in each tissue plotted against the malignancy continuum. Samples are colored based on if they are from different disease stage. |
Top |
Malignant transformation related pathway analysis |
| Find out the enriched GO biological processes and KEGG pathways involved in transition from healthy to precancer to cancer |
| Tissue | Disease Stage | Enriched GO biological Processes |
| Colorectum | AD |  |
| Colorectum | SER |  |
| Colorectum | MSS |  |
| Colorectum | MSI-H |  |
| Colorectum | FAP |  |
| ∗Top 15 enriched GO BP terms are showed in the bar plot of each disease state in each tissue. Each row represents a significant GO biological process which is colored according to the -log10(p.adjust). |
| Page: 1 2 3 4 5 6 7 8 9 |
| GO ID | Tissue | Disease Stage | Description | Gene Ratio | Bg Ratio | pvalue | p.adjust | Count |
| Page: 1 |
| Pathway ID | Tissue | Disease Stage | Description | Gene Ratio | Bg Ratio | pvalue | p.adjust | qvalue | Count |
| Page: 1 |
Top |
Cell-cell communication analysis |
| Identification of potential cell-cell interactions between two cell types and their ligand-receptor pairs for different disease states |
| Ligand | Receptor | LRpair | Pathway | Tissue | Disease Stage |
| Page: 1 |
Top |
Single-cell gene regulatory network inference analysis |
| Find out the significant the regulons (TFs) and the target genes of each regulon across cell types for different disease states |
| TF | Cell Type | Tissue | Disease Stage | Target Gene | RSS | Regulon Activity |
| ∗The dot plots of a searched regulon are shown for all cell subpopulations in each disease state of each tissue based on the regulon specific score inferred using pySCENIC and by calculating the average expression. |
| Page: 1 |
Top |
Somatic mutation of malignant transformation related genes |
| Annotation of somatic variants for genes involved in malignant transformation |
| Hugo Symbol | Variant Class | Variant Classification | dbSNP RS | HGVSc | HGVSp | HGVSp Short | SWISSPROT | BIOTYPE | SIFT | PolyPhen | Tumor Sample Barcode | Tissue | Histology | Sex | Age | Stage | Therapy Types | Drugs | Outcome |
| HIST2H2AC | SNV | Missense_Mutation | c.287N>T | p.Lys96Met | p.K96M | Q16777 | protein_coding | deleterious_low_confidence(0) | probably_damaging(0.925) | TCGA-AO-A03T-01 | Breast | breast invasive carcinoma | Female | <65 | I/II | Chemotherapy | cyclophosphamide | SD | |
| HIST2H2AC | insertion | Frame_Shift_Ins | novel | c.344_345insTCTG | p.Leu117SerfsTer? | p.L117Sfs*? | Q16777 | protein_coding | TCGA-AN-A0G0-01 | Breast | breast invasive carcinoma | Female | <65 | I/II | Unknown | Unknown | SD | ||
| HIST2H2AC | SNV | Missense_Mutation | novel | c.89G>C | p.Arg30Pro | p.R30P | Q16777 | protein_coding | deleterious_low_confidence(0) | probably_damaging(1) | TCGA-IR-A3LK-01 | Cervix | cervical & endocervical cancer | Female | >=65 | I/II | Chemotherapy | cisplatin | PD |
| HIST2H2AC | SNV | Missense_Mutation | novel | c.89N>C | p.Arg30Pro | p.R30P | Q16777 | protein_coding | deleterious_low_confidence(0) | probably_damaging(1) | TCGA-Q1-A6DT-01 | Cervix | cervical & endocervical cancer | Female | <65 | I/II | Unknown | Unknown | PD |
| HIST2H2AC | SNV | Missense_Mutation | c.304N>G | p.Thr102Ala | p.T102A | Q16777 | protein_coding | deleterious_low_confidence(0.01) | benign(0.249) | TCGA-AA-3715-01 | Colorectum | colon adenocarcinoma | Male | >=65 | I/II | Unknown | Unknown | PD | |
| HIST2H2AC | SNV | Missense_Mutation | novel | c.58N>C | p.Ser20Pro | p.S20P | Q16777 | protein_coding | deleterious_low_confidence(0.02) | probably_damaging(0.98) | TCGA-AD-6895-01 | Colorectum | colon adenocarcinoma | Male | >=65 | III/IV | Unknown | Unknown | SD |
| HIST2H2AC | SNV | Missense_Mutation | c.230C>T | p.Thr77Met | p.T77M | Q16777 | protein_coding | tolerated_low_confidence(0.08) | probably_damaging(0.927) | TCGA-CK-4951-01 | Colorectum | colon adenocarcinoma | Female | >=65 | I/II | Unknown | Unknown | PD | |
| HIST2H2AC | SNV | Missense_Mutation | c.229A>G | p.Thr77Ala | p.T77A | Q16777 | protein_coding | deleterious_low_confidence(0.04) | benign(0.003) | TCGA-CM-5861-01 | Colorectum | colon adenocarcinoma | Female | <65 | I/II | Unknown | Unknown | PD | |
| HIST2H2AC | insertion | Frame_Shift_Ins | novel | c.388_389insA | p.Ter130%3D | p.*130%3D | Q16777 | protein_coding | TCGA-AA-A01K-01 | Colorectum | colon adenocarcinoma | Female | >=65 | III/IV | Chemotherapy | folinic | CR | ||
| HIST2H2AC | deletion | Frame_Shift_Del | c.298_299delNN | p.Lys100SerfsTer11 | p.K100Sfs*11 | Q16777 | protein_coding | TCGA-AG-3881-01 | Colorectum | rectum adenocarcinoma | Female | >=65 | I/II | Unknown | Unknown | SD |
| Page: 1 2 3 4 |
Top |
Related drugs of malignant transformation related genes |
| Identification of chemicals and drugs interact with genes involved in malignant transfromation |
| (DGIdb 4.0) |
| Entrez ID | Symbol | Category | Interaction Types | Drug Claim Name | Drug Name | PMIDs |
| Page: 1 |

Copyright 2023-Present -The University of Texas Health Science Center at Houston |