
|
|||||
|
 | |
| |
| |
| |
| |
| |
|
Gene: HIST1H3C |
Gene summary for HIST1H3C |
| Gene information | Species | Human | Gene symbol | HIST1H3C | Gene ID | 8352 |
| Gene name | H3 clustered histone 3 | |
| Gene Alias | H3.1 | |
| Cytomap | 6p22.2 | |
| Gene Type | protein-coding | GO ID | GO:0006323 | UniProtAcc | P68431 |
Top |
Malignant transformation analysis |
| Identification of the aberrant gene expression in precancerous and cancerous lesions by comparing the gene expression of stem-like cells in diseased tissues with normal stem cells |
| Entrez ID | Symbol | Replicates | Species | Organ | Tissue | Adj P-value | Log2FC | Malignancy |
| 8352 | HIST1H3C | LZE7T | Human | Esophagus | ESCC | 1.62e-04 | 2.31e-01 | 0.0667 |
| 8352 | HIST1H3C | P1T-E | Human | Esophagus | ESCC | 2.65e-12 | 1.00e+00 | 0.0875 |
| 8352 | HIST1H3C | P4T-E | Human | Esophagus | ESCC | 1.05e-03 | 1.36e-01 | 0.1323 |
| 8352 | HIST1H3C | P8T-E | Human | Esophagus | ESCC | 3.50e-02 | 1.11e-01 | 0.0889 |
| 8352 | HIST1H3C | P10T-E | Human | Esophagus | ESCC | 4.30e-10 | 2.28e-01 | 0.116 |
| 8352 | HIST1H3C | P20T-E | Human | Esophagus | ESCC | 1.51e-02 | 2.44e-01 | 0.1124 |
| 8352 | HIST1H3C | P26T-E | Human | Esophagus | ESCC | 3.50e-02 | 8.86e-02 | 0.1276 |
| 8352 | HIST1H3C | P27T-E | Human | Esophagus | ESCC | 8.84e-05 | 1.68e-01 | 0.1055 |
| 8352 | HIST1H3C | P31T-E | Human | Esophagus | ESCC | 8.84e-05 | 1.38e-01 | 0.1251 |
| 8352 | HIST1H3C | P37T-E | Human | Esophagus | ESCC | 1.53e-03 | 1.18e-01 | 0.1371 |
| 8352 | HIST1H3C | P42T-E | Human | Esophagus | ESCC | 9.46e-03 | 1.43e-01 | 0.1175 |
| 8352 | HIST1H3C | P47T-E | Human | Esophagus | ESCC | 3.75e-03 | 1.17e-01 | 0.1067 |
| 8352 | HIST1H3C | P48T-E | Human | Esophagus | ESCC | 3.97e-04 | 1.62e-01 | 0.0959 |
| 8352 | HIST1H3C | P52T-E | Human | Esophagus | ESCC | 5.00e-17 | 4.61e-01 | 0.1555 |
| 8352 | HIST1H3C | P54T-E | Human | Esophagus | ESCC | 1.34e-09 | 3.41e-01 | 0.0975 |
| 8352 | HIST1H3C | P61T-E | Human | Esophagus | ESCC | 4.84e-16 | 5.81e-01 | 0.099 |
| 8352 | HIST1H3C | P65T-E | Human | Esophagus | ESCC | 1.45e-09 | 2.82e-01 | 0.0978 |
| 8352 | HIST1H3C | P89T-E | Human | Esophagus | ESCC | 4.86e-05 | 2.73e-01 | 0.1752 |
| 8352 | HIST1H3C | P91T-E | Human | Esophagus | ESCC | 8.74e-05 | 4.02e-01 | 0.1828 |
| 8352 | HIST1H3C | P107T-E | Human | Esophagus | ESCC | 5.35e-04 | 3.33e-01 | 0.171 |
| Page: 1 2 |
| Tissue | Expression Dynamics | Abbreviation |
| Esophagus | 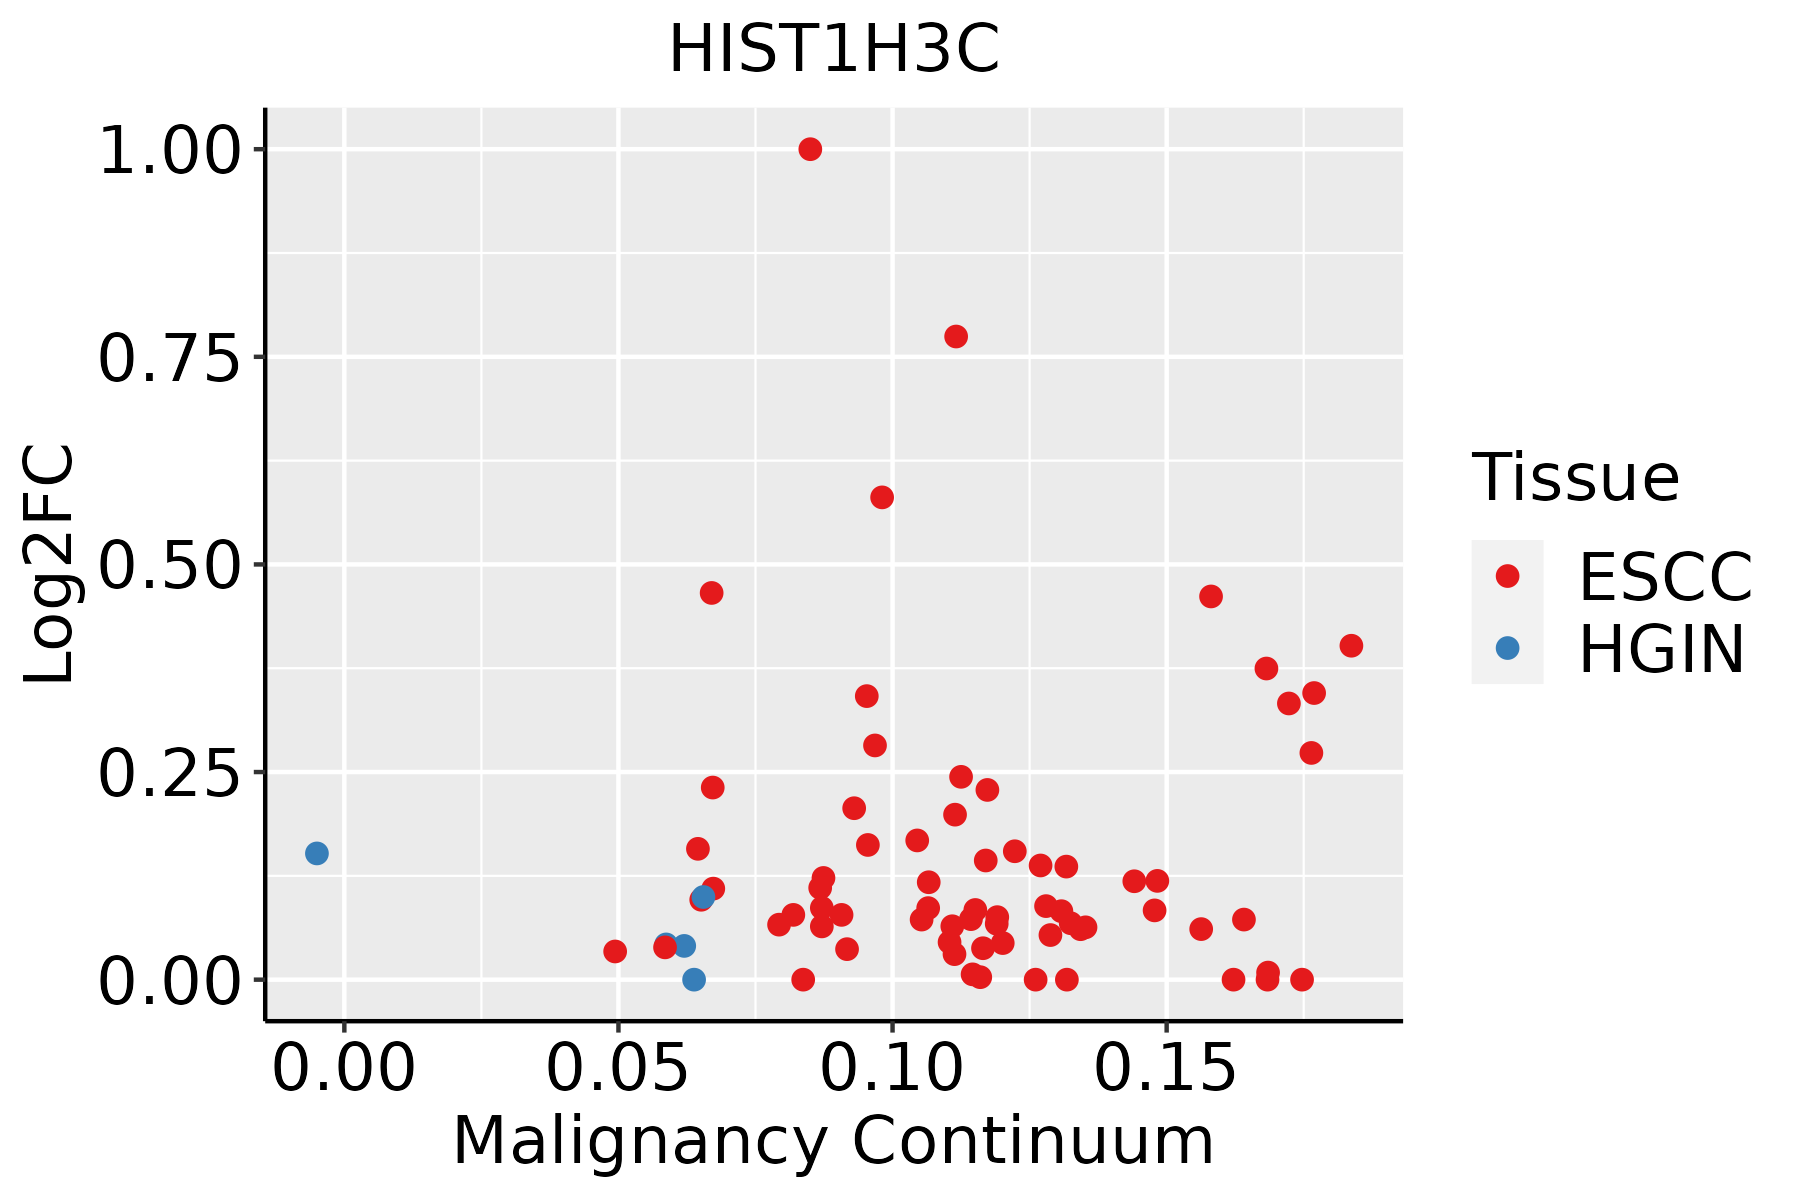 | ESCC: Esophageal squamous cell carcinoma |
| HGIN: High-grade intraepithelial neoplasias | ||
| LGIN: Low-grade intraepithelial neoplasias |
| ∗log2FC in expression of this searched gene in stem-like cells from each diseased tissue sample relative to stem-like cells in normal samples in each tissue plotted against the malignancy continuum. Samples are colored based on if they are from different disease stage. |
Top |
Malignant transformation related pathway analysis |
| Find out the enriched GO biological processes and KEGG pathways involved in transition from healthy to precancer to cancer |
| Tissue | Disease Stage | Enriched GO biological Processes |
| Colorectum | AD |  |
| Colorectum | SER |  |
| Colorectum | MSS |  |
| Colorectum | MSI-H |  |
| Colorectum | FAP |  |
| ∗Top 15 enriched GO BP terms are showed in the bar plot of each disease state in each tissue. Each row represents a significant GO biological process which is colored according to the -log10(p.adjust). |
| Page: 1 2 3 4 5 6 7 8 9 |
| GO ID | Tissue | Disease Stage | Description | Gene Ratio | Bg Ratio | pvalue | p.adjust | Count |
| Page: 1 |
| Pathway ID | Tissue | Disease Stage | Description | Gene Ratio | Bg Ratio | pvalue | p.adjust | qvalue | Count |
| Page: 1 |
Top |
Cell-cell communication analysis |
| Identification of potential cell-cell interactions between two cell types and their ligand-receptor pairs for different disease states |
| Ligand | Receptor | LRpair | Pathway | Tissue | Disease Stage |
| Page: 1 |
Top |
Single-cell gene regulatory network inference analysis |
| Find out the significant the regulons (TFs) and the target genes of each regulon across cell types for different disease states |
| TF | Cell Type | Tissue | Disease Stage | Target Gene | RSS | Regulon Activity |
| ∗The dot plots of a searched regulon are shown for all cell subpopulations in each disease state of each tissue based on the regulon specific score inferred using pySCENIC and by calculating the average expression. |
| Page: 1 |
Top |
Somatic mutation of malignant transformation related genes |
| Annotation of somatic variants for genes involved in malignant transformation |
| Hugo Symbol | Variant Class | Variant Classification | dbSNP RS | HGVSc | HGVSp | HGVSp Short | SWISSPROT | BIOTYPE | SIFT | PolyPhen | Tumor Sample Barcode | Tissue | Histology | Sex | Age | Stage | Therapy Types | Drugs | Outcome |
| HIST1H3C | SNV | Missense_Mutation | c.7C>G | p.Arg3Gly | p.R3G | P68431 | protein_coding | deleterious_low_confidence(0.04) | benign(0.015) | TCGA-AC-A23H-01 | Breast | breast invasive carcinoma | Female | >=65 | I/II | Unknown | Unknown | PD | |
| HIST1H3C | SNV | Missense_Mutation | c.88N>C | p.Ala30Pro | p.A30P | P68431 | protein_coding | deleterious_low_confidence(0) | possibly_damaging(0.559) | TCGA-C8-A130-01 | Breast | breast invasive carcinoma | Female | <65 | III/IV | Unknown | Unknown | SD | |
| HIST1H3C | SNV | Missense_Mutation | novel | c.37N>T | p.Gly13Cys | p.G13C | P68431 | protein_coding | deleterious_low_confidence(0) | benign(0.019) | TCGA-C5-A2M1-01 | Cervix | cervical & endocervical cancer | Female | <65 | I/II | Unknown | Unknown | SD |
| HIST1H3C | SNV | Missense_Mutation | c.292N>C | p.Glu98Gln | p.E98Q | P68431 | protein_coding | deleterious_low_confidence(0) | probably_damaging(0.974) | TCGA-IR-A3LH-01 | Cervix | cervical & endocervical cancer | Female | <65 | I/II | Chemotherapy | cisplatin | CR | |
| HIST1H3C | SNV | Missense_Mutation | novel | c.151G>A | p.Glu51Lys | p.E51K | P68431 | protein_coding | deleterious_low_confidence(0) | possibly_damaging(0.843) | TCGA-AA-3977-01 | Colorectum | colon adenocarcinoma | Male | >=65 | I/II | Unknown | Unknown | SD |
| HIST1H3C | SNV | Missense_Mutation | c.304G>A | p.Val102Met | p.V102M | P68431 | protein_coding | deleterious_low_confidence(0) | probably_damaging(0.992) | TCGA-CM-6163-01 | Colorectum | colon adenocarcinoma | Male | >=65 | I/II | Unknown | Unknown | SD | |
| HIST1H3C | SNV | Missense_Mutation | novel | c.244N>A | p.Asp82Asn | p.D82N | P68431 | protein_coding | deleterious_low_confidence(0.01) | possibly_damaging(0.755) | TCGA-A5-A0G1-01 | Endometrium | uterine corpus endometrioid carcinoma | Female | >=65 | I/II | Unknown | Unknown | SD |
| HIST1H3C | SNV | Missense_Mutation | c.250N>T | p.Arg84Cys | p.R84C | P68431 | protein_coding | deleterious_low_confidence(0.03) | benign(0.104) | TCGA-A5-A1OF-01 | Endometrium | uterine corpus endometrioid carcinoma | Female | <65 | I/II | Unknown | Unknown | SD | |
| HIST1H3C | SNV | Missense_Mutation | rs771458123 | c.260N>A | p.Ser87Asn | p.S87N | P68431 | protein_coding | deleterious_low_confidence(0) | benign(0.026) | TCGA-AX-A06F-01 | Endometrium | uterine corpus endometrioid carcinoma | Female | <65 | III/IV | Chemotherapy | carboplatin | SD |
| HIST1H3C | SNV | Missense_Mutation | c.149G>A | p.Arg50His | p.R50H | P68431 | protein_coding | deleterious_low_confidence(0.02) | benign(0.007) | TCGA-AX-A0J1-01 | Endometrium | uterine corpus endometrioid carcinoma | Female | >=65 | I/II | Unknown | Unknown | SD |
| Page: 1 2 3 4 |
Top |
Related drugs of malignant transformation related genes |
| Identification of chemicals and drugs interact with genes involved in malignant transfromation |
| (DGIdb 4.0) |
| Entrez ID | Symbol | Category | Interaction Types | Drug Claim Name | Drug Name | PMIDs |
| Page: 1 |

Copyright 2023-Present -The University of Texas Health Science Center at Houston |