
|
|||||
|
 | |
| |
| |
| |
| |
| |
|
Gene: HIST1H2BN |
Gene summary for HIST1H2BN |
| Gene information | Species | Human | Gene symbol | HIST1H2BN | Gene ID | 8341 |
| Gene name | H2B clustered histone 15 | |
| Gene Alias | H2B/d | |
| Cytomap | 6p22.1 | |
| Gene Type | protein-coding | GO ID | GO:0006323 | UniProtAcc | A0A024RCJ9 |
Top |
Malignant transformation analysis |
| Identification of the aberrant gene expression in precancerous and cancerous lesions by comparing the gene expression of stem-like cells in diseased tissues with normal stem cells |
| Entrez ID | Symbol | Replicates | Species | Organ | Tissue | Adj P-value | Log2FC | Malignancy |
| 8341 | HIST1H2BN | LZE4T | Human | Esophagus | ESCC | 5.68e-07 | 2.01e-01 | 0.0811 |
| 8341 | HIST1H2BN | LZE7T | Human | Esophagus | ESCC | 1.02e-03 | 1.83e-01 | 0.0667 |
| 8341 | HIST1H2BN | LZE20T | Human | Esophagus | ESCC | 1.97e-04 | 2.28e-01 | 0.0662 |
| 8341 | HIST1H2BN | LZE21D1 | Human | Esophagus | HGIN | 2.75e-06 | 4.44e-01 | 0.0632 |
| 8341 | HIST1H2BN | LZE22T | Human | Esophagus | ESCC | 1.00e-09 | 5.96e-01 | 0.068 |
| 8341 | HIST1H2BN | LZE24T | Human | Esophagus | ESCC | 2.20e-04 | 1.73e-01 | 0.0596 |
| 8341 | HIST1H2BN | LZE21T | Human | Esophagus | ESCC | 1.16e-05 | 2.65e-01 | 0.0655 |
| 8341 | HIST1H2BN | P1T-E | Human | Esophagus | ESCC | 1.59e-20 | 8.62e-01 | 0.0875 |
| 8341 | HIST1H2BN | P2T-E | Human | Esophagus | ESCC | 1.73e-24 | 5.26e-01 | 0.1177 |
| 8341 | HIST1H2BN | P4T-E | Human | Esophagus | ESCC | 4.27e-09 | 2.30e-01 | 0.1323 |
| 8341 | HIST1H2BN | P8T-E | Human | Esophagus | ESCC | 9.02e-03 | 8.95e-02 | 0.0889 |
| 8341 | HIST1H2BN | P9T-E | Human | Esophagus | ESCC | 3.05e-07 | 1.83e-01 | 0.1131 |
| 8341 | HIST1H2BN | P10T-E | Human | Esophagus | ESCC | 3.05e-07 | 2.57e-01 | 0.116 |
| 8341 | HIST1H2BN | P12T-E | Human | Esophagus | ESCC | 1.98e-13 | 2.47e-01 | 0.1122 |
| 8341 | HIST1H2BN | P15T-E | Human | Esophagus | ESCC | 7.99e-08 | 2.08e-01 | 0.1149 |
| 8341 | HIST1H2BN | P16T-E | Human | Esophagus | ESCC | 2.08e-07 | 2.44e-01 | 0.1153 |
| 8341 | HIST1H2BN | P20T-E | Human | Esophagus | ESCC | 8.21e-21 | 4.81e-01 | 0.1124 |
| 8341 | HIST1H2BN | P21T-E | Human | Esophagus | ESCC | 5.33e-04 | 4.20e-02 | 0.1617 |
| 8341 | HIST1H2BN | P22T-E | Human | Esophagus | ESCC | 7.75e-19 | 3.95e-01 | 0.1236 |
| 8341 | HIST1H2BN | P23T-E | Human | Esophagus | ESCC | 4.42e-05 | 1.95e-01 | 0.108 |
| Page: 1 2 3 |
| Tissue | Expression Dynamics | Abbreviation |
| Esophagus | 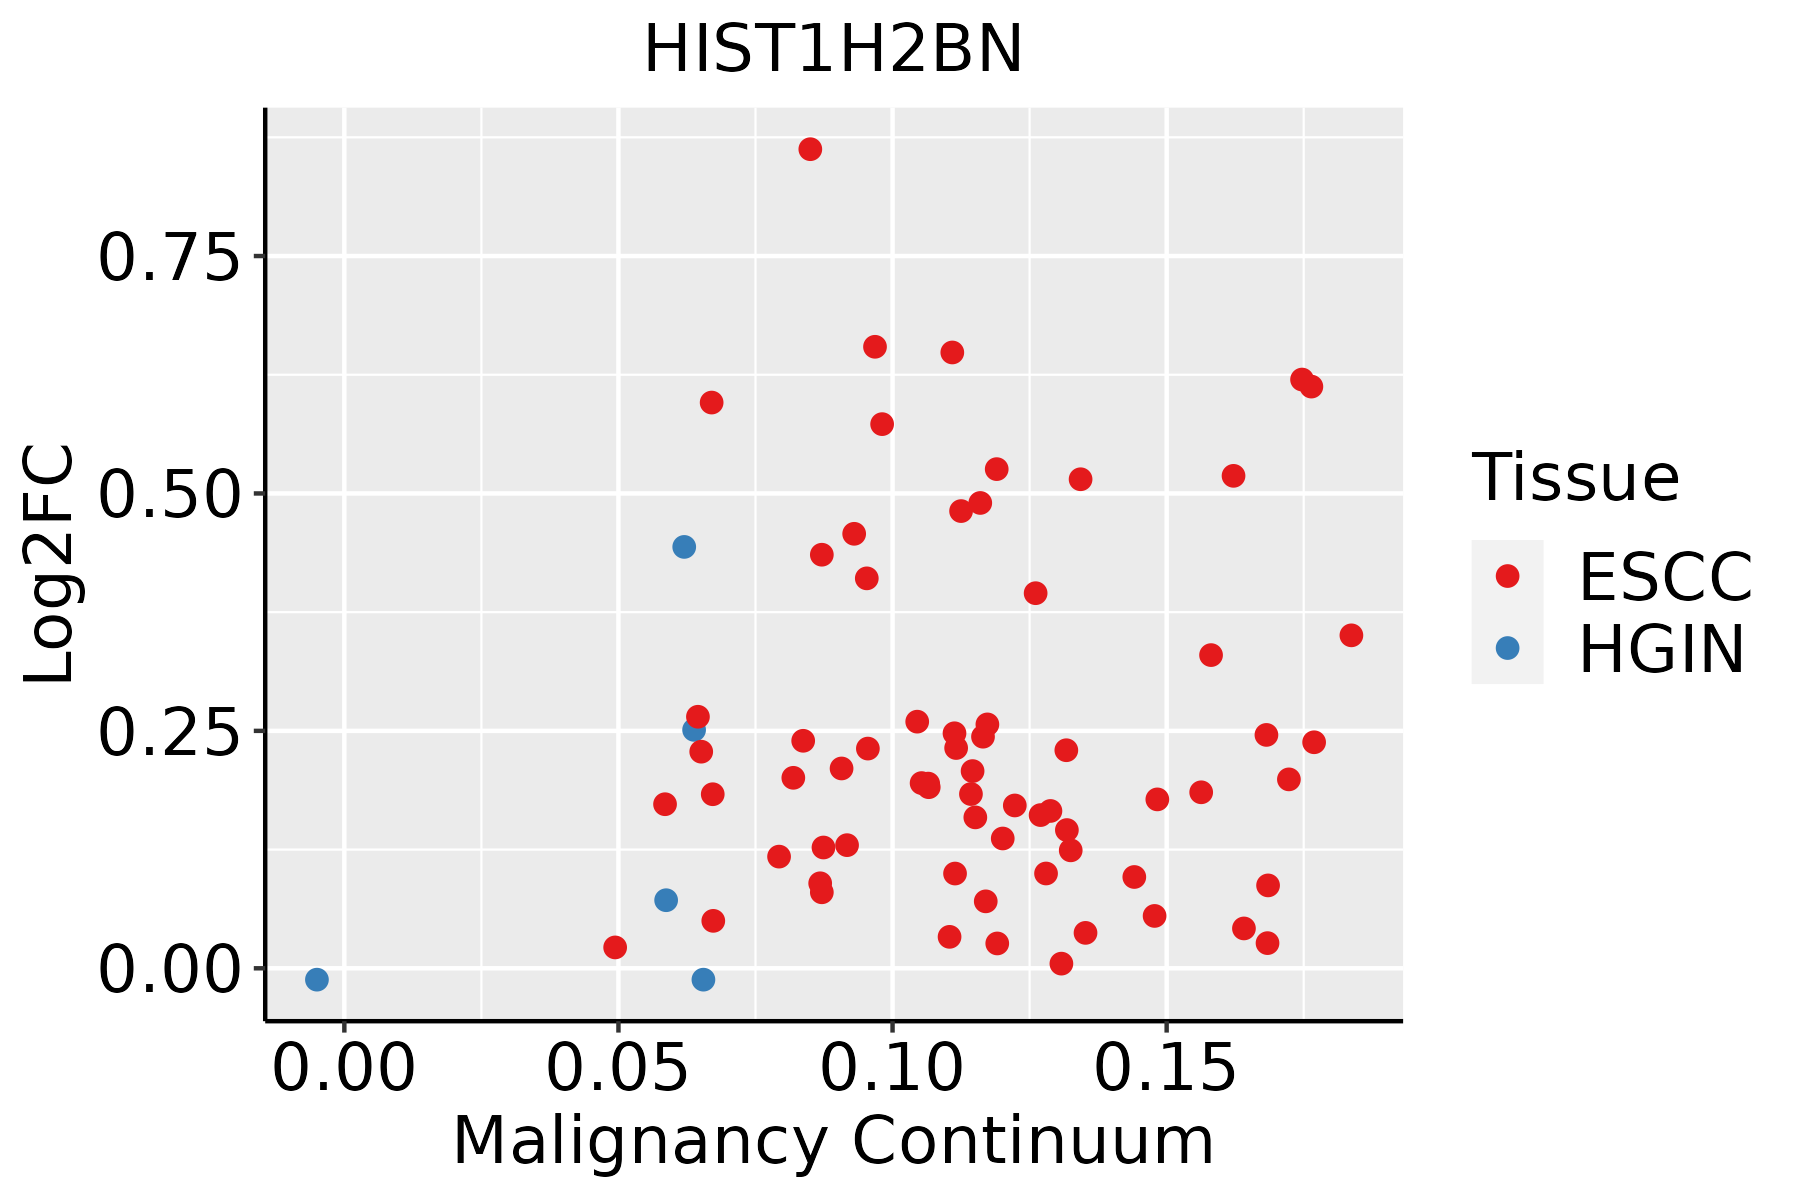 | ESCC: Esophageal squamous cell carcinoma |
| HGIN: High-grade intraepithelial neoplasias | ||
| LGIN: Low-grade intraepithelial neoplasias |
| ∗log2FC in expression of this searched gene in stem-like cells from each diseased tissue sample relative to stem-like cells in normal samples in each tissue plotted against the malignancy continuum. Samples are colored based on if they are from different disease stage. |
Top |
Malignant transformation related pathway analysis |
| Find out the enriched GO biological processes and KEGG pathways involved in transition from healthy to precancer to cancer |
| Tissue | Disease Stage | Enriched GO biological Processes |
| Colorectum | AD |  |
| Colorectum | SER |  |
| Colorectum | MSS |  |
| Colorectum | MSI-H |  |
| Colorectum | FAP |  |
| ∗Top 15 enriched GO BP terms are showed in the bar plot of each disease state in each tissue. Each row represents a significant GO biological process which is colored according to the -log10(p.adjust). |
| Page: 1 2 3 4 5 6 7 8 9 |
| GO ID | Tissue | Disease Stage | Description | Gene Ratio | Bg Ratio | pvalue | p.adjust | Count |
| Page: 1 |
| Pathway ID | Tissue | Disease Stage | Description | Gene Ratio | Bg Ratio | pvalue | p.adjust | qvalue | Count |
| Page: 1 |
Top |
Cell-cell communication analysis |
| Identification of potential cell-cell interactions between two cell types and their ligand-receptor pairs for different disease states |
| Ligand | Receptor | LRpair | Pathway | Tissue | Disease Stage |
| Page: 1 |
Top |
Single-cell gene regulatory network inference analysis |
| Find out the significant the regulons (TFs) and the target genes of each regulon across cell types for different disease states |
| TF | Cell Type | Tissue | Disease Stage | Target Gene | RSS | Regulon Activity |
| HIST1H2BN | MAIT | Liver | Healthy | SMIM3,AC127521.1,FKBP8, etc. | 9.12e-03 |  |
| ∗The dot plots of a searched regulon are shown for all cell subpopulations in each disease state of each tissue based on the regulon specific score inferred using pySCENIC and by calculating the average expression. |
| Page: 1 |
Top |
Somatic mutation of malignant transformation related genes |
| Annotation of somatic variants for genes involved in malignant transformation |
| Hugo Symbol | Variant Class | Variant Classification | dbSNP RS | HGVSc | HGVSp | HGVSp Short | SWISSPROT | BIOTYPE | SIFT | PolyPhen | Tumor Sample Barcode | Tissue | Histology | Sex | Age | Stage | Therapy Types | Drugs | Outcome |
| HIST1H2BN | SNV | Missense_Mutation | novel | c.167N>T | p.Ser56Leu | p.S56L | Q99877 | protein_coding | deleterious_low_confidence(0.04) | benign(0.028) | TCGA-C8-A12K-01 | Breast | breast invasive carcinoma | Female | >=65 | I/II | Unknown | Unknown | SD |
| HIST1H2BN | SNV | Missense_Mutation | rs765564594 | c.110N>A | p.Ser37Asn | p.S37N | Q99877 | protein_coding | deleterious_low_confidence(0.04) | benign(0.006) | TCGA-GM-A3NW-01 | Breast | breast invasive carcinoma | Female | <65 | I/II | Chemotherapy | fluorouracil | SD |
| HIST1H2BN | insertion | In_Frame_Ins | novel | c.206_207insGCCCCGCTACTTGCCCTTGGC | p.Asp69delinsGluProArgTyrLeuProLeuAla | p.D69delinsEPRYLPLA | Q99877 | protein_coding | TCGA-A2-A04V-01 | Breast | breast invasive carcinoma | Female | <65 | I/II | Chemotherapy | cytoxan | PD | ||
| HIST1H2BN | insertion | Frame_Shift_Ins | novel | c.41_42insT | p.Ser15LeufsTer55 | p.S15Lfs*55 | Q99877 | protein_coding | TCGA-A2-A0CT-01 | Breast | breast invasive carcinoma | Female | >=65 | I/II | Chemotherapy | cytoxan | SD | ||
| HIST1H2BN | insertion | In_Frame_Ins | novel | c.43_44insTGTTGTCGCGGGCCGCGTTGCCAGCCAGTT | p.Gly14_Ser15insLeuLeuSerArgAlaAlaLeuProAlaSer | p.G14_S15insLLSRAALPAS | Q99877 | protein_coding | TCGA-A2-A0CT-01 | Breast | breast invasive carcinoma | Female | >=65 | I/II | Chemotherapy | cytoxan | SD | ||
| HIST1H2BN | insertion | Frame_Shift_Ins | novel | c.281_282insCACCACCCTGGGC | p.Glu94AspfsTer101 | p.E94Dfs*101 | Q99877 | protein_coding | TCGA-A8-A07R-01 | Breast | breast invasive carcinoma | Female | >=65 | III/IV | Ancillary | zoledronic | SD | ||
| HIST1H2BN | deletion | Frame_Shift_Del | novel | c.79delN | p.Gly27AlafsTer20 | p.G27Afs*20 | Q99877 | protein_coding | TCGA-D8-A27V-01 | Breast | breast invasive carcinoma | Female | <65 | I/II | Hormone Therapy | tamoxiphen | SD | ||
| HIST1H2BN | SNV | Missense_Mutation | novel | c.140N>C | p.Lys47Thr | p.K47T | Q99877 | protein_coding | deleterious_low_confidence(0) | possibly_damaging(0.836) | TCGA-AA-A02J-01 | Colorectum | colon adenocarcinoma | Female | >=65 | III/IV | Unknown | Unknown | PD |
| HIST1H2BN | SNV | Missense_Mutation | novel | c.182N>A | p.Gly61Asp | p.G61D | Q99877 | protein_coding | deleterious_low_confidence(0.02) | benign(0.036) | TCGA-A5-A0G2-01 | Endometrium | uterine corpus endometrioid carcinoma | Female | <65 | III/IV | Unknown | Unknown | SD |
| HIST1H2BN | SNV | Missense_Mutation | c.378N>T | p.Lys126Asn | p.K126N | Q99877 | protein_coding | deleterious_low_confidence(0) | possibly_damaging(0.476) | TCGA-A5-A0G2-01 | Endometrium | uterine corpus endometrioid carcinoma | Female | <65 | III/IV | Unknown | Unknown | SD |
| Page: 1 2 3 |
Top |
Related drugs of malignant transformation related genes |
| Identification of chemicals and drugs interact with genes involved in malignant transfromation |
| (DGIdb 4.0) |
| Entrez ID | Symbol | Category | Interaction Types | Drug Claim Name | Drug Name | PMIDs |
| Page: 1 |

Copyright 2023-Present -The University of Texas Health Science Center at Houston |