
|
|||||
|
 | |
| |
| |
| |
| |
| |
|
Gene: HIST1H2BK |
Gene summary for HIST1H2BK |
| Gene information | Species | Human | Gene symbol | HIST1H2BK | Gene ID | 85236 |
| Gene name | H2B clustered histone 12 | |
| Gene Alias | H2B/S | |
| Cytomap | 6p22.1 | |
| Gene Type | protein-coding | GO ID | GO:0001906 | UniProtAcc | A0A024RCL8 |
Top |
Malignant transformation analysis |
| Identification of the aberrant gene expression in precancerous and cancerous lesions by comparing the gene expression of stem-like cells in diseased tissues with normal stem cells |
| Entrez ID | Symbol | Replicates | Species | Organ | Tissue | Adj P-value | Log2FC | Malignancy |
| 85236 | HIST1H2BK | LZE4T | Human | Esophagus | ESCC | 2.94e-17 | 6.02e-01 | 0.0811 |
| 85236 | HIST1H2BK | LZE5T | Human | Esophagus | ESCC | 7.39e-11 | 6.46e-01 | 0.0514 |
| 85236 | HIST1H2BK | LZE7T | Human | Esophagus | ESCC | 2.04e-08 | 3.93e-01 | 0.0667 |
| 85236 | HIST1H2BK | LZE8T | Human | Esophagus | ESCC | 1.54e-08 | 3.90e-01 | 0.067 |
| 85236 | HIST1H2BK | LZE20T | Human | Esophagus | ESCC | 3.39e-29 | 8.78e-01 | 0.0662 |
| 85236 | HIST1H2BK | LZE22D1 | Human | Esophagus | HGIN | 1.48e-06 | 4.52e-01 | 0.0595 |
| 85236 | HIST1H2BK | LZE22T | Human | Esophagus | ESCC | 3.25e-16 | 1.47e+00 | 0.068 |
| 85236 | HIST1H2BK | LZE24T | Human | Esophagus | ESCC | 5.49e-35 | 9.94e-01 | 0.0596 |
| 85236 | HIST1H2BK | LZE21T | Human | Esophagus | ESCC | 6.45e-13 | 9.94e-01 | 0.0655 |
| 85236 | HIST1H2BK | LZE6T | Human | Esophagus | ESCC | 1.50e-05 | 5.23e-01 | 0.0845 |
| 85236 | HIST1H2BK | P1T-E | Human | Esophagus | ESCC | 8.36e-28 | 1.62e+00 | 0.0875 |
| 85236 | HIST1H2BK | P2T-E | Human | Esophagus | ESCC | 9.24e-88 | 1.49e+00 | 0.1177 |
| 85236 | HIST1H2BK | P4T-E | Human | Esophagus | ESCC | 3.57e-38 | 8.14e-01 | 0.1323 |
| 85236 | HIST1H2BK | P5T-E | Human | Esophagus | ESCC | 4.12e-11 | 2.43e-01 | 0.1327 |
| 85236 | HIST1H2BK | P8T-E | Human | Esophagus | ESCC | 6.46e-60 | 1.17e+00 | 0.0889 |
| 85236 | HIST1H2BK | P9T-E | Human | Esophagus | ESCC | 8.43e-46 | 1.20e+00 | 0.1131 |
| 85236 | HIST1H2BK | P10T-E | Human | Esophagus | ESCC | 1.93e-61 | 1.08e+00 | 0.116 |
| 85236 | HIST1H2BK | P11T-E | Human | Esophagus | ESCC | 2.32e-21 | 1.13e+00 | 0.1426 |
| 85236 | HIST1H2BK | P12T-E | Human | Esophagus | ESCC | 4.09e-46 | 9.31e-01 | 0.1122 |
| 85236 | HIST1H2BK | P15T-E | Human | Esophagus | ESCC | 8.36e-57 | 1.35e+00 | 0.1149 |
| Page: 1 2 3 4 5 |
| Tissue | Expression Dynamics | Abbreviation |
| Esophagus | 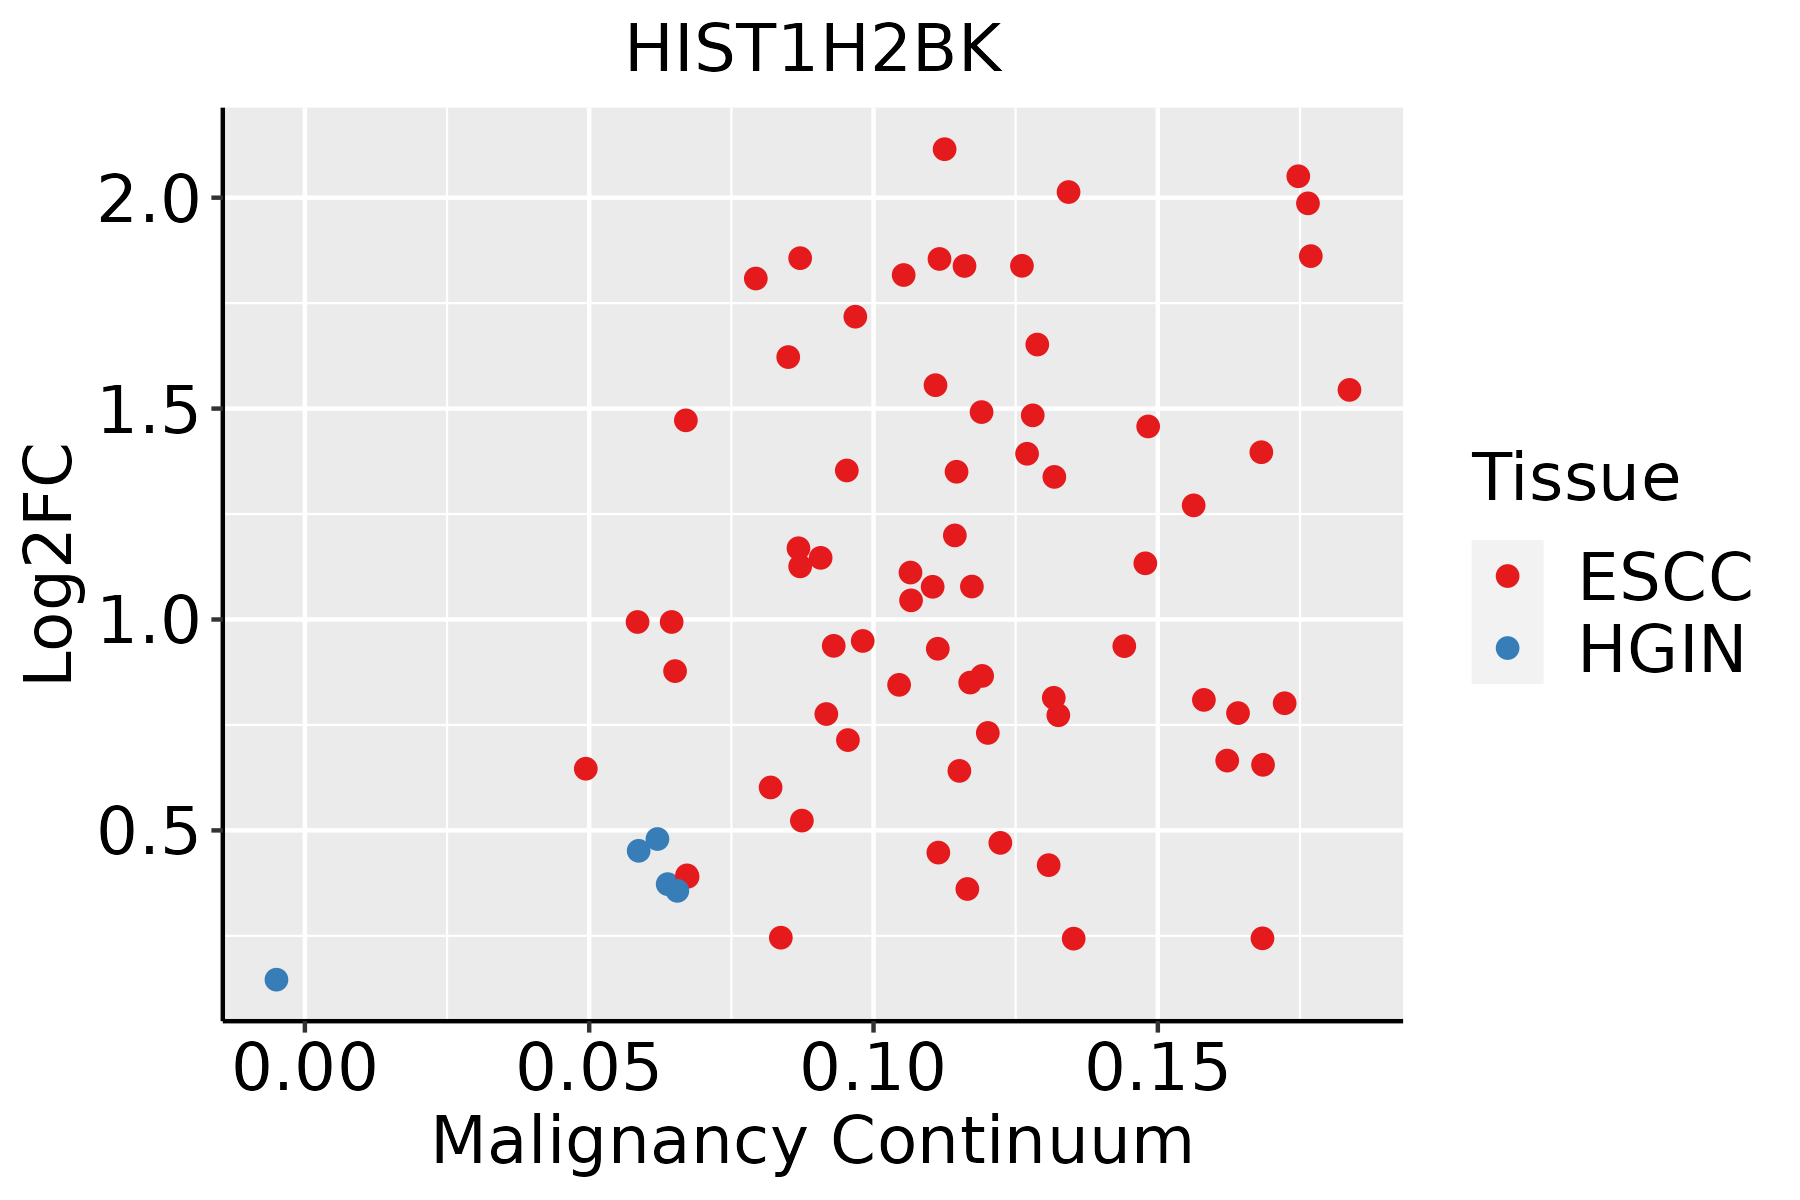 | ESCC: Esophageal squamous cell carcinoma |
| HGIN: High-grade intraepithelial neoplasias | ||
| LGIN: Low-grade intraepithelial neoplasias | ||
| GC |  | CAG: Chronic atrophic gastritis |
| CAG with IM: Chronic atrophic gastritis with intestinal metaplasia | ||
| CSG: Chronic superficial gastritis | ||
| GC: Gastric cancer | ||
| SIM: Severe intestinal metaplasia | ||
| WIM: Wild intestinal metaplasia | ||
| Liver | 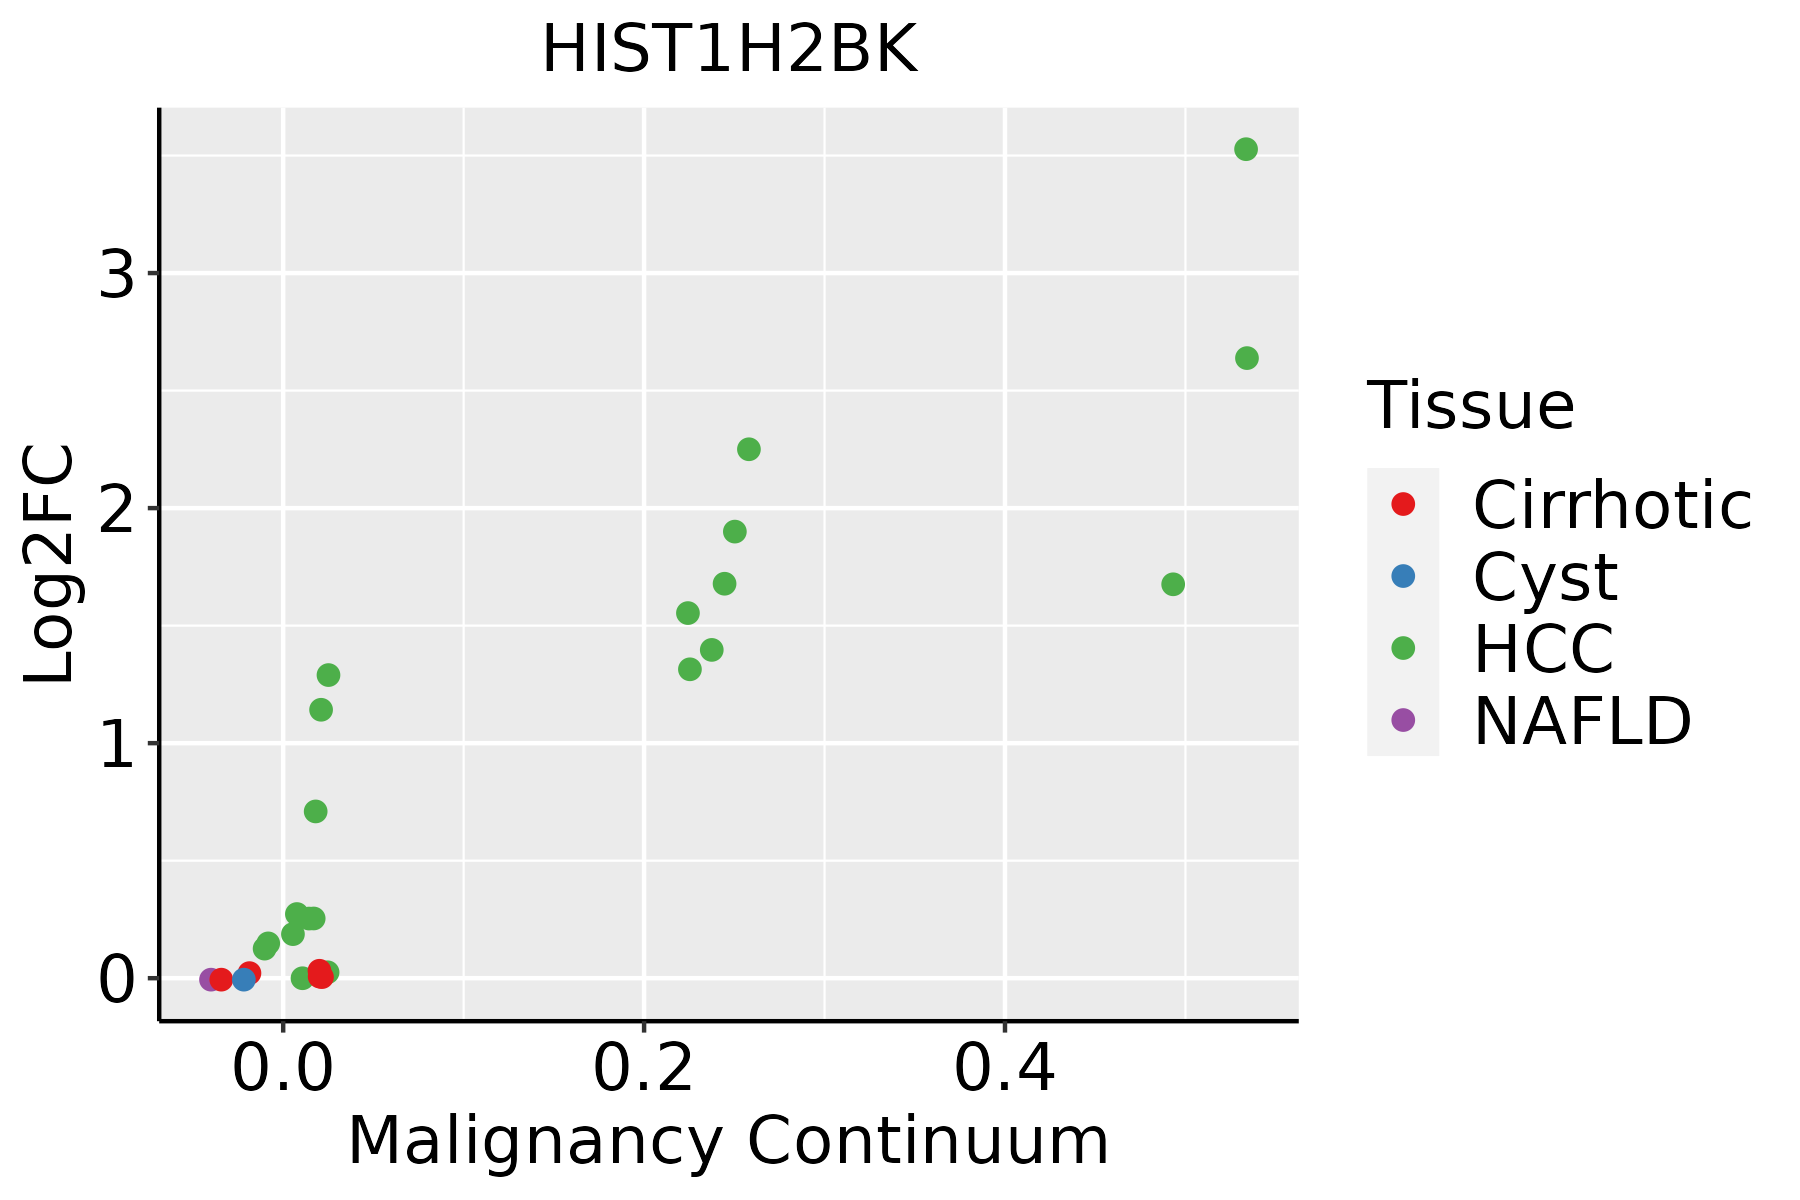 | HCC: Hepatocellular carcinoma |
| NAFLD: Non-alcoholic fatty liver disease | ||
| Skin | 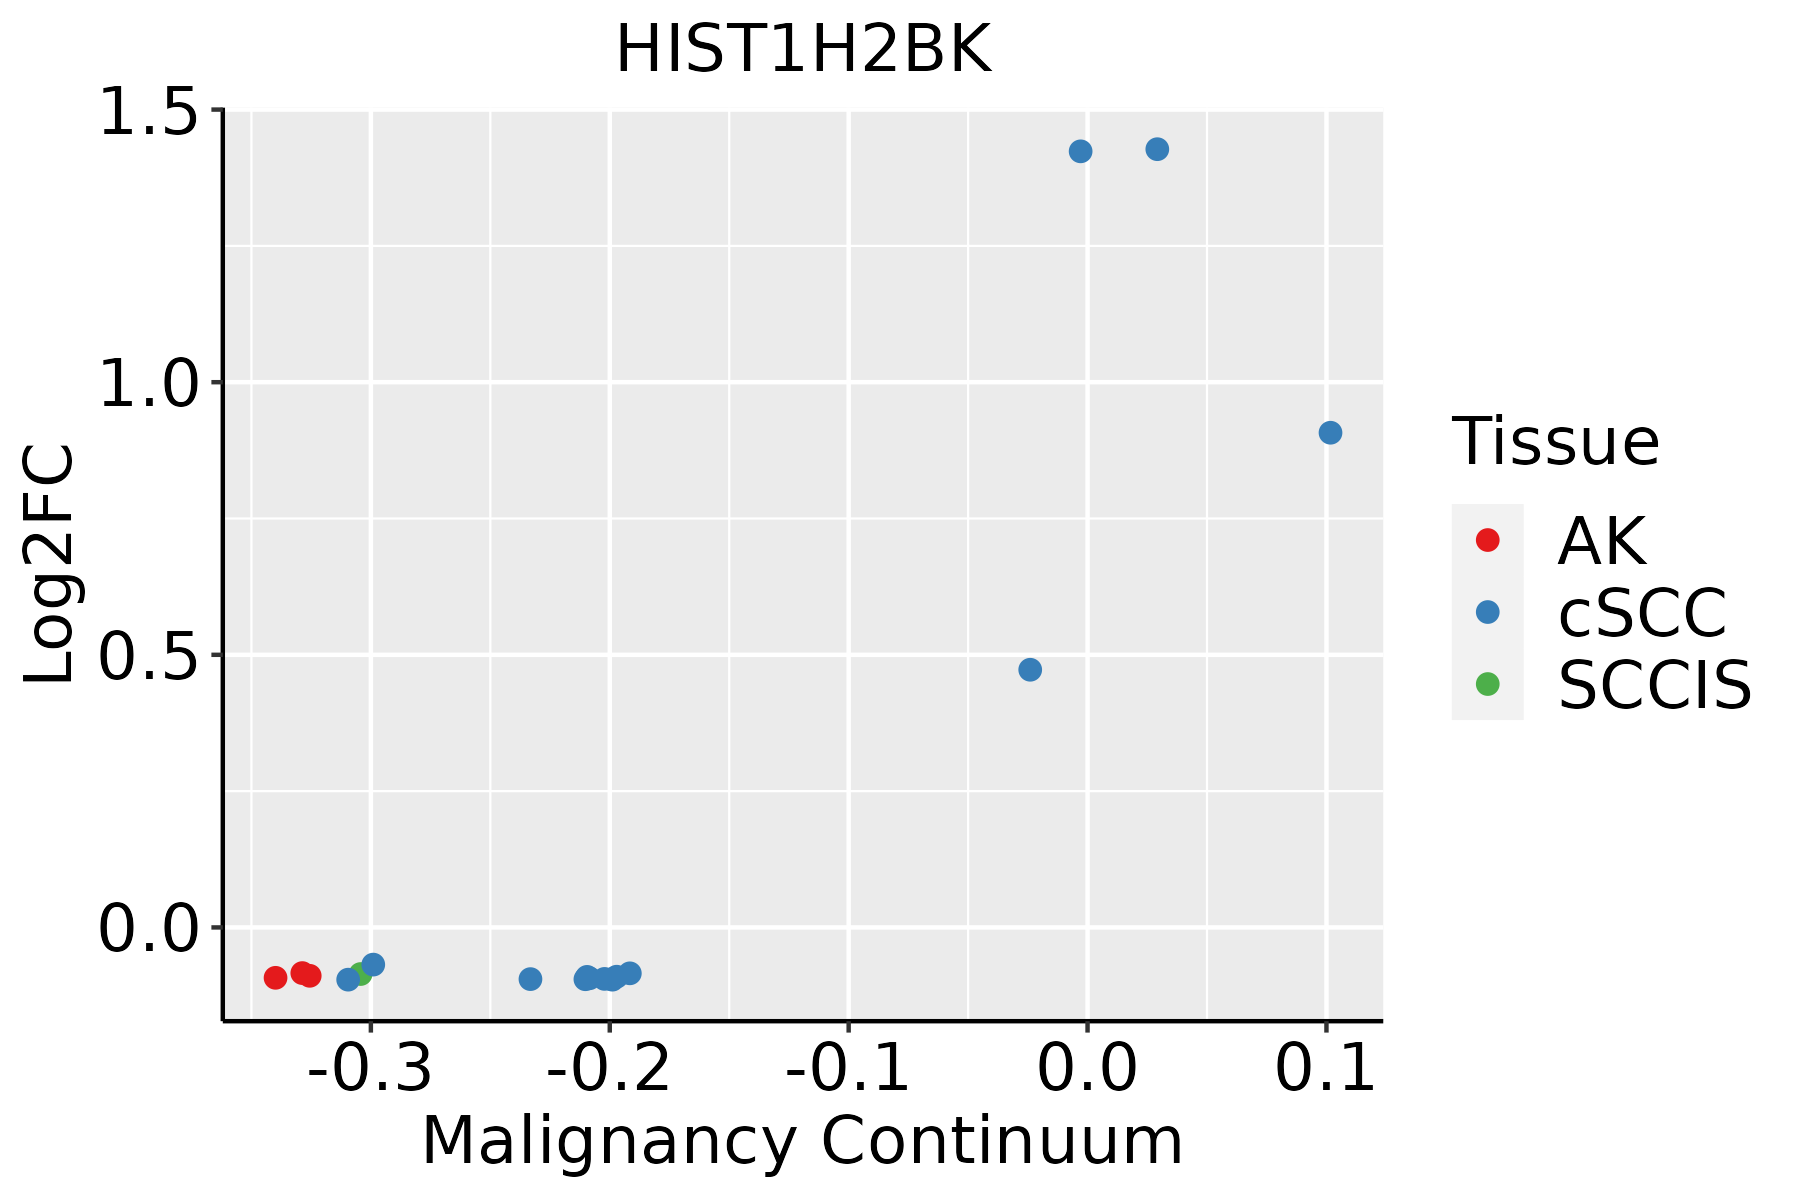 | AK: Actinic keratosis |
| cSCC: Cutaneous squamous cell carcinoma | ||
| SCCIS:squamous cell carcinoma in situ |
| ∗log2FC in expression of this searched gene in stem-like cells from each diseased tissue sample relative to stem-like cells in normal samples in each tissue plotted against the malignancy continuum. Samples are colored based on if they are from different disease stage. |
Top |
Malignant transformation related pathway analysis |
| Find out the enriched GO biological processes and KEGG pathways involved in transition from healthy to precancer to cancer |
| Tissue | Disease Stage | Enriched GO biological Processes |
| Colorectum | AD |  |
| Colorectum | SER |  |
| Colorectum | MSS |  |
| Colorectum | MSI-H |  |
| Colorectum | FAP |  |
| ∗Top 15 enriched GO BP terms are showed in the bar plot of each disease state in each tissue. Each row represents a significant GO biological process which is colored according to the -log10(p.adjust). |
| Page: 1 2 3 4 5 6 7 8 9 |
| GO ID | Tissue | Disease Stage | Description | Gene Ratio | Bg Ratio | pvalue | p.adjust | Count |
| Page: 1 |
| Pathway ID | Tissue | Disease Stage | Description | Gene Ratio | Bg Ratio | pvalue | p.adjust | qvalue | Count |
| Page: 1 |
Top |
Cell-cell communication analysis |
| Identification of potential cell-cell interactions between two cell types and their ligand-receptor pairs for different disease states |
| Ligand | Receptor | LRpair | Pathway | Tissue | Disease Stage |
| Page: 1 |
Top |
Single-cell gene regulatory network inference analysis |
| Find out the significant the regulons (TFs) and the target genes of each regulon across cell types for different disease states |
| TF | Cell Type | Tissue | Disease Stage | Target Gene | RSS | Regulon Activity |
| ∗The dot plots of a searched regulon are shown for all cell subpopulations in each disease state of each tissue based on the regulon specific score inferred using pySCENIC and by calculating the average expression. |
| Page: 1 |
Top |
Somatic mutation of malignant transformation related genes |
| Annotation of somatic variants for genes involved in malignant transformation |
| Hugo Symbol | Variant Class | Variant Classification | dbSNP RS | HGVSc | HGVSp | HGVSp Short | SWISSPROT | BIOTYPE | SIFT | PolyPhen | Tumor Sample Barcode | Tissue | Histology | Sex | Age | Stage | Therapy Types | Drugs | Outcome |
| HIST1H2BK | SNV | Missense_Mutation | rs759189956 | c.118N>A | p.Val40Ile | p.V40I | O60814 | protein_coding | tolerated_low_confidence(1) | benign(0.024) | TCGA-A1-A0SP-01 | Breast | breast invasive carcinoma | Female | <65 | I/II | Chemotherapy | SD | |
| HIST1H2BK | SNV | Missense_Mutation | c.244N>A | p.Ala82Thr | p.A82T | O60814 | protein_coding | deleterious_low_confidence(0.02) | probably_damaging(0.946) | TCGA-A2-A0T1-01 | Breast | breast invasive carcinoma | Female | <65 | III/IV | Targeted Molecular therapy | herceptin | SD | |
| HIST1H2BK | SNV | Missense_Mutation | c.7G>A | p.Glu3Lys | p.E3K | O60814 | protein_coding | deleterious_low_confidence(0.03) | benign(0.04) | TCGA-EW-A1PB-01 | Breast | breast invasive carcinoma | Female | >=65 | III/IV | Unknown | Unknown | SD | |
| HIST1H2BK | SNV | Missense_Mutation | novel | c.335T>C | p.Val112Ala | p.V112A | O60814 | protein_coding | deleterious_low_confidence(0.01) | benign(0.208) | TCGA-2W-A8YY-01 | Cervix | cervical & endocervical cancer | Female | <65 | I/II | Chemotherapy | cisplatin | CR |
| HIST1H2BK | SNV | Missense_Mutation | novel | c.213C>G | p.Phe71Leu | p.F71L | O60814 | protein_coding | deleterious_low_confidence(0.02) | possibly_damaging(0.836) | TCGA-C5-A1BL-01 | Cervix | cervical & endocervical cancer | Female | <65 | I/II | Unknown | Unknown | SD |
| HIST1H2BK | SNV | Missense_Mutation | c.218N>A | p.Arg73His | p.R73H | O60814 | protein_coding | tolerated_low_confidence(0.08) | benign(0.067) | TCGA-AA-3811-01 | Colorectum | colon adenocarcinoma | Female | >=65 | III/IV | Unknown | Unknown | PD | |
| HIST1H2BK | SNV | Missense_Mutation | c.342N>C | p.Glu114Asp | p.E114D | O60814 | protein_coding | deleterious_low_confidence(0) | benign(0.029) | TCGA-QL-A97D-01 | Colorectum | colon adenocarcinoma | Female | >=65 | I/II | Unknown | Unknown | SD | |
| HIST1H2BK | SNV | Missense_Mutation | novel | c.167N>A | p.Ser56Tyr | p.S56Y | O60814 | protein_coding | deleterious_low_confidence(0) | probably_damaging(0.977) | TCGA-A5-A0G1-01 | Endometrium | uterine corpus endometrioid carcinoma | Female | >=65 | I/II | Unknown | Unknown | SD |
| HIST1H2BK | SNV | Missense_Mutation | rs759189956 | c.118N>A | p.Val40Ile | p.V40I | O60814 | protein_coding | tolerated_low_confidence(1) | benign(0.024) | TCGA-A5-A2K5-01 | Endometrium | uterine corpus endometrioid carcinoma | Female | >=65 | I/II | Unknown | Unknown | SD |
| HIST1H2BK | SNV | Missense_Mutation | rs775162461 | c.94C>T | p.Arg32Cys | p.R32C | O60814 | protein_coding | tolerated_low_confidence(0.12) | benign(0.059) | TCGA-AP-A1DV-01 | Endometrium | uterine corpus endometrioid carcinoma | Female | <65 | I/II | Unknown | Unknown | SD |
| Page: 1 2 3 |
Top |
Related drugs of malignant transformation related genes |
| Identification of chemicals and drugs interact with genes involved in malignant transfromation |
| (DGIdb 4.0) |
| Entrez ID | Symbol | Category | Interaction Types | Drug Claim Name | Drug Name | PMIDs |
| Page: 1 |

Copyright 2023-Present -The University of Texas Health Science Center at Houston |