
|
|||||
|
 | |
| |
| |
| |
| |
| |
|
Gene: HIST1H2BF |
Gene summary for HIST1H2BF |
| Gene information | Species | Human | Gene symbol | HIST1H2BF | Gene ID | 8343 |
| Gene name | H2B clustered histone 7 | |
| Gene Alias | H2B/g | |
| Cytomap | 6p22.2 | |
| Gene Type | protein-coding | GO ID | GO:0002227 | UniProtAcc | B2R4S9 |
Top |
Malignant transformation analysis |
| Identification of the aberrant gene expression in precancerous and cancerous lesions by comparing the gene expression of stem-like cells in diseased tissues with normal stem cells |
| Entrez ID | Symbol | Replicates | Species | Organ | Tissue | Adj P-value | Log2FC | Malignancy |
| 8343 | HIST1H2BF | LZE20T | Human | Esophagus | ESCC | 1.26e-02 | 1.19e-01 | 0.0662 |
| 8343 | HIST1H2BF | LZE21D1 | Human | Esophagus | HGIN | 4.41e-04 | 2.63e-01 | 0.0632 |
| 8343 | HIST1H2BF | LZE24T | Human | Esophagus | ESCC | 1.46e-02 | 1.21e-01 | 0.0596 |
| 8343 | HIST1H2BF | LZE21T | Human | Esophagus | ESCC | 6.52e-03 | 2.54e-01 | 0.0655 |
| 8343 | HIST1H2BF | P1T-E | Human | Esophagus | ESCC | 3.50e-13 | 6.97e-01 | 0.0875 |
| 8343 | HIST1H2BF | P2T-E | Human | Esophagus | ESCC | 9.53e-09 | 2.46e-01 | 0.1177 |
| 8343 | HIST1H2BF | P4T-E | Human | Esophagus | ESCC | 2.90e-03 | 1.29e-01 | 0.1323 |
| 8343 | HIST1H2BF | P10T-E | Human | Esophagus | ESCC | 9.02e-11 | 2.75e-01 | 0.116 |
| 8343 | HIST1H2BF | P12T-E | Human | Esophagus | ESCC | 3.60e-13 | 3.01e-01 | 0.1122 |
| 8343 | HIST1H2BF | P16T-E | Human | Esophagus | ESCC | 4.41e-07 | 1.34e-01 | 0.1153 |
| 8343 | HIST1H2BF | P20T-E | Human | Esophagus | ESCC | 1.16e-15 | 5.08e-01 | 0.1124 |
| 8343 | HIST1H2BF | P22T-E | Human | Esophagus | ESCC | 9.44e-07 | 1.86e-01 | 0.1236 |
| 8343 | HIST1H2BF | P23T-E | Human | Esophagus | ESCC | 2.89e-02 | 2.42e-01 | 0.108 |
| 8343 | HIST1H2BF | P24T-E | Human | Esophagus | ESCC | 4.17e-05 | 1.59e-01 | 0.1287 |
| 8343 | HIST1H2BF | P26T-E | Human | Esophagus | ESCC | 2.02e-06 | 1.61e-01 | 0.1276 |
| 8343 | HIST1H2BF | P27T-E | Human | Esophagus | ESCC | 7.90e-03 | 1.51e-01 | 0.1055 |
| 8343 | HIST1H2BF | P36T-E | Human | Esophagus | ESCC | 7.72e-03 | 1.59e-01 | 0.1187 |
| 8343 | HIST1H2BF | P39T-E | Human | Esophagus | ESCC | 3.75e-03 | 1.11e-01 | 0.0894 |
| 8343 | HIST1H2BF | P42T-E | Human | Esophagus | ESCC | 3.05e-02 | 1.26e-01 | 0.1175 |
| 8343 | HIST1H2BF | P48T-E | Human | Esophagus | ESCC | 3.50e-02 | 8.48e-02 | 0.0959 |
| Page: 1 2 |
| Tissue | Expression Dynamics | Abbreviation |
| Esophagus | 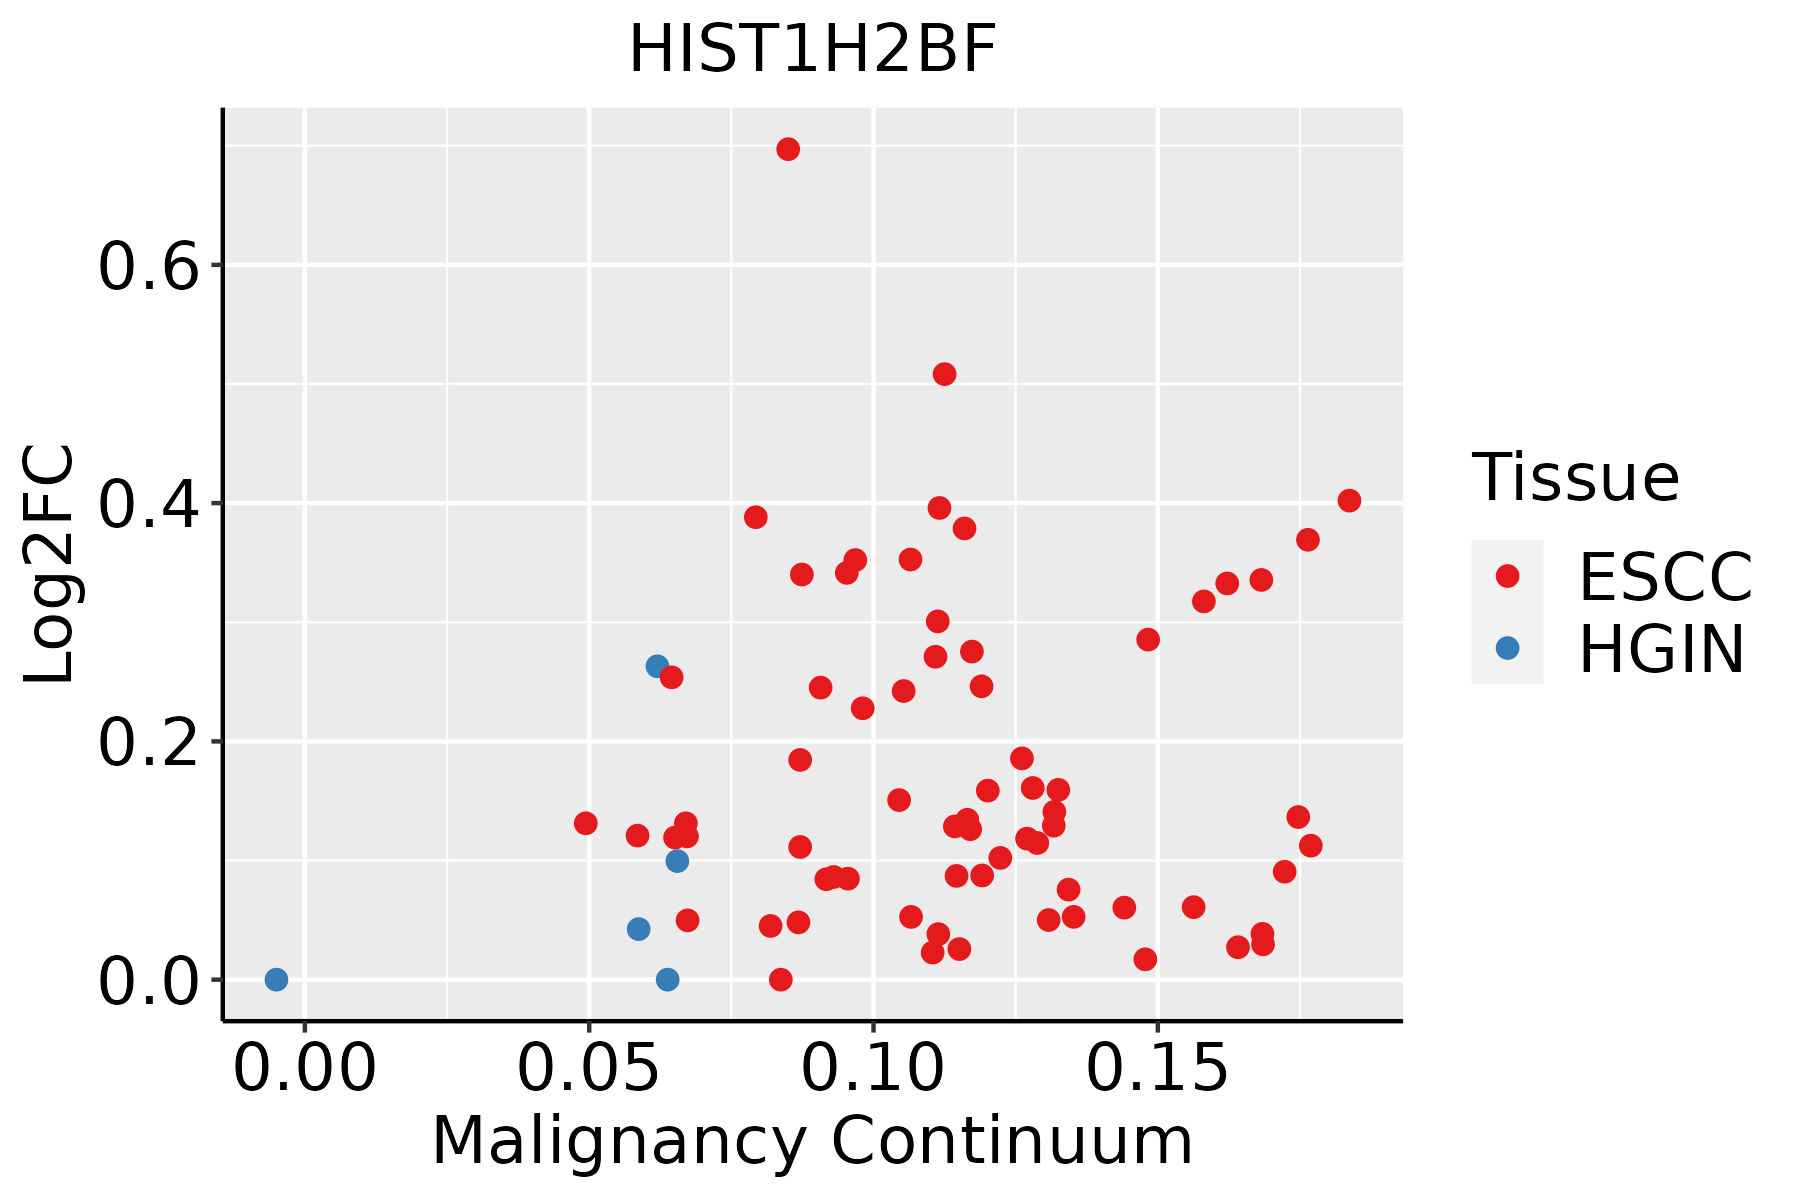 | ESCC: Esophageal squamous cell carcinoma |
| HGIN: High-grade intraepithelial neoplasias | ||
| LGIN: Low-grade intraepithelial neoplasias |
| ∗log2FC in expression of this searched gene in stem-like cells from each diseased tissue sample relative to stem-like cells in normal samples in each tissue plotted against the malignancy continuum. Samples are colored based on if they are from different disease stage. |
Top |
Malignant transformation related pathway analysis |
| Find out the enriched GO biological processes and KEGG pathways involved in transition from healthy to precancer to cancer |
| Tissue | Disease Stage | Enriched GO biological Processes |
| Colorectum | AD |  |
| Colorectum | SER |  |
| Colorectum | MSS |  |
| Colorectum | MSI-H |  |
| Colorectum | FAP |  |
| ∗Top 15 enriched GO BP terms are showed in the bar plot of each disease state in each tissue. Each row represents a significant GO biological process which is colored according to the -log10(p.adjust). |
| Page: 1 2 3 4 5 6 7 8 9 |
| GO ID | Tissue | Disease Stage | Description | Gene Ratio | Bg Ratio | pvalue | p.adjust | Count |
| Page: 1 |
| Pathway ID | Tissue | Disease Stage | Description | Gene Ratio | Bg Ratio | pvalue | p.adjust | qvalue | Count |
| Page: 1 |
Top |
Cell-cell communication analysis |
| Identification of potential cell-cell interactions between two cell types and their ligand-receptor pairs for different disease states |
| Ligand | Receptor | LRpair | Pathway | Tissue | Disease Stage |
| Page: 1 |
Top |
Single-cell gene regulatory network inference analysis |
| Find out the significant the regulons (TFs) and the target genes of each regulon across cell types for different disease states |
| TF | Cell Type | Tissue | Disease Stage | Target Gene | RSS | Regulon Activity |
| ∗The dot plots of a searched regulon are shown for all cell subpopulations in each disease state of each tissue based on the regulon specific score inferred using pySCENIC and by calculating the average expression. |
| Page: 1 |
Top |
Somatic mutation of malignant transformation related genes |
| Annotation of somatic variants for genes involved in malignant transformation |
| Hugo Symbol | Variant Class | Variant Classification | dbSNP RS | HGVSc | HGVSp | HGVSp Short | SWISSPROT | BIOTYPE | SIFT | PolyPhen | Tumor Sample Barcode | Tissue | Histology | Sex | Age | Stage | Therapy Types | Drugs | Outcome |
| HIST1H2BF | SNV | Missense_Mutation | c.229N>A | p.Glu77Lys | p.E77K | P62807 | protein_coding | deleterious_low_confidence(0.04) | possibly_damaging(0.812) | TCGA-A2-A0EY-01 | Breast | breast invasive carcinoma | Female | <65 | I/II | Chemotherapy | adriamycin | SD | |
| HIST1H2BF | insertion | Frame_Shift_Ins | novel | c.250_251insCAGCCTGGATGTTGGGCAGA | p.Tyr84SerfsTer72 | p.Y84Sfs*72 | P62807 | protein_coding | TCGA-B6-A0IN-01 | Breast | breast invasive carcinoma | Female | <65 | I/II | Unknown | Unknown | PD | ||
| HIST1H2BF | SNV | Missense_Mutation | c.7N>A | p.Glu3Lys | p.E3K | P62807 | protein_coding | deleterious_low_confidence(0.03) | benign(0.014) | TCGA-IR-A3LL-01 | Cervix | cervical & endocervical cancer | Female | <65 | I/II | Chemotherapy | cisplatin | CR | |
| HIST1H2BF | SNV | Missense_Mutation | c.229N>C | p.Glu77Gln | p.E77Q | P62807 | protein_coding | deleterious_low_confidence(0) | probably_damaging(0.975) | TCGA-MA-AA42-01 | Cervix | cervical & endocervical cancer | Female | >=65 | I/II | Unknown | Unknown | SD | |
| HIST1H2BF | deletion | Frame_Shift_Del | novel | c.378_381delGTAA | p.Lys126AsnfsTer22 | p.K126Nfs*22 | P62807 | protein_coding | TCGA-EA-A410-01 | Cervix | cervical & endocervical cancer | Female | <65 | I/II | Unknown | Unknown | SD | ||
| HIST1H2BF | SNV | Missense_Mutation | c.104N>G | p.Lys35Arg | p.K35R | P62807 | protein_coding | tolerated_low_confidence(0.09) | benign(0.007) | TCGA-AA-3715-01 | Colorectum | colon adenocarcinoma | Male | >=65 | I/II | Unknown | Unknown | PD | |
| HIST1H2BF | SNV | Missense_Mutation | novel | c.44N>G | p.Ser15Cys | p.S15C | P62807 | protein_coding | deleterious_low_confidence(0.03) | possibly_damaging(0.728) | TCGA-AG-A00Y-01 | Colorectum | rectum adenocarcinoma | Male | >=65 | I/II | Unknown | Unknown | PD |
| HIST1H2BF | deletion | Frame_Shift_Del | c.33delN | p.Lys13ArgfsTer7 | p.K13Rfs*7 | P62807 | protein_coding | TCGA-AA-3672-01 | Colorectum | colon adenocarcinoma | Female | >=65 | III/IV | Unknown | Unknown | SD | |||
| HIST1H2BF | SNV | Missense_Mutation | novel | c.29N>T | p.Ala10Val | p.A10V | P62807 | protein_coding | tolerated_low_confidence(0.15) | benign(0) | TCGA-AP-A1DK-01 | Endometrium | uterine corpus endometrioid carcinoma | Female | <65 | I/II | Unknown | Unknown | SD |
| HIST1H2BF | SNV | Missense_Mutation | c.143N>G | p.Gln48Arg | p.Q48R | P62807 | protein_coding | deleterious_low_confidence(0.03) | benign(0.078) | TCGA-AP-A1DK-01 | Endometrium | uterine corpus endometrioid carcinoma | Female | <65 | I/II | Unknown | Unknown | SD |
| Page: 1 2 3 4 |
Top |
Related drugs of malignant transformation related genes |
| Identification of chemicals and drugs interact with genes involved in malignant transfromation |
| (DGIdb 4.0) |
| Entrez ID | Symbol | Category | Interaction Types | Drug Claim Name | Drug Name | PMIDs |
| Page: 1 |

Copyright 2023-Present -The University of Texas Health Science Center at Houston |