
|
|||||
|
 | |
| |
| |
| |
| |
| |
|
Gene: HIST1H2BD |
Gene summary for HIST1H2BD |
| Gene information | Species | Human | Gene symbol | HIST1H2BD | Gene ID | 3017 |
| Gene name | H2B clustered histone 5 | |
| Gene Alias | H2B.1B | |
| Cytomap | 6p22.2 | |
| Gene Type | protein-coding | GO ID | GO:0006323 | UniProtAcc | A0A024QZZ7 |
Top |
Malignant transformation analysis |
| Identification of the aberrant gene expression in precancerous and cancerous lesions by comparing the gene expression of stem-like cells in diseased tissues with normal stem cells |
| Entrez ID | Symbol | Replicates | Species | Organ | Tissue | Adj P-value | Log2FC | Malignancy |
| 3017 | HIST1H2BD | CCI_2 | Human | Cervix | CC | 2.31e-23 | 1.30e+00 | 0.5249 |
| 3017 | HIST1H2BD | CCI_3 | Human | Cervix | CC | 2.36e-07 | 3.25e-01 | 0.516 |
| 3017 | HIST1H2BD | Tumor | Human | Cervix | CC | 9.07e-08 | 1.66e-01 | 0.1241 |
| 3017 | HIST1H2BD | sample1 | Human | Cervix | CC | 1.17e-02 | 1.58e-01 | 0.0959 |
| 3017 | HIST1H2BD | sample3 | Human | Cervix | CC | 9.07e-08 | 1.70e-01 | 0.1387 |
| 3017 | HIST1H2BD | H2 | Human | Cervix | HSIL_HPV | 4.15e-09 | 1.98e-01 | 0.0632 |
| 3017 | HIST1H2BD | T1 | Human | Cervix | CC | 6.85e-08 | 2.45e-01 | 0.0918 |
| 3017 | HIST1H2BD | T3 | Human | Cervix | CC | 3.83e-04 | 1.47e-01 | 0.1389 |
| 3017 | HIST1H2BD | HCC1_Meng | Human | Liver | HCC | 4.69e-43 | 8.30e-02 | 0.0246 |
| 3017 | HIST1H2BD | cirrhotic2 | Human | Liver | Cirrhotic | 2.36e-02 | 7.49e-02 | 0.0201 |
| 3017 | HIST1H2BD | HCC1 | Human | Liver | HCC | 1.01e-07 | 3.67e+00 | 0.5336 |
| 3017 | HIST1H2BD | Pt14.b | Human | Liver | HCC | 9.06e-06 | 3.11e-01 | 0.018 |
| 3017 | HIST1H2BD | S014 | Human | Liver | HCC | 1.13e-08 | 4.42e-01 | 0.2254 |
| 3017 | HIST1H2BD | S015 | Human | Liver | HCC | 3.24e-03 | 2.62e-01 | 0.2375 |
| 3017 | HIST1H2BD | S016 | Human | Liver | HCC | 1.21e-13 | 4.45e-01 | 0.2243 |
| 3017 | HIST1H2BD | S027 | Human | Liver | HCC | 1.28e-06 | 7.58e-01 | 0.2446 |
| 3017 | HIST1H2BD | S028 | Human | Liver | HCC | 5.38e-20 | 8.48e-01 | 0.2503 |
| 3017 | HIST1H2BD | S029 | Human | Liver | HCC | 3.92e-12 | 7.70e-01 | 0.2581 |
| 3017 | HIST1H2BD | RNA-P17T-P17T-2 | Human | Lung | IAC | 3.47e-03 | 7.96e-01 | 0.3371 |
| 3017 | HIST1H2BD | RNA-P17T-P17T-4 | Human | Lung | IAC | 2.10e-03 | 7.98e-01 | 0.343 |
| Page: 1 2 |
| Tissue | Expression Dynamics | Abbreviation |
| Cervix | 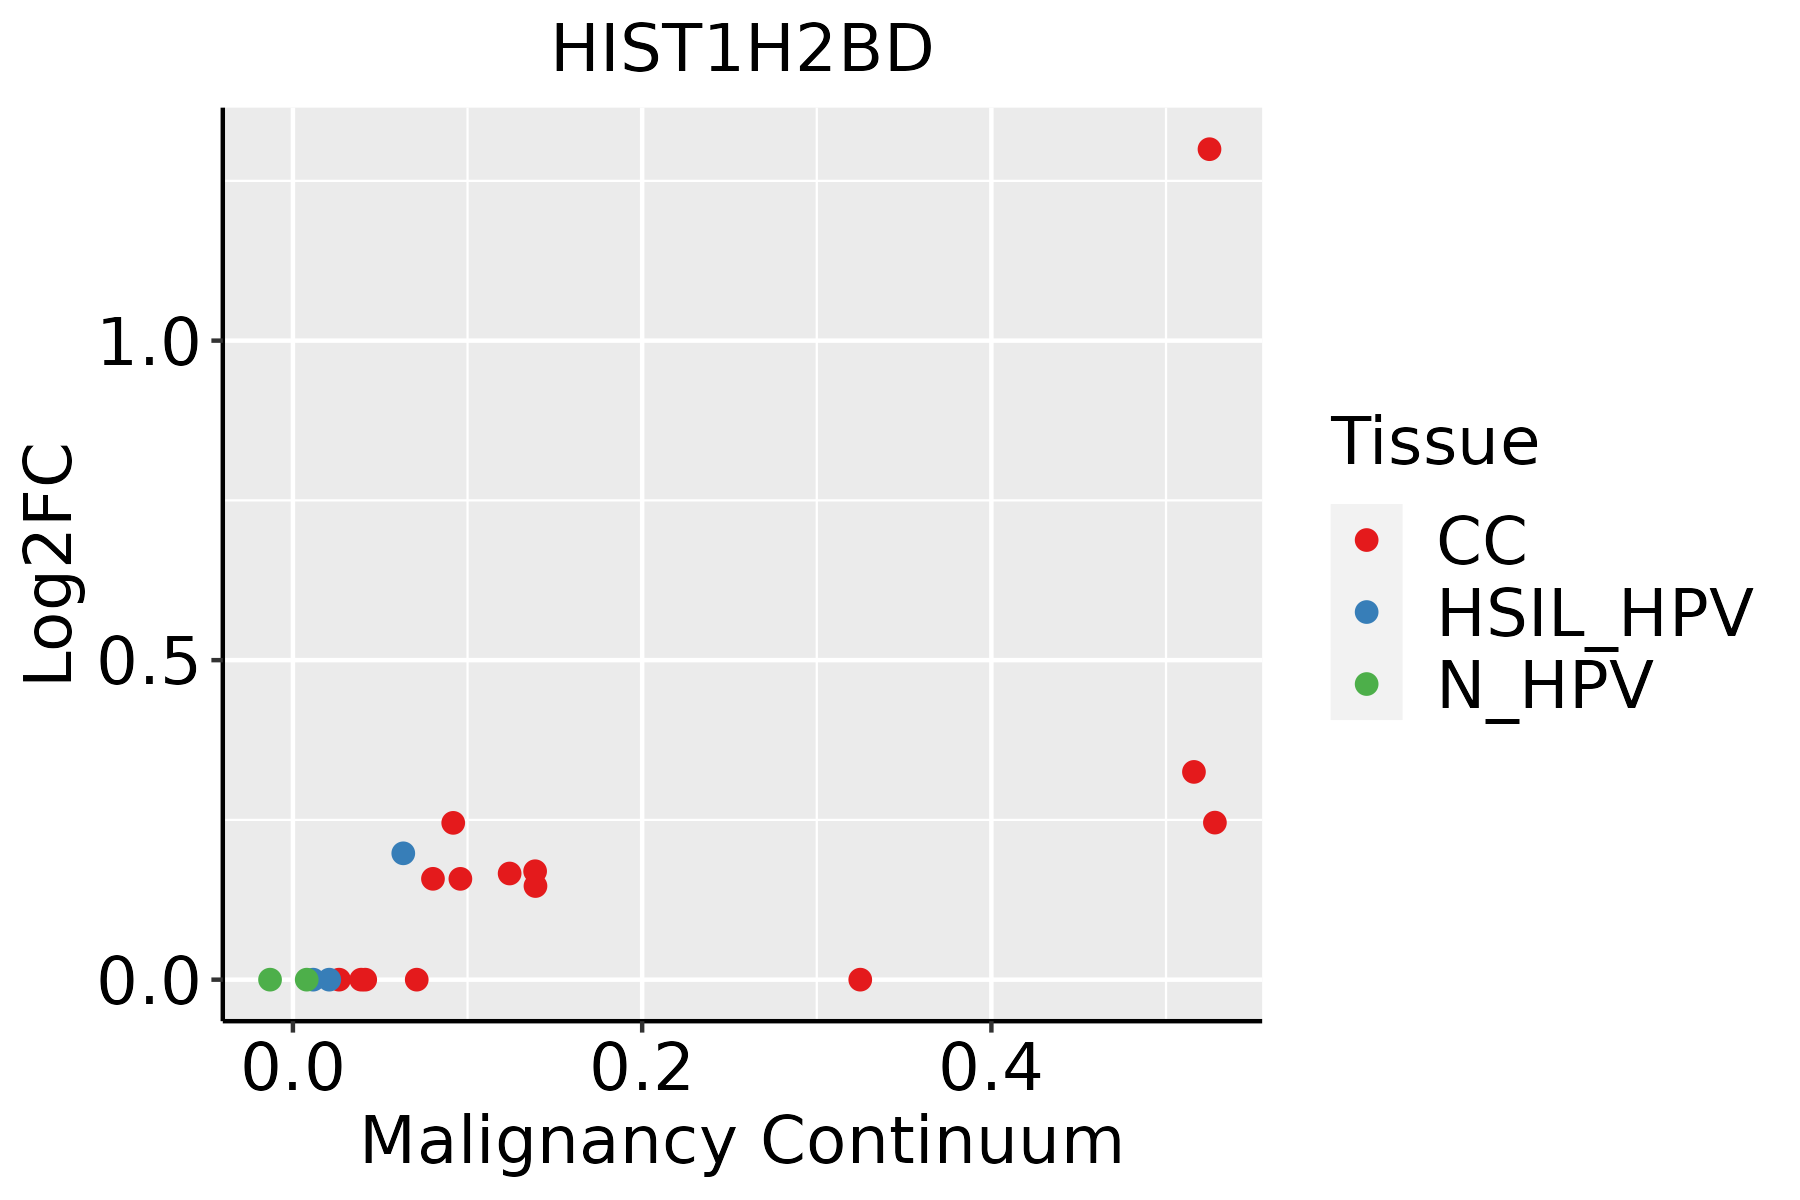 | CC: Cervix cancer |
| HSIL_HPV: HPV-infected high-grade squamous intraepithelial lesions | ||
| N_HPV: HPV-infected normal cervix | ||
| Liver | 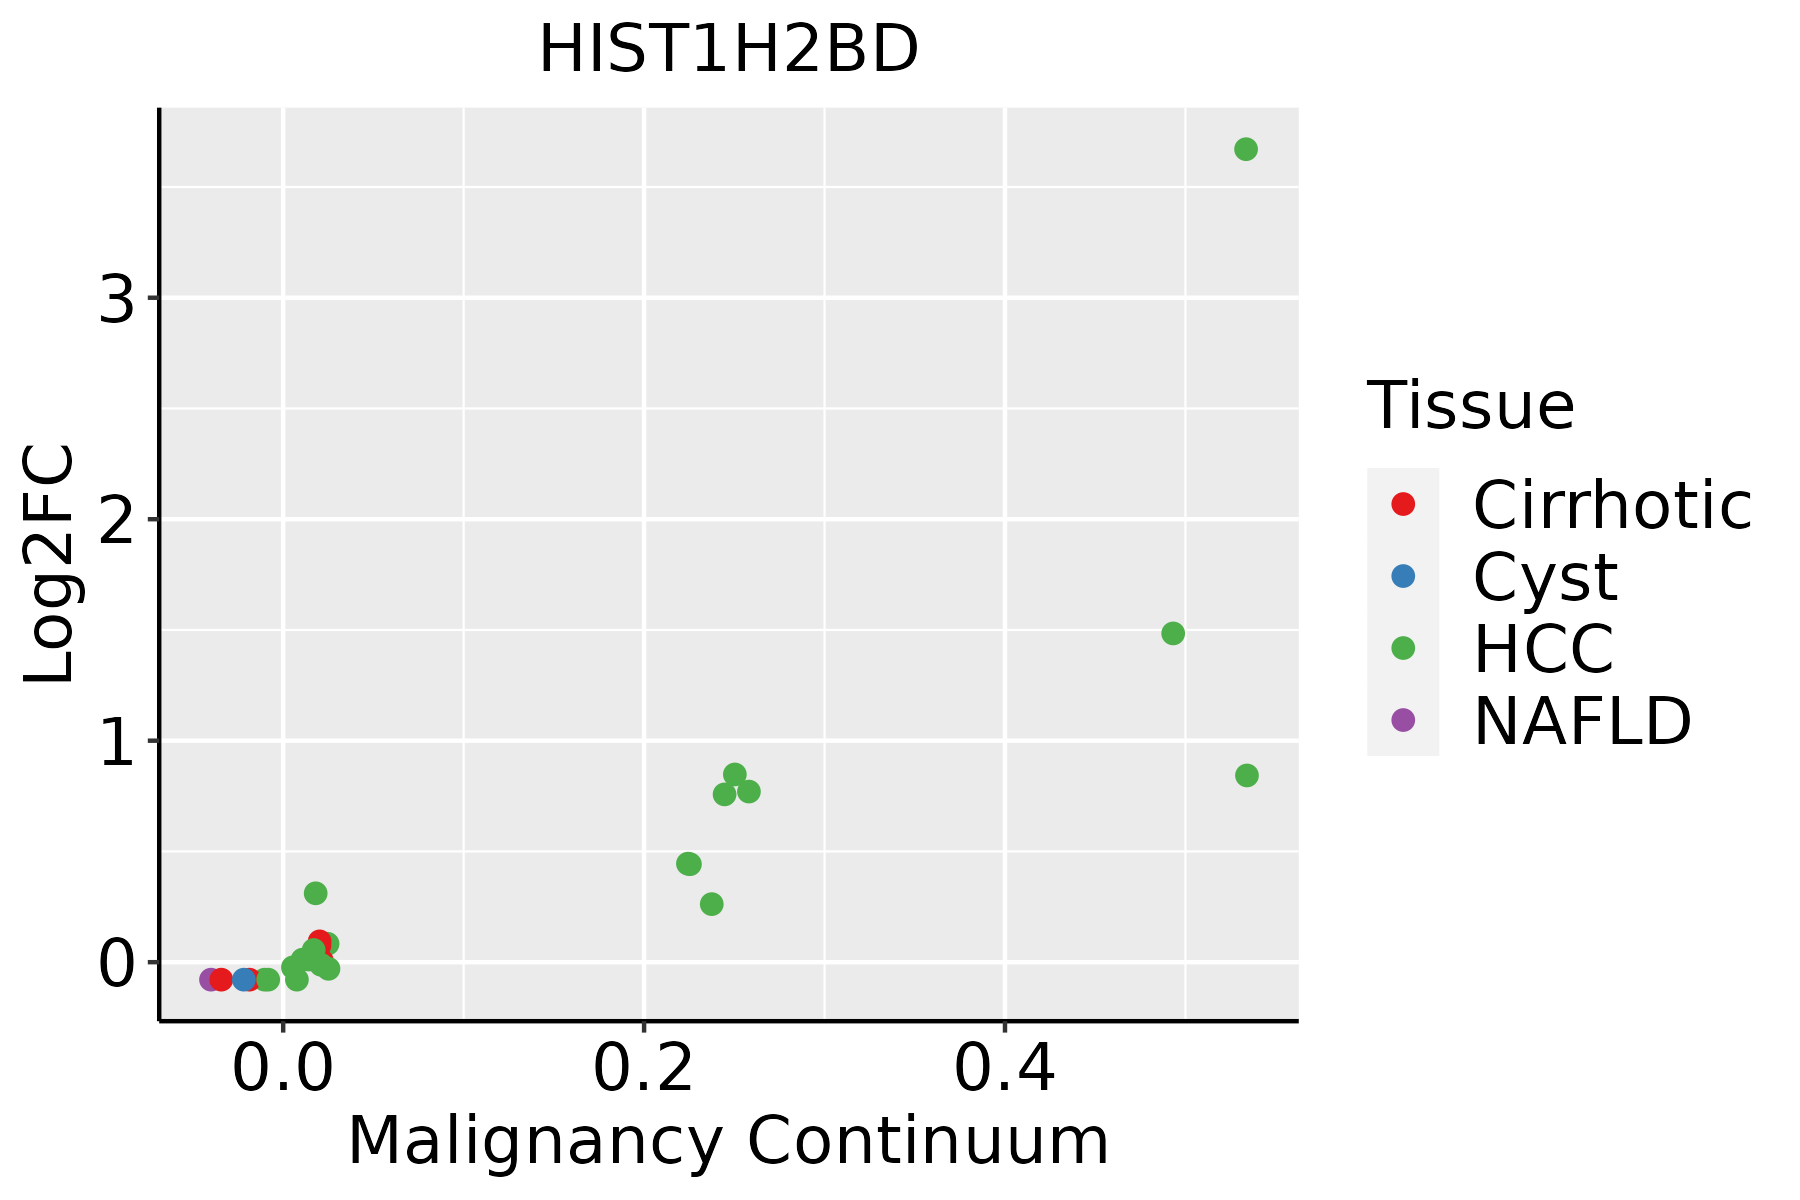 | HCC: Hepatocellular carcinoma |
| NAFLD: Non-alcoholic fatty liver disease | ||
| Lung |  | AAH: Atypical adenomatous hyperplasia |
| AIS: Adenocarcinoma in situ | ||
| IAC: Invasive lung adenocarcinoma | ||
| MIA: Minimally invasive adenocarcinoma | ||
| Oral Cavity | 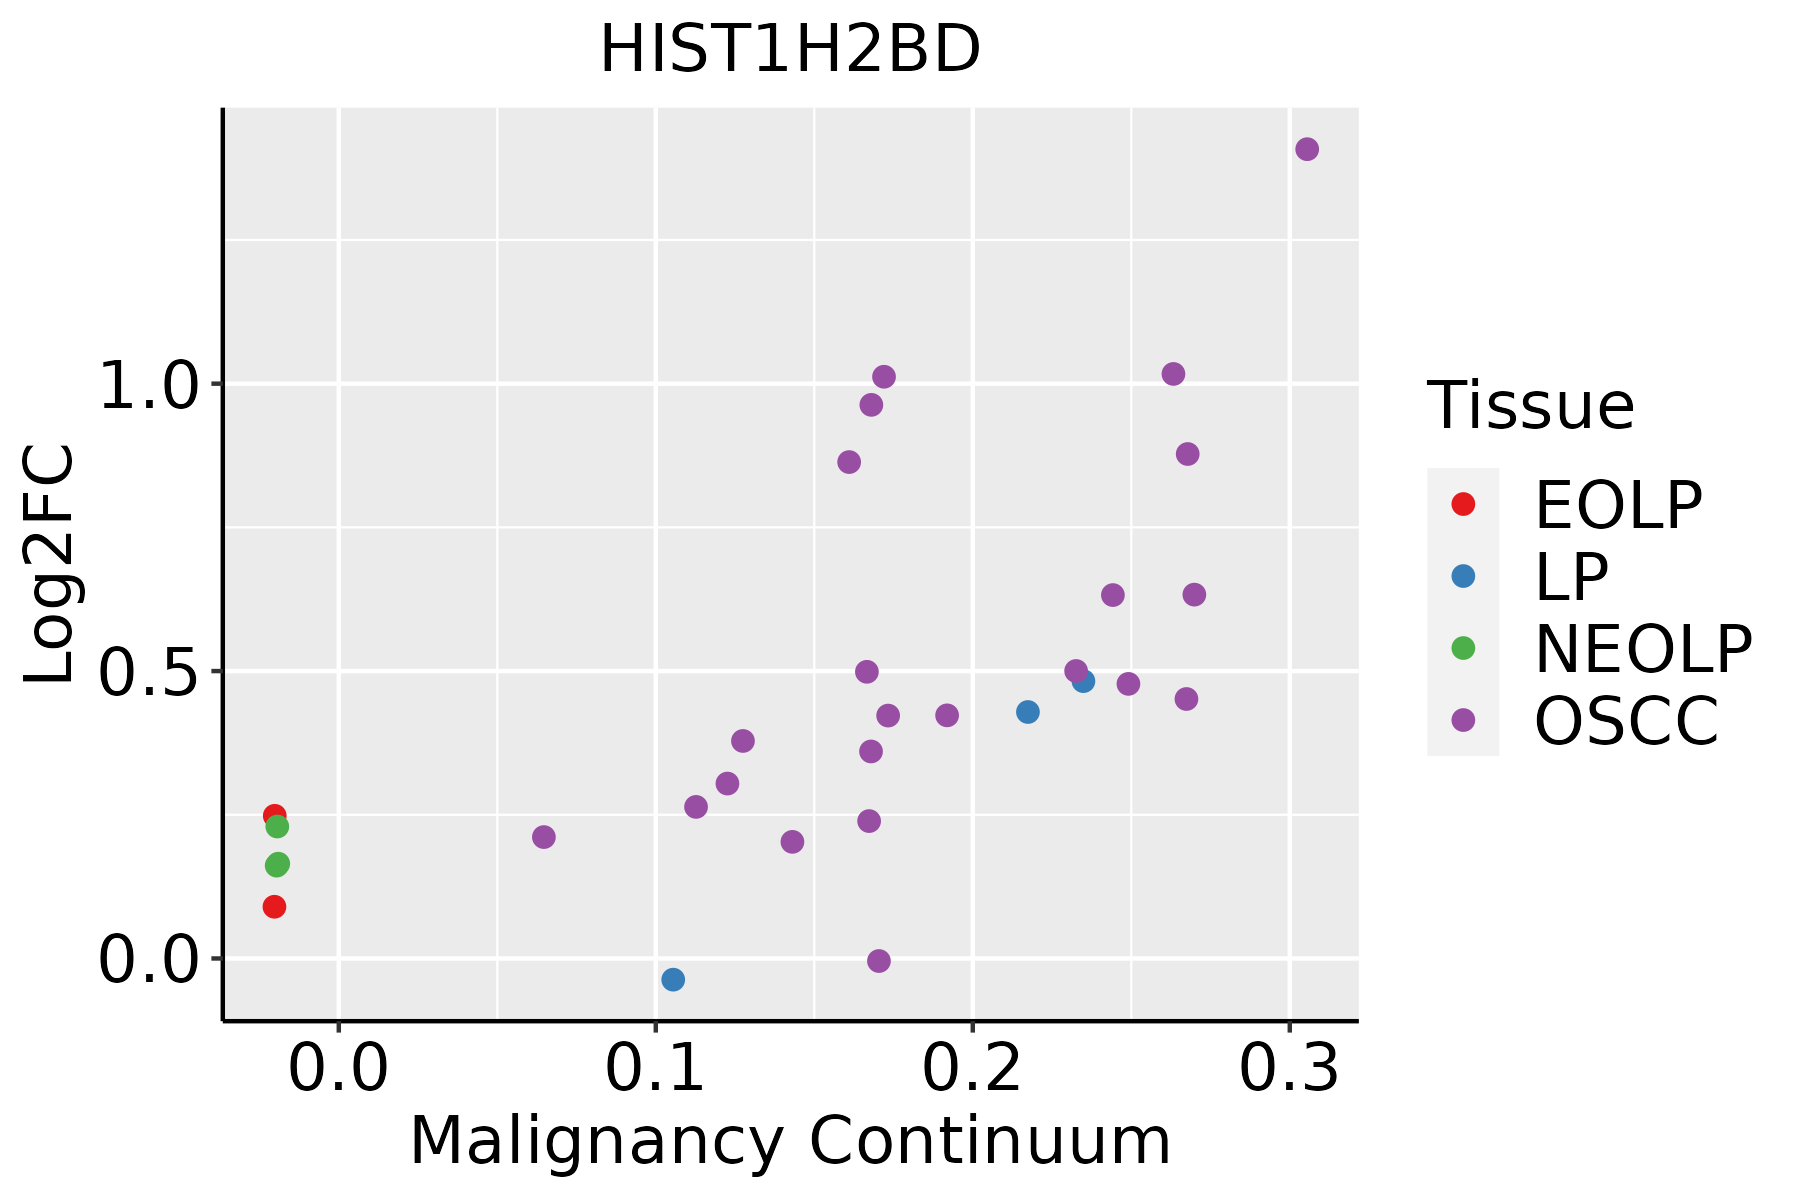 | EOLP: Erosive Oral lichen planus |
| LP: leukoplakia | ||
| NEOLP: Non-erosive oral lichen planus | ||
| OSCC: Oral squamous cell carcinoma |
| ∗log2FC in expression of this searched gene in stem-like cells from each diseased tissue sample relative to stem-like cells in normal samples in each tissue plotted against the malignancy continuum. Samples are colored based on if they are from different disease stage. |
Top |
Malignant transformation related pathway analysis |
| Find out the enriched GO biological processes and KEGG pathways involved in transition from healthy to precancer to cancer |
| Tissue | Disease Stage | Enriched GO biological Processes |
| Colorectum | AD |  |
| Colorectum | SER |  |
| Colorectum | MSS |  |
| Colorectum | MSI-H |  |
| Colorectum | FAP |  |
| ∗Top 15 enriched GO BP terms are showed in the bar plot of each disease state in each tissue. Each row represents a significant GO biological process which is colored according to the -log10(p.adjust). |
| Page: 1 2 3 4 5 6 7 8 9 |
| GO ID | Tissue | Disease Stage | Description | Gene Ratio | Bg Ratio | pvalue | p.adjust | Count |
| Page: 1 |
| Pathway ID | Tissue | Disease Stage | Description | Gene Ratio | Bg Ratio | pvalue | p.adjust | qvalue | Count |
| Page: 1 |
Top |
Cell-cell communication analysis |
| Identification of potential cell-cell interactions between two cell types and their ligand-receptor pairs for different disease states |
| Ligand | Receptor | LRpair | Pathway | Tissue | Disease Stage |
| Page: 1 |
Top |
Single-cell gene regulatory network inference analysis |
| Find out the significant the regulons (TFs) and the target genes of each regulon across cell types for different disease states |
| TF | Cell Type | Tissue | Disease Stage | Target Gene | RSS | Regulon Activity |
| ∗The dot plots of a searched regulon are shown for all cell subpopulations in each disease state of each tissue based on the regulon specific score inferred using pySCENIC and by calculating the average expression. |
| Page: 1 |
Top |
Somatic mutation of malignant transformation related genes |
| Annotation of somatic variants for genes involved in malignant transformation |
| Hugo Symbol | Variant Class | Variant Classification | dbSNP RS | HGVSc | HGVSp | HGVSp Short | SWISSPROT | BIOTYPE | SIFT | PolyPhen | Tumor Sample Barcode | Tissue | Histology | Sex | Age | Stage | Therapy Types | Drugs | Outcome |
| HIST1H2BD | SNV | Missense_Mutation | novel | c.323N>T | p.Ala108Val | p.A108V | P58876 | protein_coding | deleterious_low_confidence(0.02) | benign(0.028) | TCGA-A2-A04Q-01 | Breast | breast invasive carcinoma | Female | <65 | I/II | Chemotherapy | adriamycin | SD |
| HIST1H2BD | SNV | Missense_Mutation | c.229G>C | p.Glu77Gln | p.E77Q | P58876 | protein_coding | deleterious_low_confidence(0) | possibly_damaging(0.87) | TCGA-OL-A5RW-01 | Breast | breast invasive carcinoma | Female | <65 | I/II | Chemotherapy | adriamycin | CR | |
| HIST1H2BD | SNV | Missense_Mutation | c.95N>T | p.Arg32Leu | p.R32L | P58876 | protein_coding | deleterious_low_confidence(0.04) | benign(0.134) | TCGA-C5-A7UH-01 | Cervix | cervical & endocervical cancer | Female | <65 | III/IV | Chemotherapy | cisplatin | SD | |
| HIST1H2BD | SNV | Missense_Mutation | rs757195477 | c.10C>T | p.Pro4Ser | p.P4S | P58876 | protein_coding | tolerated_low_confidence(0.11) | benign(0.132) | TCGA-EX-A69M-01 | Cervix | cervical & endocervical cancer | Female | <65 | I/II | Unknown | Unknown | PD |
| HIST1H2BD | insertion | Frame_Shift_Ins | novel | c.369_370insACTGAAT | p.Ser124ThrfsTer3 | p.S124Tfs*3 | P58876 | protein_coding | TCGA-DS-A1OC-01 | Cervix | cervical & endocervical cancer | Female | <65 | I/II | Chemotherapy | gemcitabine | SD | ||
| HIST1H2BD | SNV | Missense_Mutation | c.185N>A | p.Ile62Asn | p.I62N | P58876 | protein_coding | deleterious_low_confidence(0) | probably_damaging(0.999) | TCGA-AA-3811-01 | Colorectum | colon adenocarcinoma | Female | >=65 | III/IV | Unknown | Unknown | PD | |
| HIST1H2BD | SNV | Missense_Mutation | c.118G>A | p.Val40Met | p.V40M | P58876 | protein_coding | tolerated_low_confidence(0.16) | benign(0.03) | TCGA-AA-A01R-01 | Colorectum | colon adenocarcinoma | Male | <65 | III/IV | Chemotherapy | 5-fluorouracil | PD | |
| HIST1H2BD | SNV | Missense_Mutation | novel | c.58A>G | p.Thr20Ala | p.T20A | P58876 | protein_coding | tolerated_low_confidence(0.11) | benign(0.017) | TCGA-AA-A02R-01 | Colorectum | colon adenocarcinoma | Female | >=65 | I/II | Unknown | Unknown | PD |
| HIST1H2BD | SNV | Missense_Mutation | c.364N>C | p.Tyr122His | p.Y122H | P58876 | protein_coding | deleterious_low_confidence(0.03) | benign(0.057) | TCGA-CM-4746-01 | Colorectum | colon adenocarcinoma | Male | <65 | I/II | Unknown | Unknown | SD | |
| HIST1H2BD | SNV | Missense_Mutation | rs779615788 | c.132N>T | p.Lys44Asn | p.K44N | P58876 | protein_coding | deleterious_low_confidence(0.01) | benign(0.098) | TCGA-CM-5861-01 | Colorectum | colon adenocarcinoma | Female | <65 | I/II | Unknown | Unknown | PD |
| Page: 1 2 3 4 |
Top |
Related drugs of malignant transformation related genes |
| Identification of chemicals and drugs interact with genes involved in malignant transfromation |
| (DGIdb 4.0) |
| Entrez ID | Symbol | Category | Interaction Types | Drug Claim Name | Drug Name | PMIDs |
| Page: 1 |

Copyright 2023-Present -The University of Texas Health Science Center at Houston |