
|
|||||
|
 | |
| |
| |
| |
| |
| |
|
Gene: HIST1H2BB |
Gene summary for HIST1H2BB |
| Gene information | Species | Human | Gene symbol | HIST1H2BB | Gene ID | 3018 |
| Gene name | H2B clustered histone 3 | |
| Gene Alias | H2B.1 | |
| Cytomap | 6p22.2 | |
| Gene Type | protein-coding | GO ID | GO:0006323 | UniProtAcc | P33778 |
Top |
Malignant transformation analysis |
| Identification of the aberrant gene expression in precancerous and cancerous lesions by comparing the gene expression of stem-like cells in diseased tissues with normal stem cells |
| Entrez ID | Symbol | Replicates | Species | Organ | Tissue | Adj P-value | Log2FC | Malignancy |
| 3018 | HIST1H2BB | LZE7T | Human | Esophagus | ESCC | 1.62e-04 | 3.83e-01 | 0.0667 |
| 3018 | HIST1H2BB | LZE22D3 | Human | Esophagus | HGIN | 1.73e-02 | 7.78e-01 | 0.0653 |
| 3018 | HIST1H2BB | LZE21T | Human | Esophagus | ESCC | 1.16e-05 | 4.29e-01 | 0.0655 |
| 3018 | HIST1H2BB | P1T-E | Human | Esophagus | ESCC | 1.75e-21 | 1.52e+00 | 0.0875 |
| 3018 | HIST1H2BB | P8T-E | Human | Esophagus | ESCC | 7.90e-03 | 1.08e-01 | 0.0889 |
| 3018 | HIST1H2BB | P10T-E | Human | Esophagus | ESCC | 4.30e-10 | 2.64e-01 | 0.116 |
| 3018 | HIST1H2BB | P12T-E | Human | Esophagus | ESCC | 2.02e-06 | 1.67e-01 | 0.1122 |
| 3018 | HIST1H2BB | P27T-E | Human | Esophagus | ESCC | 2.05e-07 | 2.79e-01 | 0.1055 |
| 3018 | HIST1H2BB | P37T-E | Human | Esophagus | ESCC | 4.28e-02 | 1.18e-01 | 0.1371 |
| 3018 | HIST1H2BB | P47T-E | Human | Esophagus | ESCC | 4.41e-07 | 2.21e-01 | 0.1067 |
| 3018 | HIST1H2BB | P48T-E | Human | Esophagus | ESCC | 4.41e-07 | 3.42e-01 | 0.0959 |
| 3018 | HIST1H2BB | P52T-E | Human | Esophagus | ESCC | 3.60e-13 | 5.23e-01 | 0.1555 |
| 3018 | HIST1H2BB | P54T-E | Human | Esophagus | ESCC | 3.18e-08 | 6.94e-01 | 0.0975 |
| 3018 | HIST1H2BB | P61T-E | Human | Esophagus | ESCC | 1.60e-19 | 8.74e-01 | 0.099 |
| 3018 | HIST1H2BB | P65T-E | Human | Esophagus | ESCC | 4.28e-08 | 2.04e-01 | 0.0978 |
| 3018 | HIST1H2BB | P104T-E | Human | Esophagus | ESCC | 2.06e-06 | 4.21e-01 | 0.0931 |
| 3018 | HIST1H2BB | P107T-E | Human | Esophagus | ESCC | 8.98e-03 | 1.58e-01 | 0.171 |
| 3018 | HIST1H2BB | P130T-E | Human | Esophagus | ESCC | 1.62e-13 | 4.02e-01 | 0.1676 |
| Page: 1 |
| Tissue | Expression Dynamics | Abbreviation |
| Esophagus | 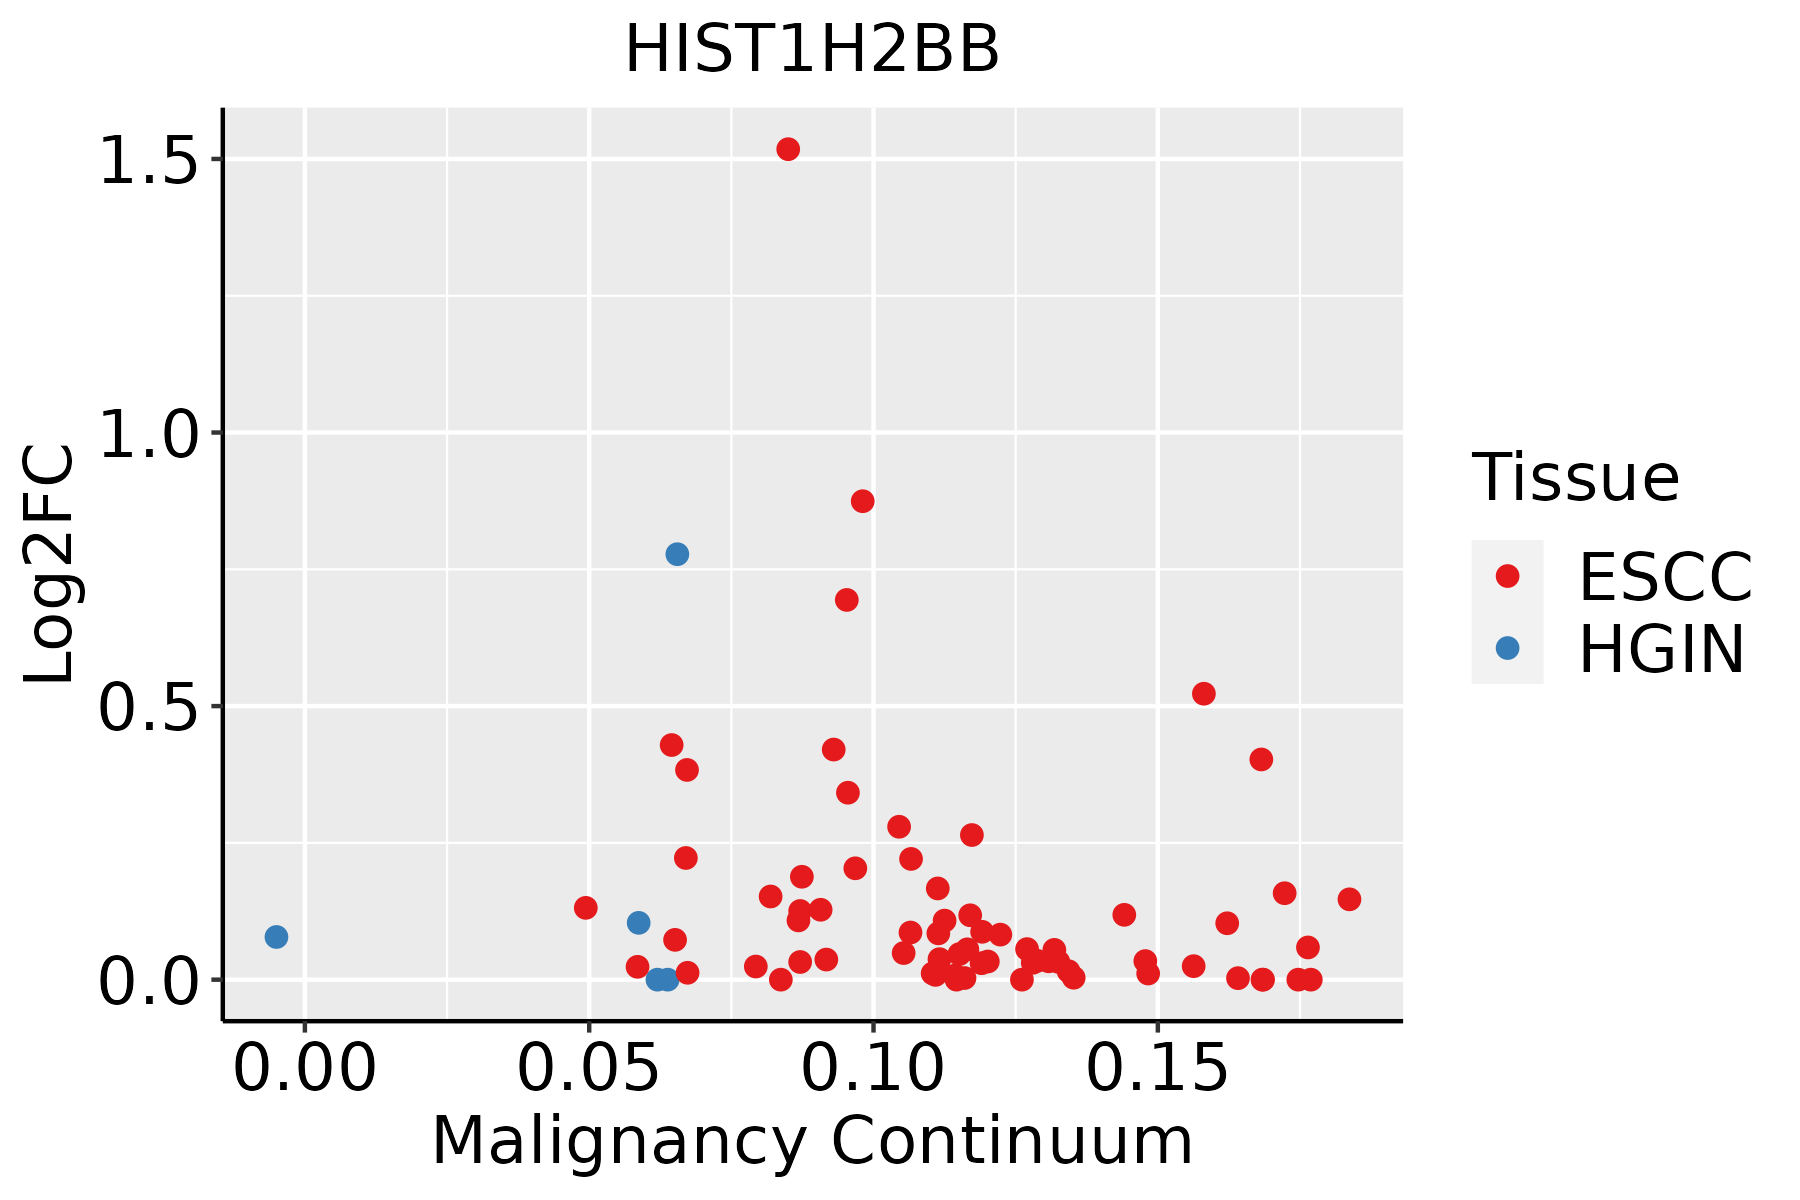 | ESCC: Esophageal squamous cell carcinoma |
| HGIN: High-grade intraepithelial neoplasias | ||
| LGIN: Low-grade intraepithelial neoplasias |
| ∗log2FC in expression of this searched gene in stem-like cells from each diseased tissue sample relative to stem-like cells in normal samples in each tissue plotted against the malignancy continuum. Samples are colored based on if they are from different disease stage. |
Top |
Malignant transformation related pathway analysis |
| Find out the enriched GO biological processes and KEGG pathways involved in transition from healthy to precancer to cancer |
| Tissue | Disease Stage | Enriched GO biological Processes |
| Colorectum | AD |  |
| Colorectum | SER |  |
| Colorectum | MSS |  |
| Colorectum | MSI-H |  |
| Colorectum | FAP |  |
| ∗Top 15 enriched GO BP terms are showed in the bar plot of each disease state in each tissue. Each row represents a significant GO biological process which is colored according to the -log10(p.adjust). |
| Page: 1 2 3 4 5 6 7 8 9 |
| GO ID | Tissue | Disease Stage | Description | Gene Ratio | Bg Ratio | pvalue | p.adjust | Count |
| Page: 1 |
| Pathway ID | Tissue | Disease Stage | Description | Gene Ratio | Bg Ratio | pvalue | p.adjust | qvalue | Count |
| Page: 1 |
Top |
Cell-cell communication analysis |
| Identification of potential cell-cell interactions between two cell types and their ligand-receptor pairs for different disease states |
| Ligand | Receptor | LRpair | Pathway | Tissue | Disease Stage |
| Page: 1 |
Top |
Single-cell gene regulatory network inference analysis |
| Find out the significant the regulons (TFs) and the target genes of each regulon across cell types for different disease states |
| TF | Cell Type | Tissue | Disease Stage | Target Gene | RSS | Regulon Activity |
| ∗The dot plots of a searched regulon are shown for all cell subpopulations in each disease state of each tissue based on the regulon specific score inferred using pySCENIC and by calculating the average expression. |
| Page: 1 |
Top |
Somatic mutation of malignant transformation related genes |
| Annotation of somatic variants for genes involved in malignant transformation |
| Hugo Symbol | Variant Class | Variant Classification | dbSNP RS | HGVSc | HGVSp | HGVSp Short | SWISSPROT | BIOTYPE | SIFT | PolyPhen | Tumor Sample Barcode | Tissue | Histology | Sex | Age | Stage | Therapy Types | Drugs | Outcome |
| HIST1H2BB | SNV | Missense_Mutation | c.363N>C | p.Lys121Asn | p.K121N | P33778 | protein_coding | deleterious_low_confidence(0) | benign(0.044) | TCGA-A7-A0DA-01 | Breast | breast invasive carcinoma | Female | <65 | I/II | Chemotherapy | adriamycin | SD | |
| HIST1H2BB | SNV | Missense_Mutation | c.282N>C | p.Glu94Asp | p.E94D | P33778 | protein_coding | deleterious_low_confidence(0.02) | benign(0.043) | TCGA-A7-A0DA-01 | Breast | breast invasive carcinoma | Female | <65 | I/II | Chemotherapy | adriamycin | SD | |
| HIST1H2BB | SNV | Missense_Mutation | rs775001760 | c.217N>T | p.Arg73Cys | p.R73C | P33778 | protein_coding | tolerated_low_confidence(0.11) | benign(0.006) | TCGA-AN-A0AK-01 | Breast | breast invasive carcinoma | Female | >=65 | I/II | Unknown | Unknown | SD |
| HIST1H2BB | SNV | Missense_Mutation | c.214N>A | p.Glu72Lys | p.E72K | P33778 | protein_coding | deleterious_low_confidence(0.03) | benign(0.007) | TCGA-BH-A0DS-01 | Breast | breast invasive carcinoma | Female | >=65 | III/IV | Chemotherapy | cyclophosphamide | SD | |
| HIST1H2BB | insertion | Frame_Shift_Ins | novel | c.40_41insTCGTGATGGCGCTCTTTCTCATCTGTCTTAGCAAACT | p.Gly14ValfsTer15 | p.G14Vfs*15 | P33778 | protein_coding | TCGA-A8-A08G-01 | Breast | breast invasive carcinoma | Female | <65 | I/II | Chemotherapy | 5-fluorouracil | CR | ||
| HIST1H2BB | insertion | Nonsense_Mutation | novel | c.57_58insCCGCTCCACAAAATGAAATCGCAGTAGTTTTGAGTTATAATTGTTT | p.Thr20ProfsTer9 | p.T20Pfs*9 | P33778 | protein_coding | TCGA-AN-A0FN-01 | Breast | breast invasive carcinoma | Female | <65 | I/II | Unknown | Unknown | SD | ||
| HIST1H2BB | insertion | Nonsense_Mutation | novel | c.12_13insACTAAGGCAGTTACCAAGTACACTAGCTCTAAATAAGTGCTTATGTAAG | p.Ser5ThrfsTer12 | p.S5Tfs*12 | P33778 | protein_coding | TCGA-AQ-A04J-01 | Breast | breast invasive carcinoma | Female | <65 | I/II | Chemotherapy | cytoxan | SD | ||
| HIST1H2BB | SNV | Missense_Mutation | novel | c.332C>T | p.Ala111Val | p.A111V | P33778 | protein_coding | deleterious_low_confidence(0) | benign(0.062) | TCGA-C5-A2LY-01 | Cervix | cervical & endocervical cancer | Female | <65 | I/II | Chemotherapy | cisplatin | SD |
| HIST1H2BB | SNV | Missense_Mutation | rs756126649 | c.290N>T | p.Thr97Met | p.T97M | P33778 | protein_coding | deleterious_low_confidence(0.02) | probably_damaging(0.996) | TCGA-AD-5900-01 | Colorectum | colon adenocarcinoma | Male | >=65 | I/II | Unknown | Unknown | SD |
| HIST1H2BB | SNV | Missense_Mutation | c.74N>G | p.Lys25Arg | p.K25R | P33778 | protein_coding | deleterious_low_confidence(0.03) | benign(0.035) | TCGA-DM-A288-01 | Colorectum | colon adenocarcinoma | Male | >=65 | III/IV | Unknown | Unknown | PD |
| Page: 1 2 3 4 |
Top |
Related drugs of malignant transformation related genes |
| Identification of chemicals and drugs interact with genes involved in malignant transfromation |
| (DGIdb 4.0) |
| Entrez ID | Symbol | Category | Interaction Types | Drug Claim Name | Drug Name | PMIDs |
| Page: 1 |

Copyright 2023-Present -The University of Texas Health Science Center at Houston |