
|
|||||
|
 | |
| |
| |
| |
| |
| |
|
Gene: HIST1H2AM |
Gene summary for HIST1H2AM |
| Gene information | Species | Human | Gene symbol | HIST1H2AM | Gene ID | 8336 |
| Gene name | H2A clustered histone 17 | |
| Gene Alias | H2A.1 | |
| Cytomap | 6p22.1 | |
| Gene Type | protein-coding | GO ID | GO:0008150 | UniProtAcc | A4FTV9 |
Top |
Malignant transformation analysis |
| Identification of the aberrant gene expression in precancerous and cancerous lesions by comparing the gene expression of stem-like cells in diseased tissues with normal stem cells |
| Entrez ID | Symbol | Replicates | Species | Organ | Tissue | Adj P-value | Log2FC | Malignancy |
| 8336 | HIST1H2AM | LZE5T | Human | Esophagus | ESCC | 1.57e-02 | 2.22e-01 | 0.0514 |
| 8336 | HIST1H2AM | LZE7T | Human | Esophagus | ESCC | 6.13e-07 | 3.01e-01 | 0.0667 |
| 8336 | HIST1H2AM | LZE20T | Human | Esophagus | ESCC | 1.74e-07 | 2.61e-01 | 0.0662 |
| 8336 | HIST1H2AM | LZE21D1 | Human | Esophagus | HGIN | 1.78e-14 | 8.48e-01 | 0.0632 |
| 8336 | HIST1H2AM | LZE22D1 | Human | Esophagus | HGIN | 1.32e-09 | 4.42e-01 | 0.0595 |
| 8336 | HIST1H2AM | LZE22T | Human | Esophagus | ESCC | 1.00e-09 | 8.93e-01 | 0.068 |
| 8336 | HIST1H2AM | LZE22D3 | Human | Esophagus | HGIN | 1.73e-02 | 5.85e-01 | 0.0653 |
| 8336 | HIST1H2AM | LZE21T | Human | Esophagus | ESCC | 2.35e-12 | 8.07e-01 | 0.0655 |
| 8336 | HIST1H2AM | P1T-E | Human | Esophagus | ESCC | 1.97e-23 | 1.78e+00 | 0.0875 |
| 8336 | HIST1H2AM | P2T-E | Human | Esophagus | ESCC | 1.88e-11 | 2.61e-01 | 0.1177 |
| 8336 | HIST1H2AM | P4T-E | Human | Esophagus | ESCC | 6.27e-06 | 1.57e-01 | 0.1323 |
| 8336 | HIST1H2AM | P8T-E | Human | Esophagus | ESCC | 3.75e-03 | 9.92e-02 | 0.0889 |
| 8336 | HIST1H2AM | P10T-E | Human | Esophagus | ESCC | 1.66e-02 | 9.78e-02 | 0.116 |
| 8336 | HIST1H2AM | P11T-E | Human | Esophagus | ESCC | 4.74e-03 | 1.62e-01 | 0.1426 |
| 8336 | HIST1H2AM | P12T-E | Human | Esophagus | ESCC | 9.53e-09 | 2.21e-01 | 0.1122 |
| 8336 | HIST1H2AM | P15T-E | Human | Esophagus | ESCC | 3.34e-06 | 1.86e-01 | 0.1149 |
| 8336 | HIST1H2AM | P17T-E | Human | Esophagus | ESCC | 1.29e-08 | 4.29e-01 | 0.1278 |
| 8336 | HIST1H2AM | P20T-E | Human | Esophagus | ESCC | 7.88e-10 | 2.62e-01 | 0.1124 |
| 8336 | HIST1H2AM | P22T-E | Human | Esophagus | ESCC | 1.35e-23 | 4.21e-01 | 0.1236 |
| 8336 | HIST1H2AM | P23T-E | Human | Esophagus | ESCC | 1.66e-06 | 2.83e-01 | 0.108 |
| Page: 1 2 3 |
| Tissue | Expression Dynamics | Abbreviation |
| Esophagus | 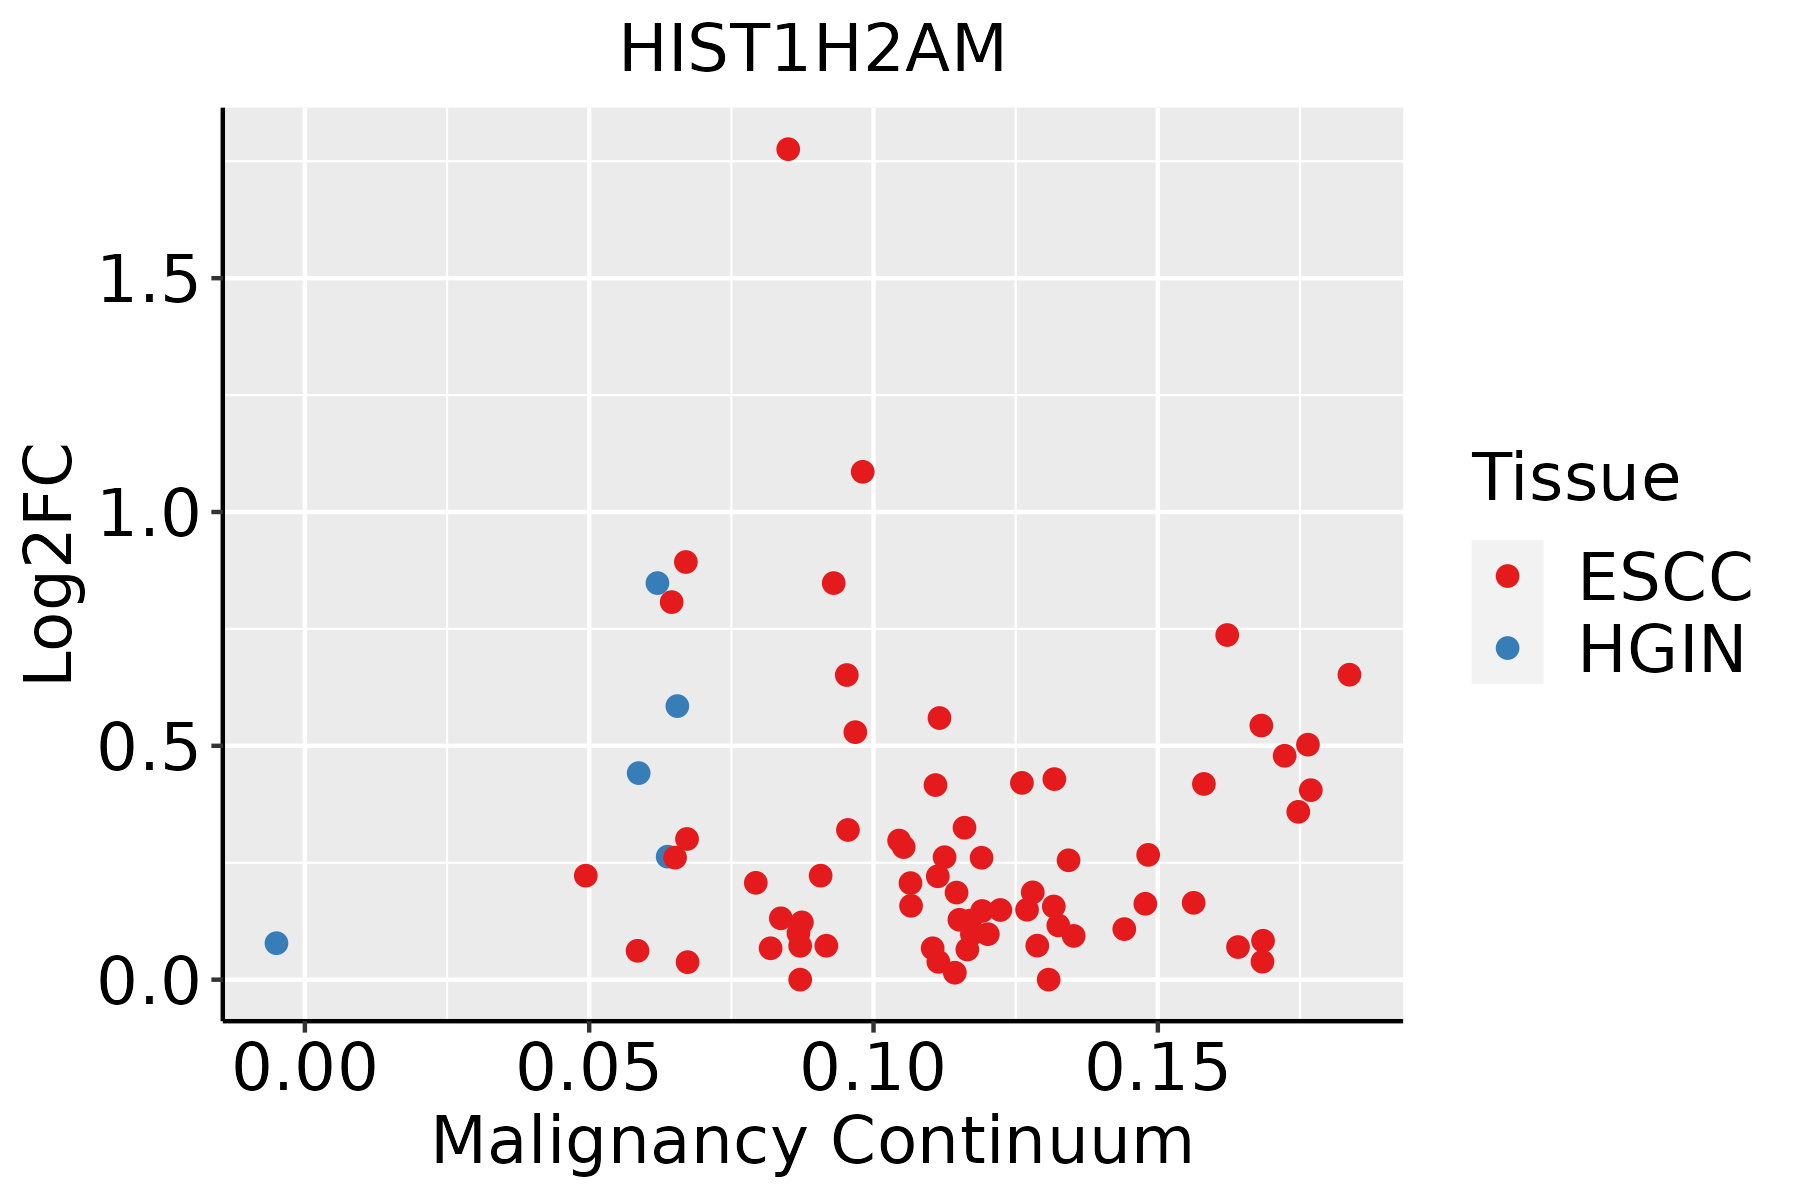 | ESCC: Esophageal squamous cell carcinoma |
| HGIN: High-grade intraepithelial neoplasias | ||
| LGIN: Low-grade intraepithelial neoplasias | ||
| Skin | 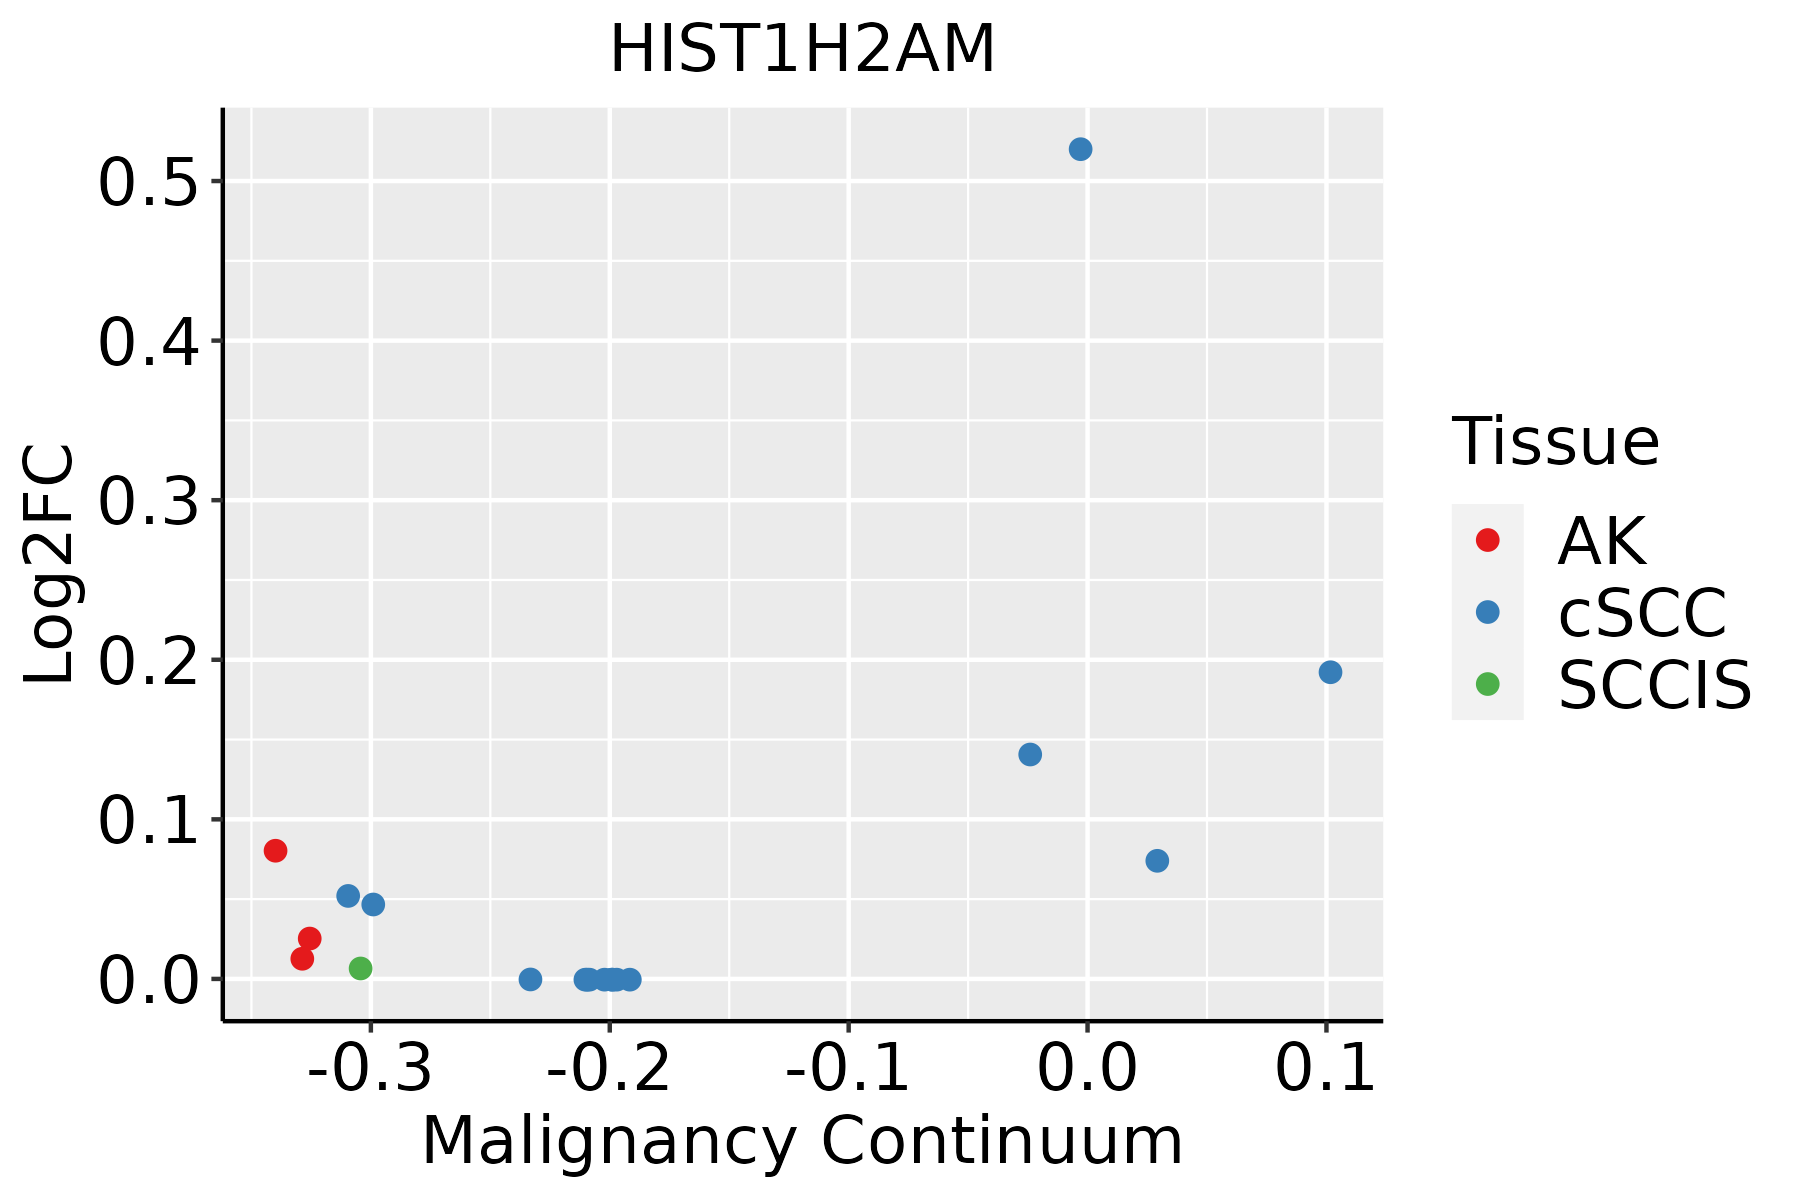 | AK: Actinic keratosis |
| cSCC: Cutaneous squamous cell carcinoma | ||
| SCCIS:squamous cell carcinoma in situ |
| ∗log2FC in expression of this searched gene in stem-like cells from each diseased tissue sample relative to stem-like cells in normal samples in each tissue plotted against the malignancy continuum. Samples are colored based on if they are from different disease stage. |
Top |
Malignant transformation related pathway analysis |
| Find out the enriched GO biological processes and KEGG pathways involved in transition from healthy to precancer to cancer |
| Tissue | Disease Stage | Enriched GO biological Processes |
| Colorectum | AD |  |
| Colorectum | SER |  |
| Colorectum | MSS |  |
| Colorectum | MSI-H |  |
| Colorectum | FAP |  |
| ∗Top 15 enriched GO BP terms are showed in the bar plot of each disease state in each tissue. Each row represents a significant GO biological process which is colored according to the -log10(p.adjust). |
| Page: 1 2 3 4 5 6 7 8 9 |
| GO ID | Tissue | Disease Stage | Description | Gene Ratio | Bg Ratio | pvalue | p.adjust | Count |
| Page: 1 |
| Pathway ID | Tissue | Disease Stage | Description | Gene Ratio | Bg Ratio | pvalue | p.adjust | qvalue | Count |
| Page: 1 |
Top |
Cell-cell communication analysis |
| Identification of potential cell-cell interactions between two cell types and their ligand-receptor pairs for different disease states |
| Ligand | Receptor | LRpair | Pathway | Tissue | Disease Stage |
| Page: 1 |
Top |
Single-cell gene regulatory network inference analysis |
| Find out the significant the regulons (TFs) and the target genes of each regulon across cell types for different disease states |
| TF | Cell Type | Tissue | Disease Stage | Target Gene | RSS | Regulon Activity |
| ∗The dot plots of a searched regulon are shown for all cell subpopulations in each disease state of each tissue based on the regulon specific score inferred using pySCENIC and by calculating the average expression. |
| Page: 1 |
Top |
Somatic mutation of malignant transformation related genes |
| Annotation of somatic variants for genes involved in malignant transformation |
| Hugo Symbol | Variant Class | Variant Classification | dbSNP RS | HGVSc | HGVSp | HGVSp Short | SWISSPROT | BIOTYPE | SIFT | PolyPhen | Tumor Sample Barcode | Tissue | Histology | Sex | Age | Stage | Therapy Types | Drugs | Outcome |
| HIST1H2AM | insertion | Frame_Shift_Ins | novel | c.227_228insA | p.Thr77AspfsTer24 | p.T77Dfs*24 | P0C0S8 | protein_coding | TCGA-AN-A0AK-01 | Breast | breast invasive carcinoma | Female | >=65 | I/II | Unknown | Unknown | SD | ||
| HIST1H2AM | SNV | Missense_Mutation | rs571168598 | c.50C>T | p.Thr17Ile | p.T17I | P0C0S8 | protein_coding | deleterious_low_confidence(0) | benign(0.003) | TCGA-NH-A5IV-01 | Colorectum | colon adenocarcinoma | Female | >=65 | I/II | Unknown | Unknown | SD |
| HIST1H2AM | insertion | Frame_Shift_Ins | novel | c.383_384insA | p.Lys130GlnfsTer? | p.K130Qfs*? | P0C0S8 | protein_coding | TCGA-WS-AB45-01 | Colorectum | colon adenocarcinoma | Female | <65 | I/II | Unknown | Unknown | SD | ||
| HIST1H2AM | SNV | Missense_Mutation | novel | c.366G>T | p.Glu122Asp | p.E122D | P0C0S8 | protein_coding | tolerated_low_confidence(0.16) | benign(0) | TCGA-AJ-A3EK-01 | Endometrium | uterine corpus endometrioid carcinoma | Female | <65 | I/II | Chemotherapy | carboplatin | CR |
| HIST1H2AM | SNV | Missense_Mutation | novel | c.130N>A | p.Val44Ile | p.V44I | P0C0S8 | protein_coding | tolerated_low_confidence(0.41) | benign(0.06) | TCGA-AP-A1DK-01 | Endometrium | uterine corpus endometrioid carcinoma | Female | <65 | I/II | Unknown | Unknown | SD |
| HIST1H2AM | SNV | Missense_Mutation | c.229A>G | p.Thr77Ala | p.T77A | P0C0S8 | protein_coding | deleterious_low_confidence(0.03) | benign(0.007) | TCGA-D1-A0ZR-01 | Endometrium | uterine corpus endometrioid carcinoma | Female | <65 | I/II | Unknown | Unknown | SD | |
| HIST1H2AM | SNV | Missense_Mutation | c.266N>A | p.Arg89His | p.R89H | P0C0S8 | protein_coding | deleterious_low_confidence(0.02) | probably_damaging(0.995) | TCGA-D1-A17Q-01 | Endometrium | uterine corpus endometrioid carcinoma | Female | <65 | I/II | Unknown | Unknown | SD | |
| HIST1H2AM | SNV | Missense_Mutation | novel | c.172N>A | p.Tyr58Asn | p.Y58N | P0C0S8 | protein_coding | deleterious_low_confidence(0) | probably_damaging(0.997) | TCGA-FI-A2EW-01 | Endometrium | uterine corpus endometrioid carcinoma | Female | >=65 | I/II | Chemotherapy | carboplatinum | PD |
| HIST1H2AM | insertion | Frame_Shift_Ins | novel | c.344_345insGT | p.Leu116TyrfsTer? | p.L116Yfs*? | P0C0S8 | protein_coding | TCGA-AX-A2H5-01 | Endometrium | uterine corpus endometrioid carcinoma | Female | >=65 | III/IV | Chemotherapy | carboplatin | CR | ||
| HIST1H2AM | SNV | Missense_Mutation | c.22N>T | p.Gly8Cys | p.G8C | P0C0S8 | protein_coding | deleterious_low_confidence(0) | probably_damaging(0.975) | TCGA-80-5611-01 | Lung | lung adenocarcinoma | Male | Unknown | I/II | Unknown | Unknown | SD |
| Page: 1 2 |
Top |
Related drugs of malignant transformation related genes |
| Identification of chemicals and drugs interact with genes involved in malignant transfromation |
| (DGIdb 4.0) |
| Entrez ID | Symbol | Category | Interaction Types | Drug Claim Name | Drug Name | PMIDs |
| Page: 1 |

Copyright 2023-Present -The University of Texas Health Science Center at Houston |