
|
|||||
|
 | |
| |
| |
| |
| |
| |
|
Gene: HIST1H2AL |
Gene summary for HIST1H2AL |
| Gene information | Species | Human | Gene symbol | HIST1H2AL | Gene ID | 8332 |
| Gene name | H2A clustered histone 16 | |
| Gene Alias | H2A.i | |
| Cytomap | 6p22.1 | |
| Gene Type | protein-coding | GO ID | GO:0008150 | UniProtAcc | A4FTV9 |
Top |
Malignant transformation analysis |
| Identification of the aberrant gene expression in precancerous and cancerous lesions by comparing the gene expression of stem-like cells in diseased tissues with normal stem cells |
| Entrez ID | Symbol | Replicates | Species | Organ | Tissue | Adj P-value | Log2FC | Malignancy |
| 8332 | HIST1H2AL | LZE7T | Human | Esophagus | ESCC | 3.90e-02 | 1.58e-01 | 0.0667 |
| 8332 | HIST1H2AL | LZE21D1 | Human | Esophagus | HGIN | 2.75e-06 | 3.94e-01 | 0.0632 |
| 8332 | HIST1H2AL | LZE22D1 | Human | Esophagus | HGIN | 5.14e-03 | 2.38e-01 | 0.0595 |
| 8332 | HIST1H2AL | LZE21T | Human | Esophagus | ESCC | 6.52e-03 | 3.22e-01 | 0.0655 |
| 8332 | HIST1H2AL | P1T-E | Human | Esophagus | ESCC | 1.23e-18 | 1.13e+00 | 0.0875 |
| 8332 | HIST1H2AL | P2T-E | Human | Esophagus | ESCC | 3.97e-04 | 1.65e-01 | 0.1177 |
| 8332 | HIST1H2AL | P4T-E | Human | Esophagus | ESCC | 2.90e-03 | 1.36e-01 | 0.1323 |
| 8332 | HIST1H2AL | P10T-E | Human | Esophagus | ESCC | 8.40e-04 | 9.78e-02 | 0.116 |
| 8332 | HIST1H2AL | P12T-E | Human | Esophagus | ESCC | 3.97e-04 | 1.54e-01 | 0.1122 |
| 8332 | HIST1H2AL | P20T-E | Human | Esophagus | ESCC | 3.97e-02 | 1.78e-01 | 0.1124 |
| 8332 | HIST1H2AL | P24T-E | Human | Esophagus | ESCC | 3.50e-02 | 8.53e-02 | 0.1287 |
| 8332 | HIST1H2AL | P27T-E | Human | Esophagus | ESCC | 4.30e-10 | 2.52e-01 | 0.1055 |
| 8332 | HIST1H2AL | P30T-E | Human | Esophagus | ESCC | 2.13e-03 | 1.75e-01 | 0.137 |
| 8332 | HIST1H2AL | P31T-E | Human | Esophagus | ESCC | 3.50e-02 | 1.13e-01 | 0.1251 |
| 8332 | HIST1H2AL | P32T-E | Human | Esophagus | ESCC | 1.66e-02 | 9.93e-02 | 0.1666 |
| 8332 | HIST1H2AL | P36T-E | Human | Esophagus | ESCC | 1.55e-04 | 1.88e-01 | 0.1187 |
| 8332 | HIST1H2AL | P39T-E | Human | Esophagus | ESCC | 7.90e-03 | 1.22e-01 | 0.0894 |
| 8332 | HIST1H2AL | P42T-E | Human | Esophagus | ESCC | 9.05e-04 | 1.43e-01 | 0.1175 |
| 8332 | HIST1H2AL | P47T-E | Human | Esophagus | ESCC | 8.84e-05 | 1.31e-01 | 0.1067 |
| 8332 | HIST1H2AL | P48T-E | Human | Esophagus | ESCC | 9.44e-07 | 1.97e-01 | 0.0959 |
| Page: 1 2 |
| Tissue | Expression Dynamics | Abbreviation |
| Esophagus | 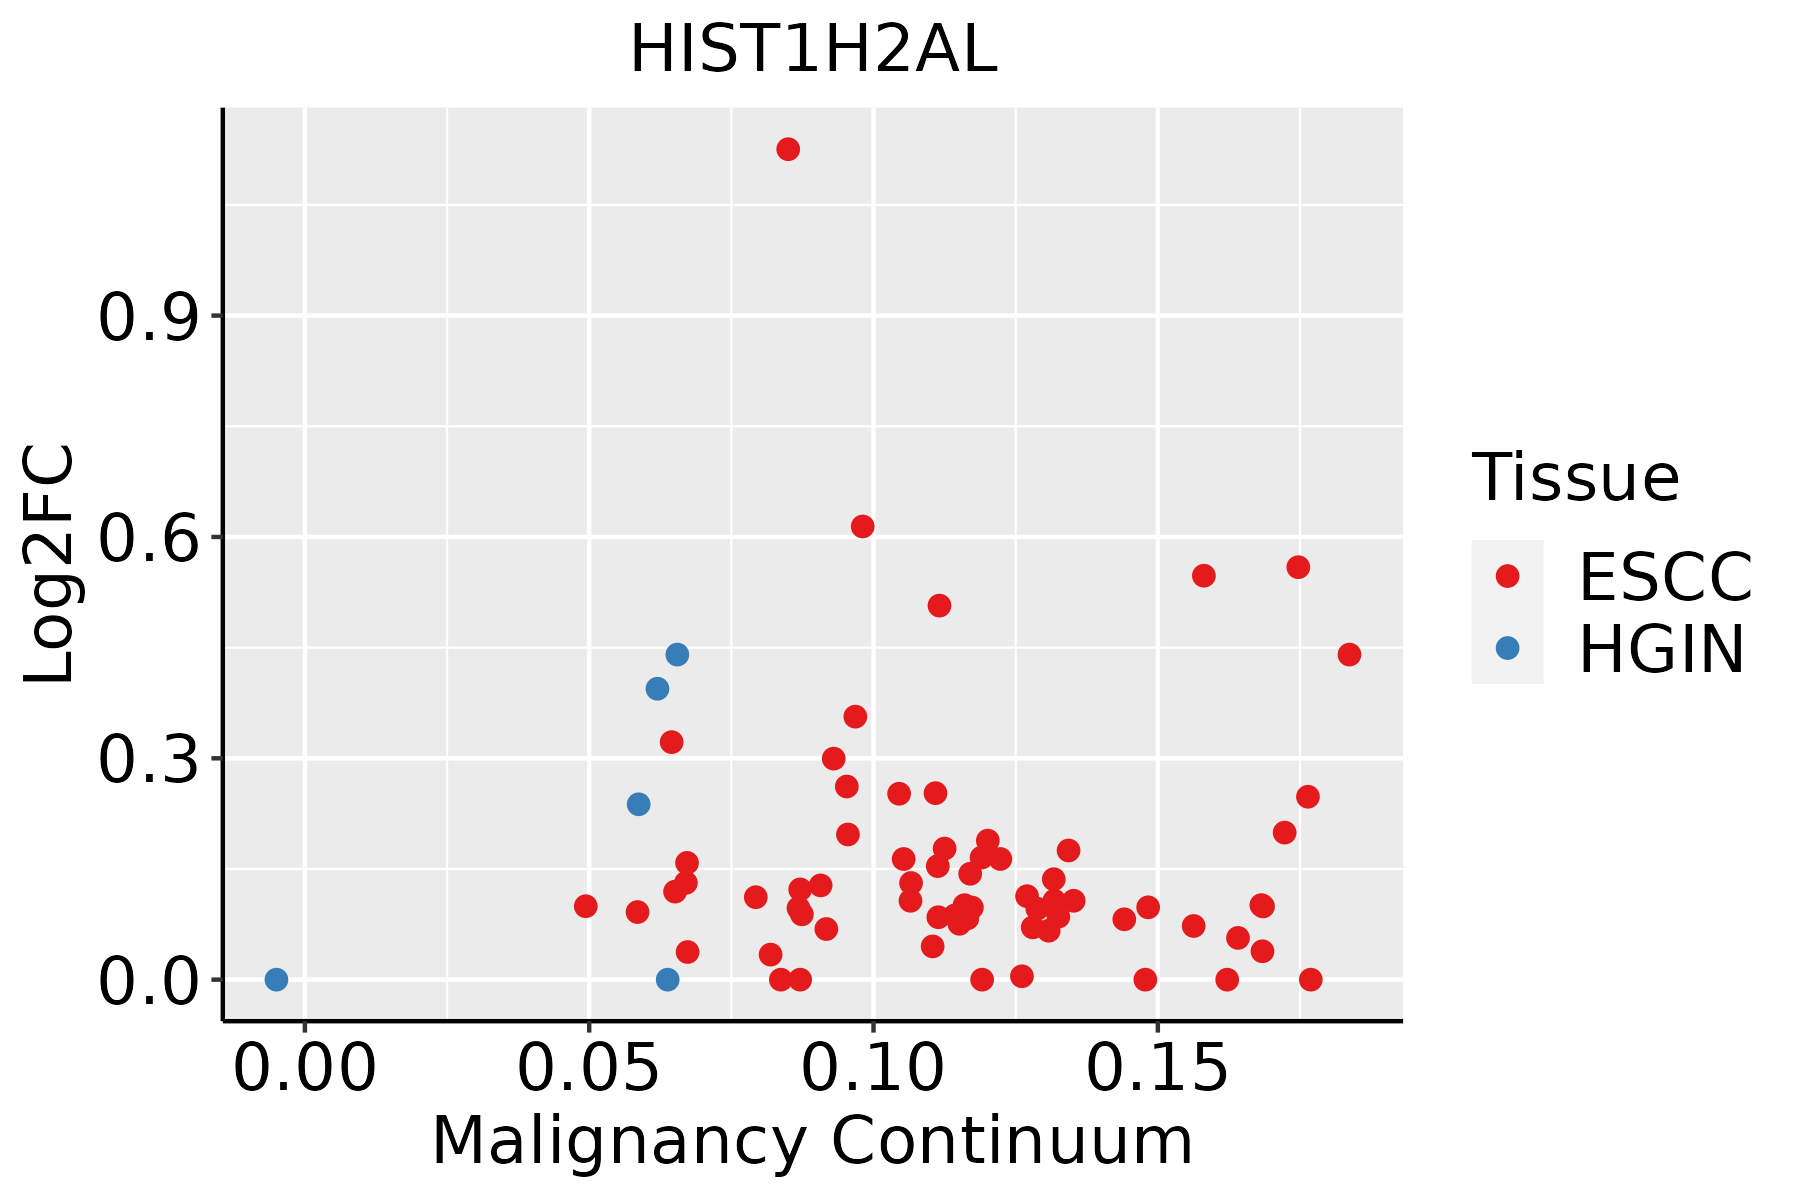 | ESCC: Esophageal squamous cell carcinoma |
| HGIN: High-grade intraepithelial neoplasias | ||
| LGIN: Low-grade intraepithelial neoplasias |
| ∗log2FC in expression of this searched gene in stem-like cells from each diseased tissue sample relative to stem-like cells in normal samples in each tissue plotted against the malignancy continuum. Samples are colored based on if they are from different disease stage. |
Top |
Malignant transformation related pathway analysis |
| Find out the enriched GO biological processes and KEGG pathways involved in transition from healthy to precancer to cancer |
| Tissue | Disease Stage | Enriched GO biological Processes |
| Colorectum | AD |  |
| Colorectum | SER |  |
| Colorectum | MSS |  |
| Colorectum | MSI-H |  |
| Colorectum | FAP |  |
| ∗Top 15 enriched GO BP terms are showed in the bar plot of each disease state in each tissue. Each row represents a significant GO biological process which is colored according to the -log10(p.adjust). |
| Page: 1 2 3 4 5 6 7 8 9 |
| GO ID | Tissue | Disease Stage | Description | Gene Ratio | Bg Ratio | pvalue | p.adjust | Count |
| Page: 1 |
| Pathway ID | Tissue | Disease Stage | Description | Gene Ratio | Bg Ratio | pvalue | p.adjust | qvalue | Count |
| Page: 1 |
Top |
Cell-cell communication analysis |
| Identification of potential cell-cell interactions between two cell types and their ligand-receptor pairs for different disease states |
| Ligand | Receptor | LRpair | Pathway | Tissue | Disease Stage |
| Page: 1 |
Top |
Single-cell gene regulatory network inference analysis |
| Find out the significant the regulons (TFs) and the target genes of each regulon across cell types for different disease states |
| TF | Cell Type | Tissue | Disease Stage | Target Gene | RSS | Regulon Activity |
| ∗The dot plots of a searched regulon are shown for all cell subpopulations in each disease state of each tissue based on the regulon specific score inferred using pySCENIC and by calculating the average expression. |
| Page: 1 |
Top |
Somatic mutation of malignant transformation related genes |
| Annotation of somatic variants for genes involved in malignant transformation |
| Hugo Symbol | Variant Class | Variant Classification | dbSNP RS | HGVSc | HGVSp | HGVSp Short | SWISSPROT | BIOTYPE | SIFT | PolyPhen | Tumor Sample Barcode | Tissue | Histology | Sex | Age | Stage | Therapy Types | Drugs | Outcome |
| HIST1H2AL | SNV | Missense_Mutation | c.228N>C | p.Lys76Asn | p.K76N | P0C0S8 | protein_coding | deleterious_low_confidence(0.01) | probably_damaging(0.989) | TCGA-A2-A04R-01 | Breast | breast invasive carcinoma | Female | <65 | I/II | Chemotherapy | taxol | SD | |
| HIST1H2AL | SNV | Missense_Mutation | c.314N>G | p.Gln105Arg | p.Q105R | P0C0S8 | protein_coding | deleterious_low_confidence(0.02) | possibly_damaging(0.821) | TCGA-A8-A09Z-01 | Breast | breast invasive carcinoma | Female | >=65 | I/II | Unknown | Unknown | SD | |
| HIST1H2AL | SNV | Missense_Mutation | c.4N>A | p.Ser2Thr | p.S2T | P0C0S8 | protein_coding | tolerated_low_confidence(0.08) | benign(0.007) | TCGA-D8-A1XQ-01 | Breast | breast invasive carcinoma | Female | >=65 | I/II | Unknown | Unknown | SD | |
| HIST1H2AL | insertion | Frame_Shift_Ins | novel | c.368_369insAAGT | p.Ser123ArgfsTer? | p.S123Rfs*? | P0C0S8 | protein_coding | TCGA-A8-A096-01 | Breast | breast invasive carcinoma | Female | >=65 | I/II | Unknown | Unknown | SD | ||
| HIST1H2AL | SNV | Missense_Mutation | c.89G>C | p.Arg30Pro | p.R30P | P0C0S8 | protein_coding | deleterious_low_confidence(0) | probably_damaging(1) | TCGA-FU-A2QG-01 | Cervix | cervical & endocervical cancer | Female | <65 | I/II | Unknown | Unknown | SD | |
| HIST1H2AL | SNV | Missense_Mutation | c.89G>C | p.Arg30Pro | p.R30P | P0C0S8 | protein_coding | deleterious_low_confidence(0) | probably_damaging(1) | TCGA-IR-A3LK-01 | Cervix | cervical & endocervical cancer | Female | >=65 | I/II | Chemotherapy | cisplatin | PD | |
| HIST1H2AL | SNV | Missense_Mutation | rs748822589 | c.10N>T | p.Arg4Cys | p.R4C | P0C0S8 | protein_coding | deleterious_low_confidence(0.01) | possibly_damaging(0.667) | TCGA-AA-3947-01 | Colorectum | colon adenocarcinoma | Female | <65 | I/II | Unknown | Unknown | SD |
| HIST1H2AL | SNV | Missense_Mutation | c.328N>T | p.Pro110Ser | p.P110S | P0C0S8 | protein_coding | deleterious_low_confidence(0) | benign(0.248) | TCGA-G4-6302-01 | Colorectum | colon adenocarcinoma | Female | >=65 | I/II | Unknown | Unknown | SD | |
| HIST1H2AL | SNV | Missense_Mutation | novel | c.279N>T | p.Glu93Asp | p.E93D | P0C0S8 | protein_coding | deleterious_low_confidence(0.01) | probably_damaging(0.998) | TCGA-A5-A0G2-01 | Endometrium | uterine corpus endometrioid carcinoma | Female | <65 | III/IV | Unknown | Unknown | SD |
| HIST1H2AL | SNV | Missense_Mutation | novel | c.182N>T | p.Ala61Val | p.A61V | P0C0S8 | protein_coding | deleterious_low_confidence(0.01) | possibly_damaging(0.505) | TCGA-AX-A1C4-01 | Endometrium | uterine corpus endometrioid carcinoma | Female | <65 | I/II | Unknown | Unknown | SD |
| Page: 1 2 3 |
Top |
Related drugs of malignant transformation related genes |
| Identification of chemicals and drugs interact with genes involved in malignant transfromation |
| (DGIdb 4.0) |
| Entrez ID | Symbol | Category | Interaction Types | Drug Claim Name | Drug Name | PMIDs |
| Page: 1 |

Copyright 2023-Present -The University of Texas Health Science Center at Houston |