
|
|||||
|
 | |
| |
| |
| |
| |
| |
|
Gene: HIST1H2AJ |
Gene summary for HIST1H2AJ |
| Gene information | Species | Human | Gene symbol | HIST1H2AJ | Gene ID | 8331 |
| Gene name | H2A clustered histone 14 | |
| Gene Alias | H2A/E | |
| Cytomap | 6p22.1 | |
| Gene Type | protein-coding | GO ID | NA | UniProtAcc | Q99878 |
Top |
Malignant transformation analysis |
| Identification of the aberrant gene expression in precancerous and cancerous lesions by comparing the gene expression of stem-like cells in diseased tissues with normal stem cells |
| Entrez ID | Symbol | Replicates | Species | Organ | Tissue | Adj P-value | Log2FC | Malignancy |
| 8331 | HIST1H2AJ | LZE21D1 | Human | Esophagus | HGIN | 5.38e-03 | 2.63e-01 | 0.0632 |
| 8331 | HIST1H2AJ | LZE21T | Human | Esophagus | ESCC | 9.73e-05 | 4.69e-01 | 0.0655 |
| 8331 | HIST1H2AJ | LZE6T | Human | Esophagus | ESCC | 1.62e-02 | 3.40e-01 | 0.0845 |
| 8331 | HIST1H2AJ | P1T-E | Human | Esophagus | ESCC | 1.45e-10 | 8.62e-01 | 0.0875 |
| 8331 | HIST1H2AJ | P4T-E | Human | Esophagus | ESCC | 3.78e-04 | 1.50e-01 | 0.1323 |
| 8331 | HIST1H2AJ | P5T-E | Human | Esophagus | ESCC | 1.78e-03 | 1.43e-01 | 0.1327 |
| 8331 | HIST1H2AJ | P10T-E | Human | Esophagus | ESCC | 3.75e-03 | 1.42e-01 | 0.116 |
| 8331 | HIST1H2AJ | P12T-E | Human | Esophagus | ESCC | 8.84e-05 | 1.50e-01 | 0.1122 |
| 8331 | HIST1H2AJ | P20T-E | Human | Esophagus | ESCC | 5.73e-03 | 1.53e-01 | 0.1124 |
| 8331 | HIST1H2AJ | P22T-E | Human | Esophagus | ESCC | 3.75e-03 | 1.65e-01 | 0.1236 |
| 8331 | HIST1H2AJ | P24T-E | Human | Esophagus | ESCC | 1.66e-02 | 1.33e-01 | 0.1287 |
| 8331 | HIST1H2AJ | P27T-E | Human | Esophagus | ESCC | 9.20e-06 | 1.70e-01 | 0.1055 |
| 8331 | HIST1H2AJ | P31T-E | Human | Esophagus | ESCC | 3.75e-03 | 1.72e-01 | 0.1251 |
| 8331 | HIST1H2AJ | P36T-E | Human | Esophagus | ESCC | 2.82e-02 | 1.28e-01 | 0.1187 |
| 8331 | HIST1H2AJ | P37T-E | Human | Esophagus | ESCC | 2.88e-04 | 1.64e-01 | 0.1371 |
| 8331 | HIST1H2AJ | P48T-E | Human | Esophagus | ESCC | 1.66e-02 | 1.21e-01 | 0.0959 |
| 8331 | HIST1H2AJ | P52T-E | Human | Esophagus | ESCC | 7.52e-23 | 6.00e-01 | 0.1555 |
| 8331 | HIST1H2AJ | P54T-E | Human | Esophagus | ESCC | 9.07e-08 | 2.68e-01 | 0.0975 |
| 8331 | HIST1H2AJ | P61T-E | Human | Esophagus | ESCC | 3.64e-10 | 4.29e-01 | 0.099 |
| 8331 | HIST1H2AJ | P62T-E | Human | Esophagus | ESCC | 2.57e-02 | 1.42e-01 | 0.1302 |
| Page: 1 2 |
| Tissue | Expression Dynamics | Abbreviation |
| Esophagus | 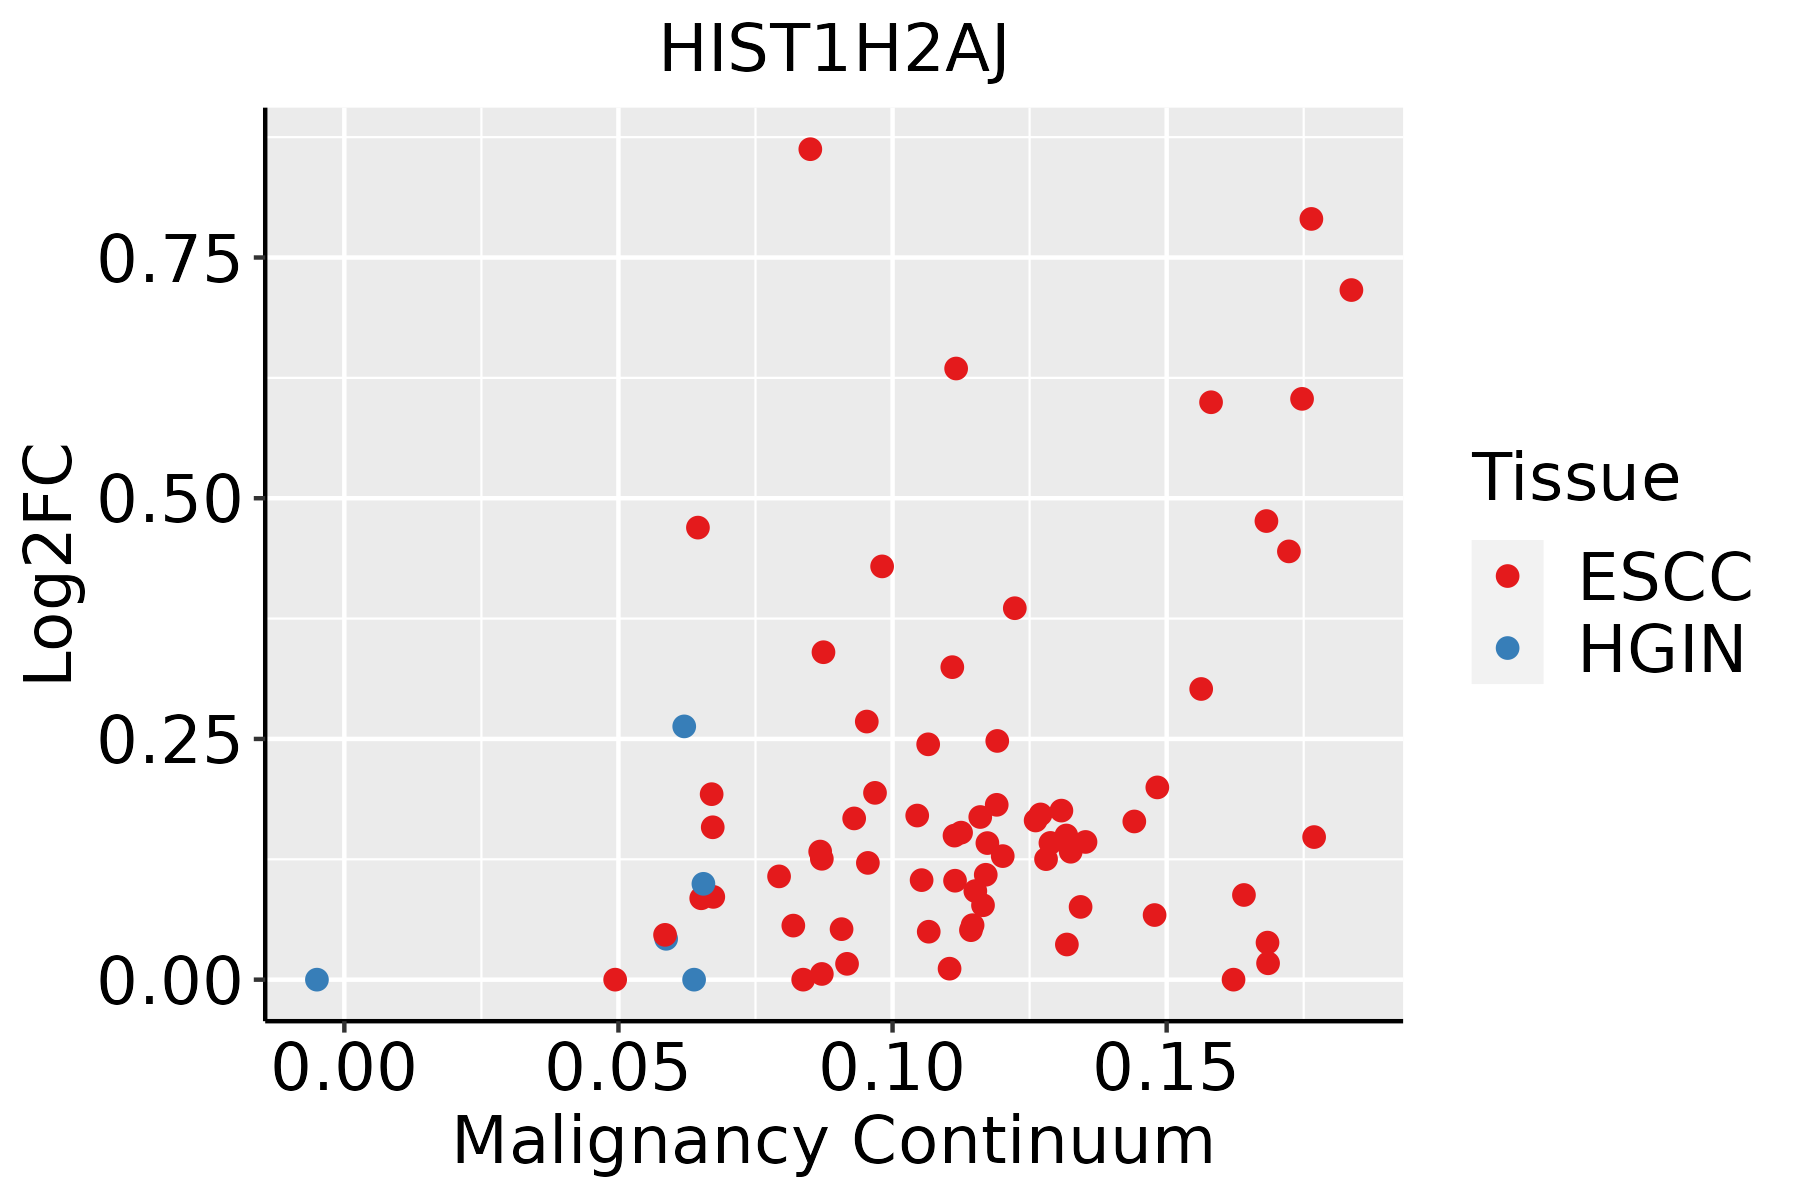 | ESCC: Esophageal squamous cell carcinoma |
| HGIN: High-grade intraepithelial neoplasias | ||
| LGIN: Low-grade intraepithelial neoplasias |
| ∗log2FC in expression of this searched gene in stem-like cells from each diseased tissue sample relative to stem-like cells in normal samples in each tissue plotted against the malignancy continuum. Samples are colored based on if they are from different disease stage. |
Top |
Malignant transformation related pathway analysis |
| Find out the enriched GO biological processes and KEGG pathways involved in transition from healthy to precancer to cancer |
| Tissue | Disease Stage | Enriched GO biological Processes |
| Colorectum | AD |  |
| Colorectum | SER |  |
| Colorectum | MSS |  |
| Colorectum | MSI-H |  |
| Colorectum | FAP |  |
| ∗Top 15 enriched GO BP terms are showed in the bar plot of each disease state in each tissue. Each row represents a significant GO biological process which is colored according to the -log10(p.adjust). |
| Page: 1 2 3 4 5 6 7 8 9 |
| GO ID | Tissue | Disease Stage | Description | Gene Ratio | Bg Ratio | pvalue | p.adjust | Count |
| Page: 1 |
| Pathway ID | Tissue | Disease Stage | Description | Gene Ratio | Bg Ratio | pvalue | p.adjust | qvalue | Count |
| Page: 1 |
Top |
Cell-cell communication analysis |
| Identification of potential cell-cell interactions between two cell types and their ligand-receptor pairs for different disease states |
| Ligand | Receptor | LRpair | Pathway | Tissue | Disease Stage |
| Page: 1 |
Top |
Single-cell gene regulatory network inference analysis |
| Find out the significant the regulons (TFs) and the target genes of each regulon across cell types for different disease states |
| TF | Cell Type | Tissue | Disease Stage | Target Gene | RSS | Regulon Activity |
| ∗The dot plots of a searched regulon are shown for all cell subpopulations in each disease state of each tissue based on the regulon specific score inferred using pySCENIC and by calculating the average expression. |
| Page: 1 |
Top |
Somatic mutation of malignant transformation related genes |
| Annotation of somatic variants for genes involved in malignant transformation |
| Hugo Symbol | Variant Class | Variant Classification | dbSNP RS | HGVSc | HGVSp | HGVSp Short | SWISSPROT | BIOTYPE | SIFT | PolyPhen | Tumor Sample Barcode | Tissue | Histology | Sex | Age | Stage | Therapy Types | Drugs | Outcome |
| HIST1H2AJ | SNV | Missense_Mutation | c.271G>T | p.Asp91Tyr | p.D91Y | Q99878 | protein_coding | deleterious_low_confidence(0) | probably_damaging(1) | TCGA-AC-A8OP-01 | Breast | breast invasive carcinoma | Female | >=65 | I/II | Unknown | Unknown | SD | |
| HIST1H2AJ | SNV | Missense_Mutation | novel | c.170N>G | p.Glu57Gly | p.E57G | Q99878 | protein_coding | deleterious_low_confidence(0.01) | probably_damaging(1) | TCGA-AO-A128-01 | Breast | breast invasive carcinoma | Female | <65 | I/II | Chemotherapy | doxorubicin | SD |
| HIST1H2AJ | SNV | Missense_Mutation | c.366N>C | p.Glu122Asp | p.E122D | Q99878 | protein_coding | tolerated_low_confidence(0.15) | benign(0) | TCGA-HM-A4S6-01 | Cervix | cervical & endocervical cancer | Female | <65 | III/IV | Chemotherapy | cisplatin | CR | |
| HIST1H2AJ | SNV | Missense_Mutation | c.332N>G | p.Asn111Ser | p.N111S | Q99878 | protein_coding | deleterious_low_confidence(0.03) | benign(0.23) | TCGA-AA-3715-01 | Colorectum | colon adenocarcinoma | Male | >=65 | I/II | Unknown | Unknown | PD | |
| HIST1H2AJ | SNV | Missense_Mutation | c.193N>C | p.Glu65Gln | p.E65Q | Q99878 | protein_coding | deleterious_low_confidence(0.04) | probably_damaging(0.999) | TCGA-DM-A1D9-01 | Colorectum | colon adenocarcinoma | Female | >=65 | I/II | Unknown | Unknown | SD | |
| HIST1H2AJ | deletion | Frame_Shift_Del | rs761152407 | Q99878 | protein_coding | TCGA-AA-3710-01 | Colorectum | colon adenocarcinoma | Female | >=65 | I/II | Unknown | Unknown | SD | |||||
| HIST1H2AJ | SNV | Missense_Mutation | novel | c.328C>T | p.Pro110Ser | p.P110S | Q99878 | protein_coding | deleterious_low_confidence(0) | benign(0.123) | TCGA-AP-A1DV-01 | Endometrium | uterine corpus endometrioid carcinoma | Female | <65 | I/II | Unknown | Unknown | SD |
| HIST1H2AJ | SNV | Missense_Mutation | c.5C>A | p.Ser2Tyr | p.S2Y | Q99878 | protein_coding | deleterious_low_confidence(0) | possibly_damaging(0.831) | TCGA-AX-A2HC-01 | Endometrium | uterine corpus endometrioid carcinoma | Female | <65 | III/IV | Chemotherapy | paclitaxel | PD | |
| HIST1H2AJ | SNV | Missense_Mutation | novel | c.146N>T | p.Pro49Leu | p.P49L | Q99878 | protein_coding | deleterious_low_confidence(0.04) | probably_damaging(0.99) | TCGA-AX-A2HD-01 | Endometrium | uterine corpus endometrioid carcinoma | Female | >=65 | III/IV | Unknown | Unknown | SD |
| HIST1H2AJ | SNV | Missense_Mutation | rs755420196 | c.239N>C | p.Ile80Thr | p.I80T | Q99878 | protein_coding | tolerated_low_confidence(0.08) | benign(0.045) | TCGA-B5-A3FC-01 | Endometrium | uterine corpus endometrioid carcinoma | Female | <65 | I/II | Unknown | Unknown | SD |
| Page: 1 2 3 |
Top |
Related drugs of malignant transformation related genes |
| Identification of chemicals and drugs interact with genes involved in malignant transfromation |
| (DGIdb 4.0) |
| Entrez ID | Symbol | Category | Interaction Types | Drug Claim Name | Drug Name | PMIDs |
| Page: 1 |

Copyright 2023-Present -The University of Texas Health Science Center at Houston |