
|
|||||
|
 | |
| |
| |
| |
| |
| |
|
Gene: HIST1H1E |
Gene summary for HIST1H1E |
| Gene information | Species | Human | Gene symbol | HIST1H1E | Gene ID | 3008 |
| Gene name | H1.4 linker histone, cluster member | |
| Gene Alias | H1.4 | |
| Cytomap | 6p22.2 | |
| Gene Type | protein-coding | GO ID | GO:0000018 | UniProtAcc | A3R0T8 |
Top |
Malignant transformation analysis |
| Identification of the aberrant gene expression in precancerous and cancerous lesions by comparing the gene expression of stem-like cells in diseased tissues with normal stem cells |
| Entrez ID | Symbol | Replicates | Species | Organ | Tissue | Adj P-value | Log2FC | Malignancy |
| 3008 | HIST1H1E | LZE2D | Human | Esophagus | HGIN | 1.57e-04 | 8.85e-01 | 0.0642 |
| 3008 | HIST1H1E | LZE2T | Human | Esophagus | ESCC | 3.94e-07 | 7.75e-01 | 0.082 |
| 3008 | HIST1H1E | LZE4T | Human | Esophagus | ESCC | 2.64e-35 | 1.33e+00 | 0.0811 |
| 3008 | HIST1H1E | LZE5T | Human | Esophagus | ESCC | 1.00e-09 | 6.71e-01 | 0.0514 |
| 3008 | HIST1H1E | LZE7T | Human | Esophagus | ESCC | 2.68e-16 | 9.55e-01 | 0.0667 |
| 3008 | HIST1H1E | LZE8T | Human | Esophagus | ESCC | 4.41e-02 | 1.30e-01 | 0.067 |
| 3008 | HIST1H1E | LZE20T | Human | Esophagus | ESCC | 9.98e-09 | 2.69e-01 | 0.0662 |
| 3008 | HIST1H1E | LZE21D1 | Human | Esophagus | HGIN | 4.76e-12 | 9.34e-01 | 0.0632 |
| 3008 | HIST1H1E | LZE22D1 | Human | Esophagus | HGIN | 1.32e-09 | 3.24e-01 | 0.0595 |
| 3008 | HIST1H1E | LZE22T | Human | Esophagus | ESCC | 1.40e-06 | 4.38e-01 | 0.068 |
| 3008 | HIST1H1E | LZE24T | Human | Esophagus | ESCC | 3.57e-26 | 5.96e-01 | 0.0596 |
| 3008 | HIST1H1E | LZE21T | Human | Esophagus | ESCC | 2.35e-12 | 8.52e-01 | 0.0655 |
| 3008 | HIST1H1E | LZE6T | Human | Esophagus | ESCC | 4.35e-10 | 8.44e-01 | 0.0845 |
| 3008 | HIST1H1E | P1T-E | Human | Esophagus | ESCC | 8.60e-33 | 1.52e+00 | 0.0875 |
| 3008 | HIST1H1E | P2T-E | Human | Esophagus | ESCC | 9.14e-50 | 1.22e+00 | 0.1177 |
| 3008 | HIST1H1E | P4T-E | Human | Esophagus | ESCC | 2.73e-41 | 9.08e-01 | 0.1323 |
| 3008 | HIST1H1E | P5T-E | Human | Esophagus | ESCC | 4.16e-22 | 5.45e-01 | 0.1327 |
| 3008 | HIST1H1E | P8T-E | Human | Esophagus | ESCC | 4.30e-10 | 2.91e-01 | 0.0889 |
| 3008 | HIST1H1E | P9T-E | Human | Esophagus | ESCC | 1.09e-13 | 4.22e-01 | 0.1131 |
| 3008 | HIST1H1E | P10T-E | Human | Esophagus | ESCC | 8.08e-19 | 4.49e-01 | 0.116 |
| Page: 1 2 3 4 5 |
| Tissue | Expression Dynamics | Abbreviation |
| Esophagus | 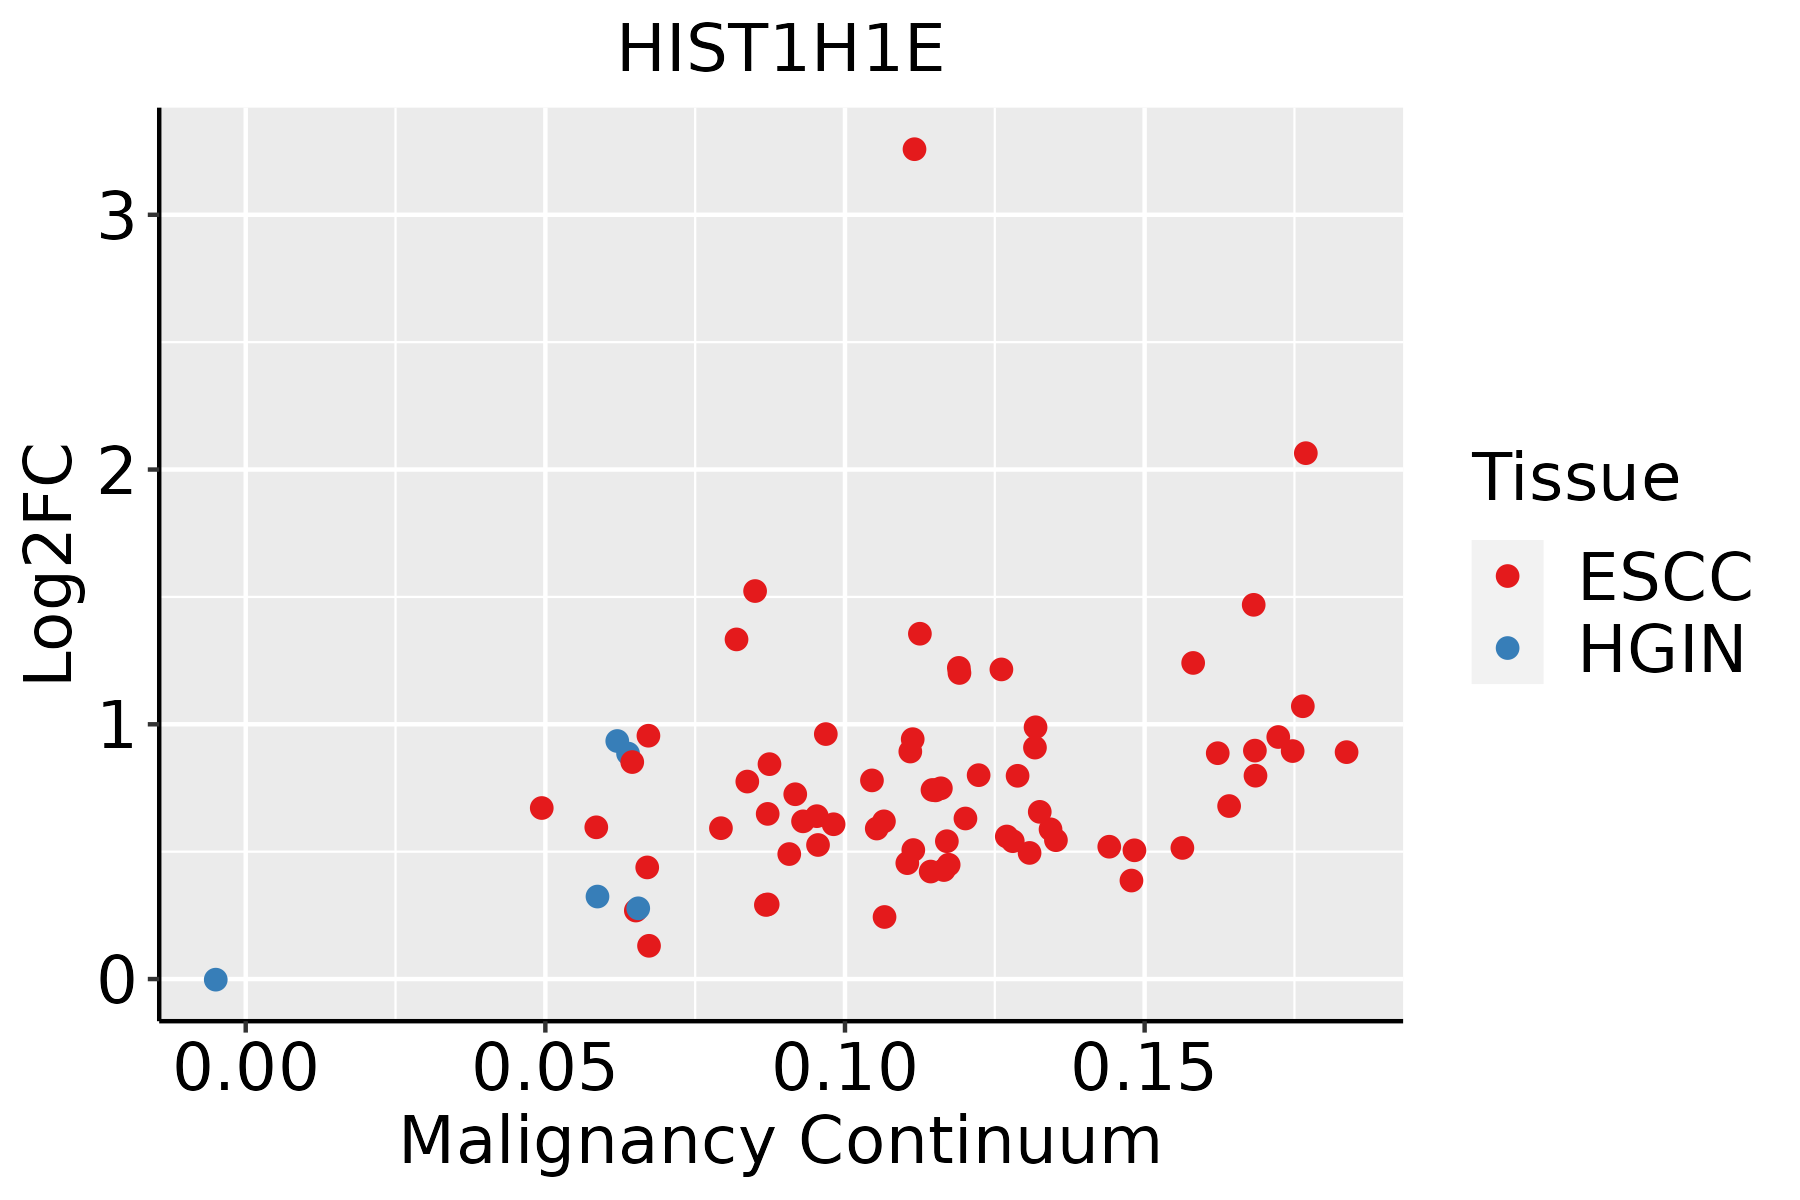 | ESCC: Esophageal squamous cell carcinoma |
| HGIN: High-grade intraepithelial neoplasias | ||
| LGIN: Low-grade intraepithelial neoplasias | ||
| Liver | 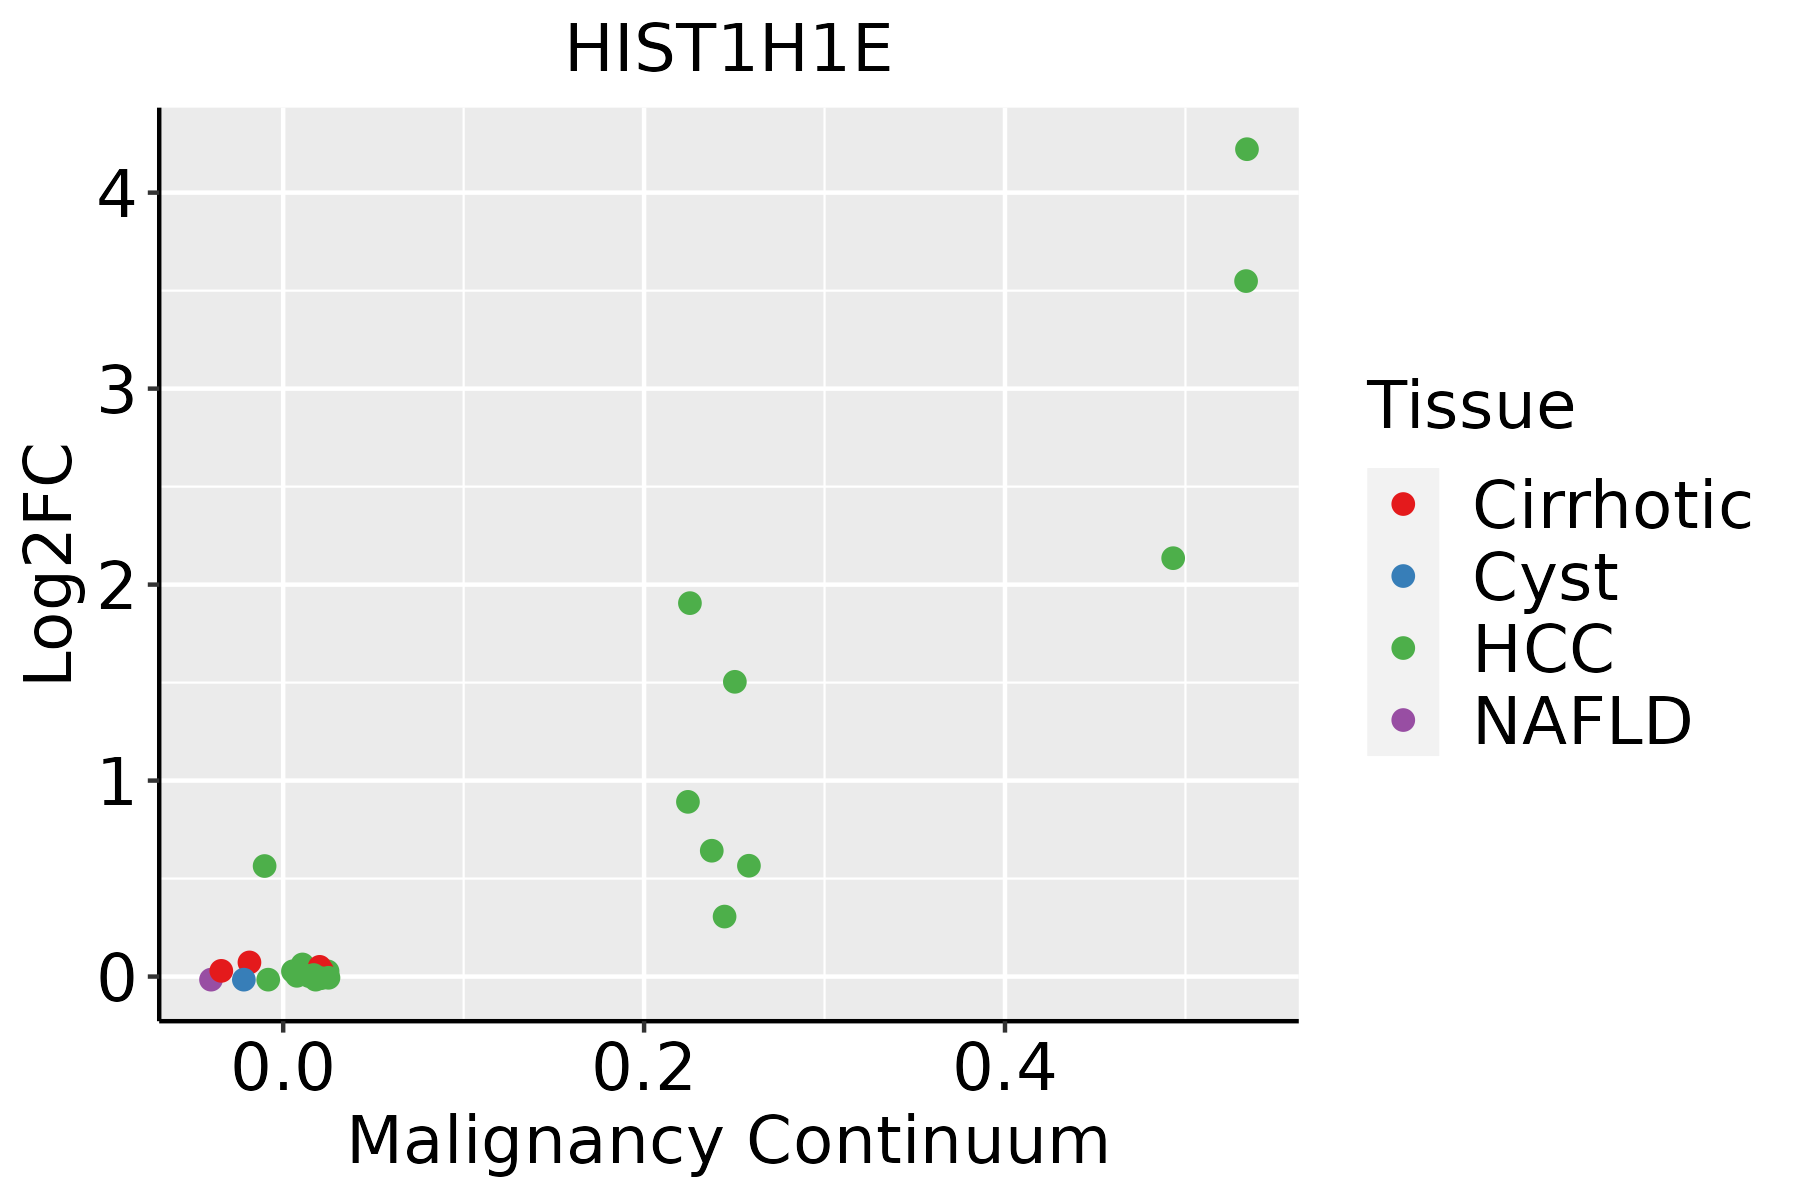 | HCC: Hepatocellular carcinoma |
| NAFLD: Non-alcoholic fatty liver disease | ||
| Oral Cavity |  | EOLP: Erosive Oral lichen planus |
| LP: leukoplakia | ||
| NEOLP: Non-erosive oral lichen planus | ||
| OSCC: Oral squamous cell carcinoma | ||
| Skin | 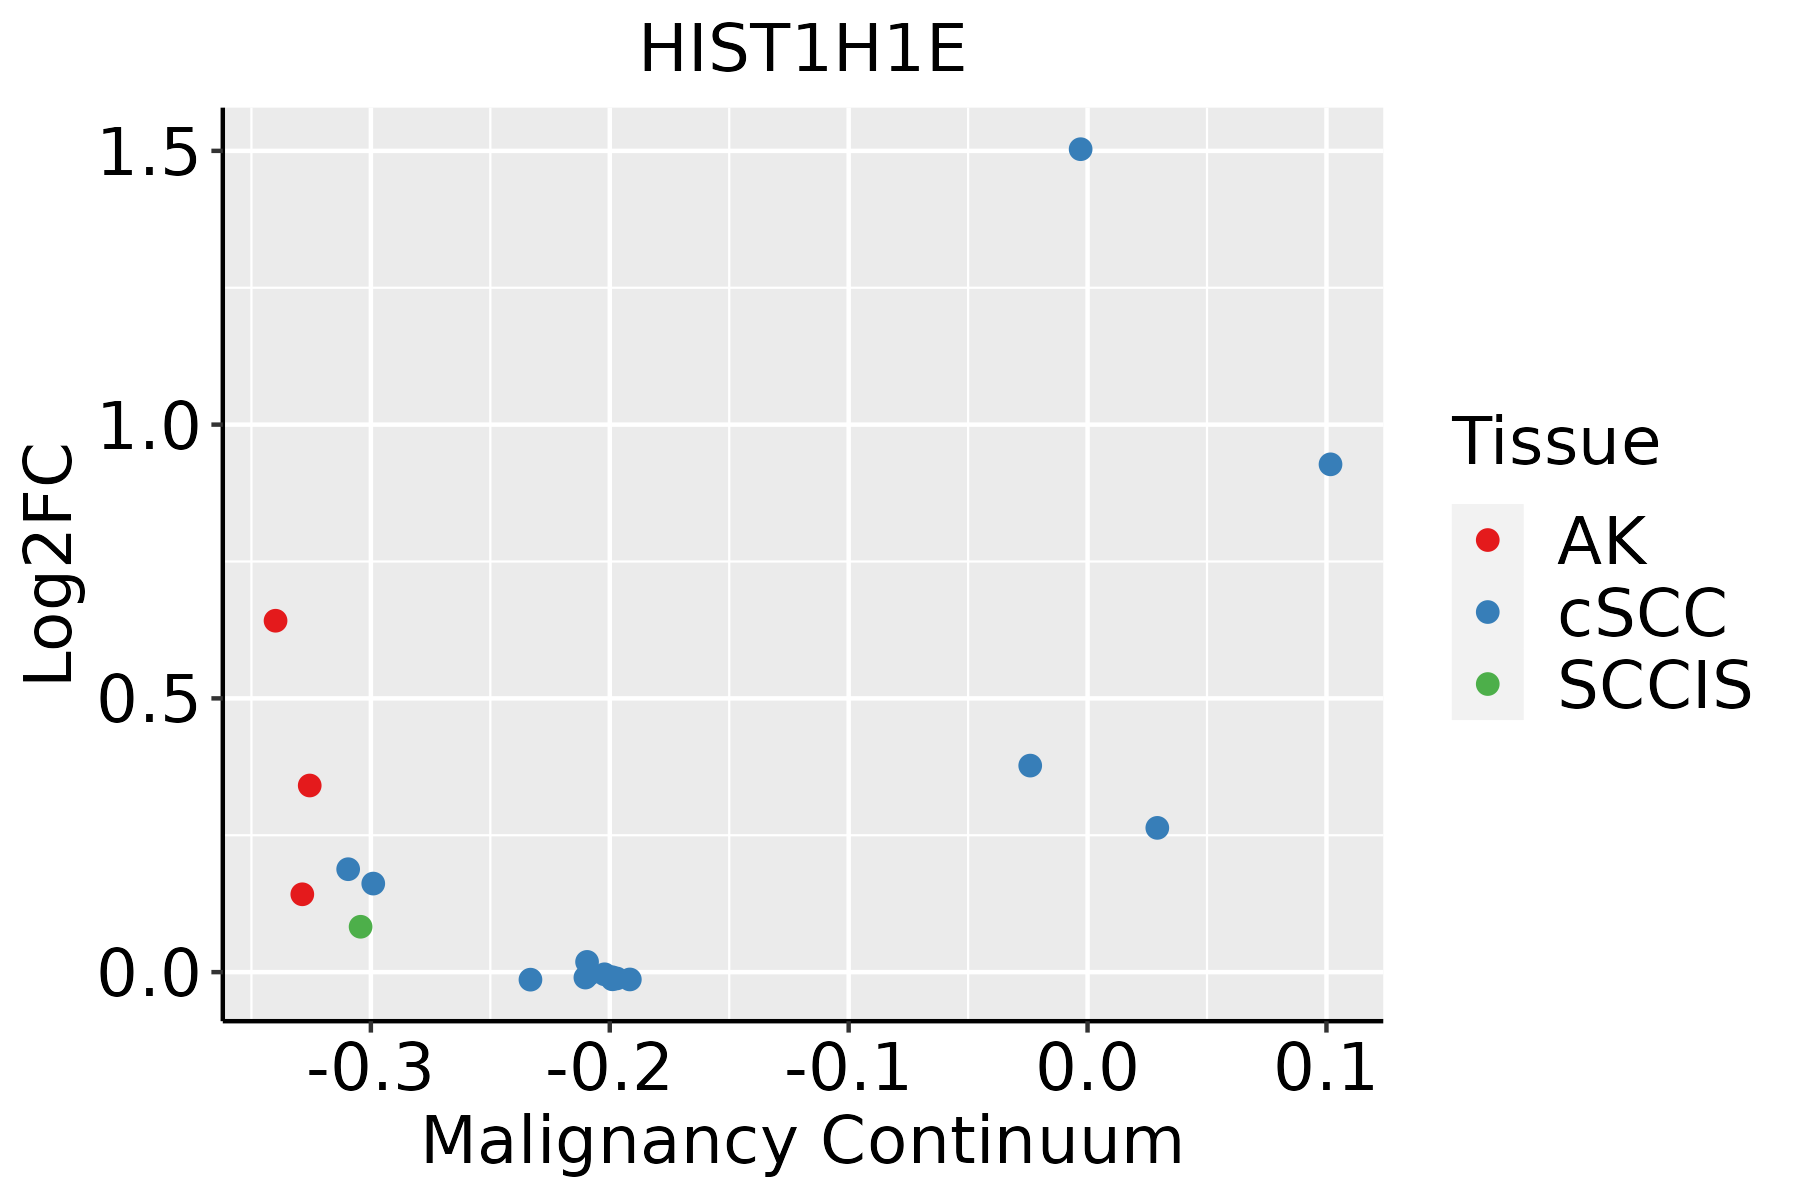 | AK: Actinic keratosis |
| cSCC: Cutaneous squamous cell carcinoma | ||
| SCCIS:squamous cell carcinoma in situ |
| ∗log2FC in expression of this searched gene in stem-like cells from each diseased tissue sample relative to stem-like cells in normal samples in each tissue plotted against the malignancy continuum. Samples are colored based on if they are from different disease stage. |
Top |
Malignant transformation related pathway analysis |
| Find out the enriched GO biological processes and KEGG pathways involved in transition from healthy to precancer to cancer |
| Tissue | Disease Stage | Enriched GO biological Processes |
| Colorectum | AD |  |
| Colorectum | SER |  |
| Colorectum | MSS |  |
| Colorectum | MSI-H |  |
| Colorectum | FAP |  |
| ∗Top 15 enriched GO BP terms are showed in the bar plot of each disease state in each tissue. Each row represents a significant GO biological process which is colored according to the -log10(p.adjust). |
| Page: 1 2 3 4 5 6 7 8 9 |
| GO ID | Tissue | Disease Stage | Description | Gene Ratio | Bg Ratio | pvalue | p.adjust | Count |
| Page: 1 |
| Pathway ID | Tissue | Disease Stage | Description | Gene Ratio | Bg Ratio | pvalue | p.adjust | qvalue | Count |
| Page: 1 |
Top |
Cell-cell communication analysis |
| Identification of potential cell-cell interactions between two cell types and their ligand-receptor pairs for different disease states |
| Ligand | Receptor | LRpair | Pathway | Tissue | Disease Stage |
| Page: 1 |
Top |
Single-cell gene regulatory network inference analysis |
| Find out the significant the regulons (TFs) and the target genes of each regulon across cell types for different disease states |
| TF | Cell Type | Tissue | Disease Stage | Target Gene | RSS | Regulon Activity |
| ∗The dot plots of a searched regulon are shown for all cell subpopulations in each disease state of each tissue based on the regulon specific score inferred using pySCENIC and by calculating the average expression. |
| Page: 1 |
Top |
Somatic mutation of malignant transformation related genes |
| Annotation of somatic variants for genes involved in malignant transformation |
| Hugo Symbol | Variant Class | Variant Classification | dbSNP RS | HGVSc | HGVSp | HGVSp Short | SWISSPROT | BIOTYPE | SIFT | PolyPhen | Tumor Sample Barcode | Tissue | Histology | Sex | Age | Stage | Therapy Types | Drugs | Outcome |
| HIST1H1E | SNV | Missense_Mutation | novel | c.267C>G | p.Ser89Arg | p.S89R | P10412 | protein_coding | deleterious(0) | possibly_damaging(0.811) | TCGA-A2-A4S3-01 | Breast | breast invasive carcinoma | Female | <65 | I/II | Unknown | Unknown | SD |
| HIST1H1E | SNV | Missense_Mutation | rs768767088 | c.182N>T | p.Ala61Val | p.A61V | P10412 | protein_coding | deleterious(0) | possibly_damaging(0.888) | TCGA-BH-A0BP-01 | Breast | breast invasive carcinoma | Female | >=65 | I/II | Unknown | Unknown | SD |
| HIST1H1E | deletion | In_Frame_Del | novel | c.631_651delCCAAAGAAGGCGGCAGCCAAG | p.Pro211_Lys217del | p.P211_K217del | P10412 | protein_coding | TCGA-AC-A3HN-01 | Breast | breast invasive carcinoma | Female | >=65 | I/II | Unknown | Unknown | SD | ||
| HIST1H1E | insertion | In_Frame_Ins | novel | c.21_22insTTTTTA | p.Ala7_Ala8insPheLeu | p.A7_A8insFL | P10412 | protein_coding | TCGA-BH-A0H7-01 | Breast | breast invasive carcinoma | Female | >=65 | III/IV | Chemotherapy | doxorubicin | SD | ||
| HIST1H1E | SNV | Missense_Mutation | rs766257287 | c.305C>T | p.Ser102Leu | p.S102L | P10412 | protein_coding | deleterious(0) | possibly_damaging(0.894) | TCGA-C5-A1BL-01 | Cervix | cervical & endocervical cancer | Female | <65 | I/II | Unknown | Unknown | SD |
| HIST1H1E | SNV | Missense_Mutation | c.124N>C | p.Glu42Gln | p.E42Q | P10412 | protein_coding | deleterious(0.05) | possibly_damaging(0.714) | TCGA-EK-A3GK-01 | Cervix | cervical & endocervical cancer | Female | <65 | I/II | Unknown | Unknown | SD | |
| HIST1H1E | SNV | Missense_Mutation | c.16N>A | p.Pro6Thr | p.P6T | P10412 | protein_coding | deleterious(0.03) | possibly_damaging(0.538) | TCGA-A6-2686-01 | Colorectum | colon adenocarcinoma | Female | >=65 | I/II | Unknown | Unknown | SD | |
| HIST1H1E | SNV | Missense_Mutation | c.586N>G | p.Pro196Ala | p.P196A | P10412 | protein_coding | tolerated(0.39) | probably_damaging(0.986) | TCGA-CA-6717-01 | Colorectum | colon adenocarcinoma | Male | <65 | I/II | Chemotherapy | oxaliplatin | CR | |
| HIST1H1E | SNV | Missense_Mutation | c.569N>G | p.Lys190Arg | p.K190R | P10412 | protein_coding | deleterious(0.01) | probably_damaging(0.968) | TCGA-CM-5861-01 | Colorectum | colon adenocarcinoma | Female | <65 | I/II | Unknown | Unknown | PD | |
| HIST1H1E | SNV | Missense_Mutation | c.532G>A | p.Ala178Thr | p.A178T | P10412 | protein_coding | tolerated(0.24) | benign(0.269) | TCGA-G4-6628-01 | Colorectum | colon adenocarcinoma | Male | >=65 | I/II | Unknown | Unknown | SD |
| Page: 1 2 3 4 5 |
Top |
Related drugs of malignant transformation related genes |
| Identification of chemicals and drugs interact with genes involved in malignant transfromation |
| (DGIdb 4.0) |
| Entrez ID | Symbol | Category | Interaction Types | Drug Claim Name | Drug Name | PMIDs |
| Page: 1 |

Copyright 2023-Present -The University of Texas Health Science Center at Houston |