
|
|||||
|
 | |
| |
| |
| |
| |
| |
|
Gene: HIST1H1D |
Gene summary for HIST1H1D |
| Gene information | Species | Human | Gene symbol | HIST1H1D | Gene ID | 3007 |
| Gene name | H1.3 linker histone, cluster member | |
| Gene Alias | H1.3 | |
| Cytomap | 6p22.2 | |
| Gene Type | protein-coding | GO ID | GO:0000018 | UniProtAcc | P16402 |
Top |
Malignant transformation analysis |
| Identification of the aberrant gene expression in precancerous and cancerous lesions by comparing the gene expression of stem-like cells in diseased tissues with normal stem cells |
| Entrez ID | Symbol | Replicates | Species | Organ | Tissue | Adj P-value | Log2FC | Malignancy |
| 3007 | HIST1H1D | LZE4T | Human | Esophagus | ESCC | 4.53e-04 | 2.22e-01 | 0.0811 |
| 3007 | HIST1H1D | LZE5T | Human | Esophagus | ESCC | 1.57e-03 | 2.80e-01 | 0.0514 |
| 3007 | HIST1H1D | LZE8T | Human | Esophagus | ESCC | 1.10e-02 | 1.67e-01 | 0.067 |
| 3007 | HIST1H1D | LZE24T | Human | Esophagus | ESCC | 3.17e-06 | 1.85e-01 | 0.0596 |
| 3007 | HIST1H1D | LZE21T | Human | Esophagus | ESCC | 1.97e-09 | 5.66e-01 | 0.0655 |
| 3007 | HIST1H1D | P1T-E | Human | Esophagus | ESCC | 8.60e-33 | 1.57e+00 | 0.0875 |
| 3007 | HIST1H1D | P2T-E | Human | Esophagus | ESCC | 5.68e-24 | 9.22e-01 | 0.1177 |
| 3007 | HIST1H1D | P4T-E | Human | Esophagus | ESCC | 4.35e-18 | 4.54e-01 | 0.1323 |
| 3007 | HIST1H1D | P5T-E | Human | Esophagus | ESCC | 4.31e-06 | 2.76e-01 | 0.1327 |
| 3007 | HIST1H1D | P8T-E | Human | Esophagus | ESCC | 3.75e-03 | 1.13e-01 | 0.0889 |
| 3007 | HIST1H1D | P10T-E | Human | Esophagus | ESCC | 9.67e-18 | 3.83e-01 | 0.116 |
| 3007 | HIST1H1D | P12T-E | Human | Esophagus | ESCC | 2.13e-27 | 5.75e-01 | 0.1122 |
| 3007 | HIST1H1D | P15T-E | Human | Esophagus | ESCC | 5.83e-12 | 3.10e-01 | 0.1149 |
| 3007 | HIST1H1D | P16T-E | Human | Esophagus | ESCC | 1.62e-13 | 3.15e-01 | 0.1153 |
| 3007 | HIST1H1D | P20T-E | Human | Esophagus | ESCC | 2.72e-14 | 5.28e-01 | 0.1124 |
| 3007 | HIST1H1D | P21T-E | Human | Esophagus | ESCC | 1.96e-05 | 1.78e-01 | 0.1617 |
| 3007 | HIST1H1D | P22T-E | Human | Esophagus | ESCC | 6.56e-15 | 5.01e-01 | 0.1236 |
| 3007 | HIST1H1D | P23T-E | Human | Esophagus | ESCC | 4.97e-06 | 3.04e-01 | 0.108 |
| 3007 | HIST1H1D | P24T-E | Human | Esophagus | ESCC | 4.40e-09 | 2.01e-01 | 0.1287 |
| 3007 | HIST1H1D | P26T-E | Human | Esophagus | ESCC | 4.40e-09 | 2.56e-01 | 0.1276 |
| Page: 1 2 3 4 |
| Tissue | Expression Dynamics | Abbreviation |
| Esophagus | 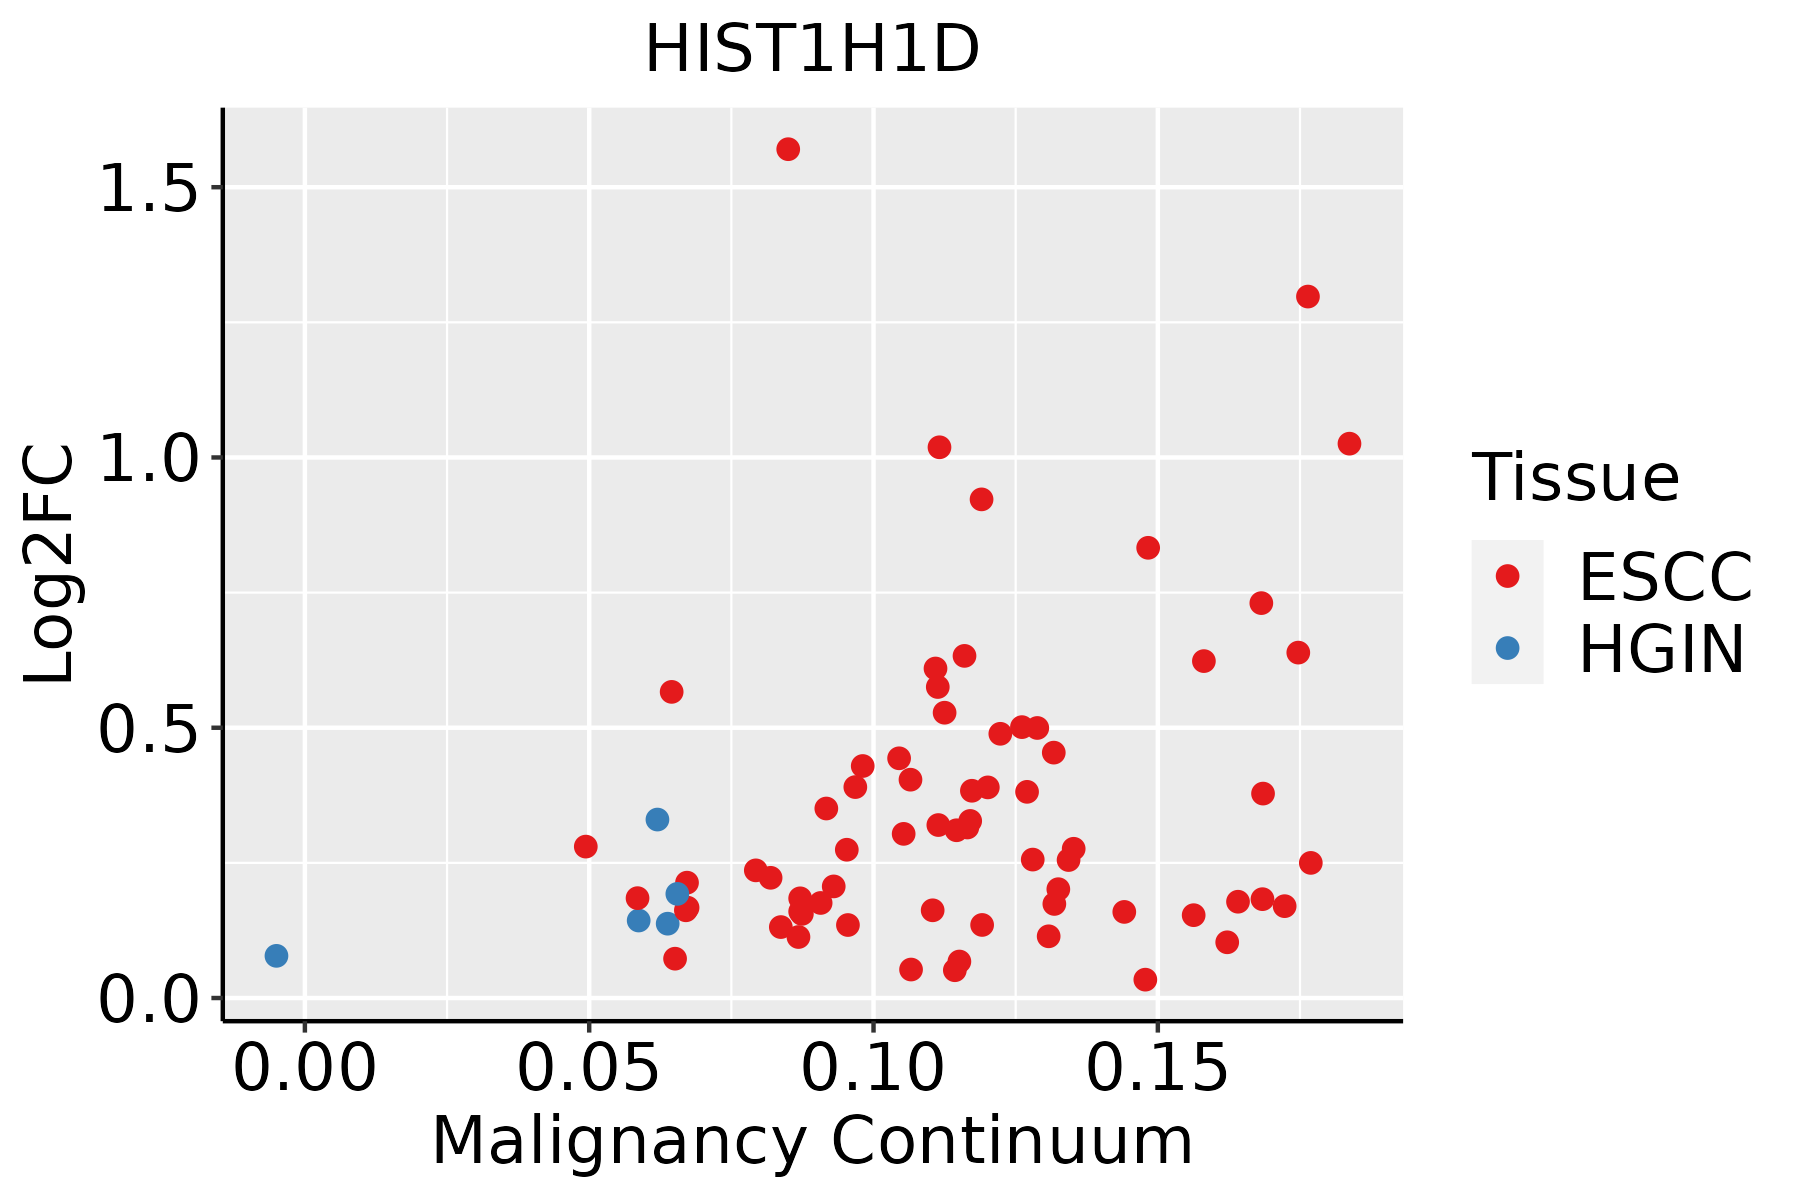 | ESCC: Esophageal squamous cell carcinoma |
| HGIN: High-grade intraepithelial neoplasias | ||
| LGIN: Low-grade intraepithelial neoplasias | ||
| Liver |  | HCC: Hepatocellular carcinoma |
| NAFLD: Non-alcoholic fatty liver disease | ||
| Oral Cavity |  | EOLP: Erosive Oral lichen planus |
| LP: leukoplakia | ||
| NEOLP: Non-erosive oral lichen planus | ||
| OSCC: Oral squamous cell carcinoma | ||
| Skin | 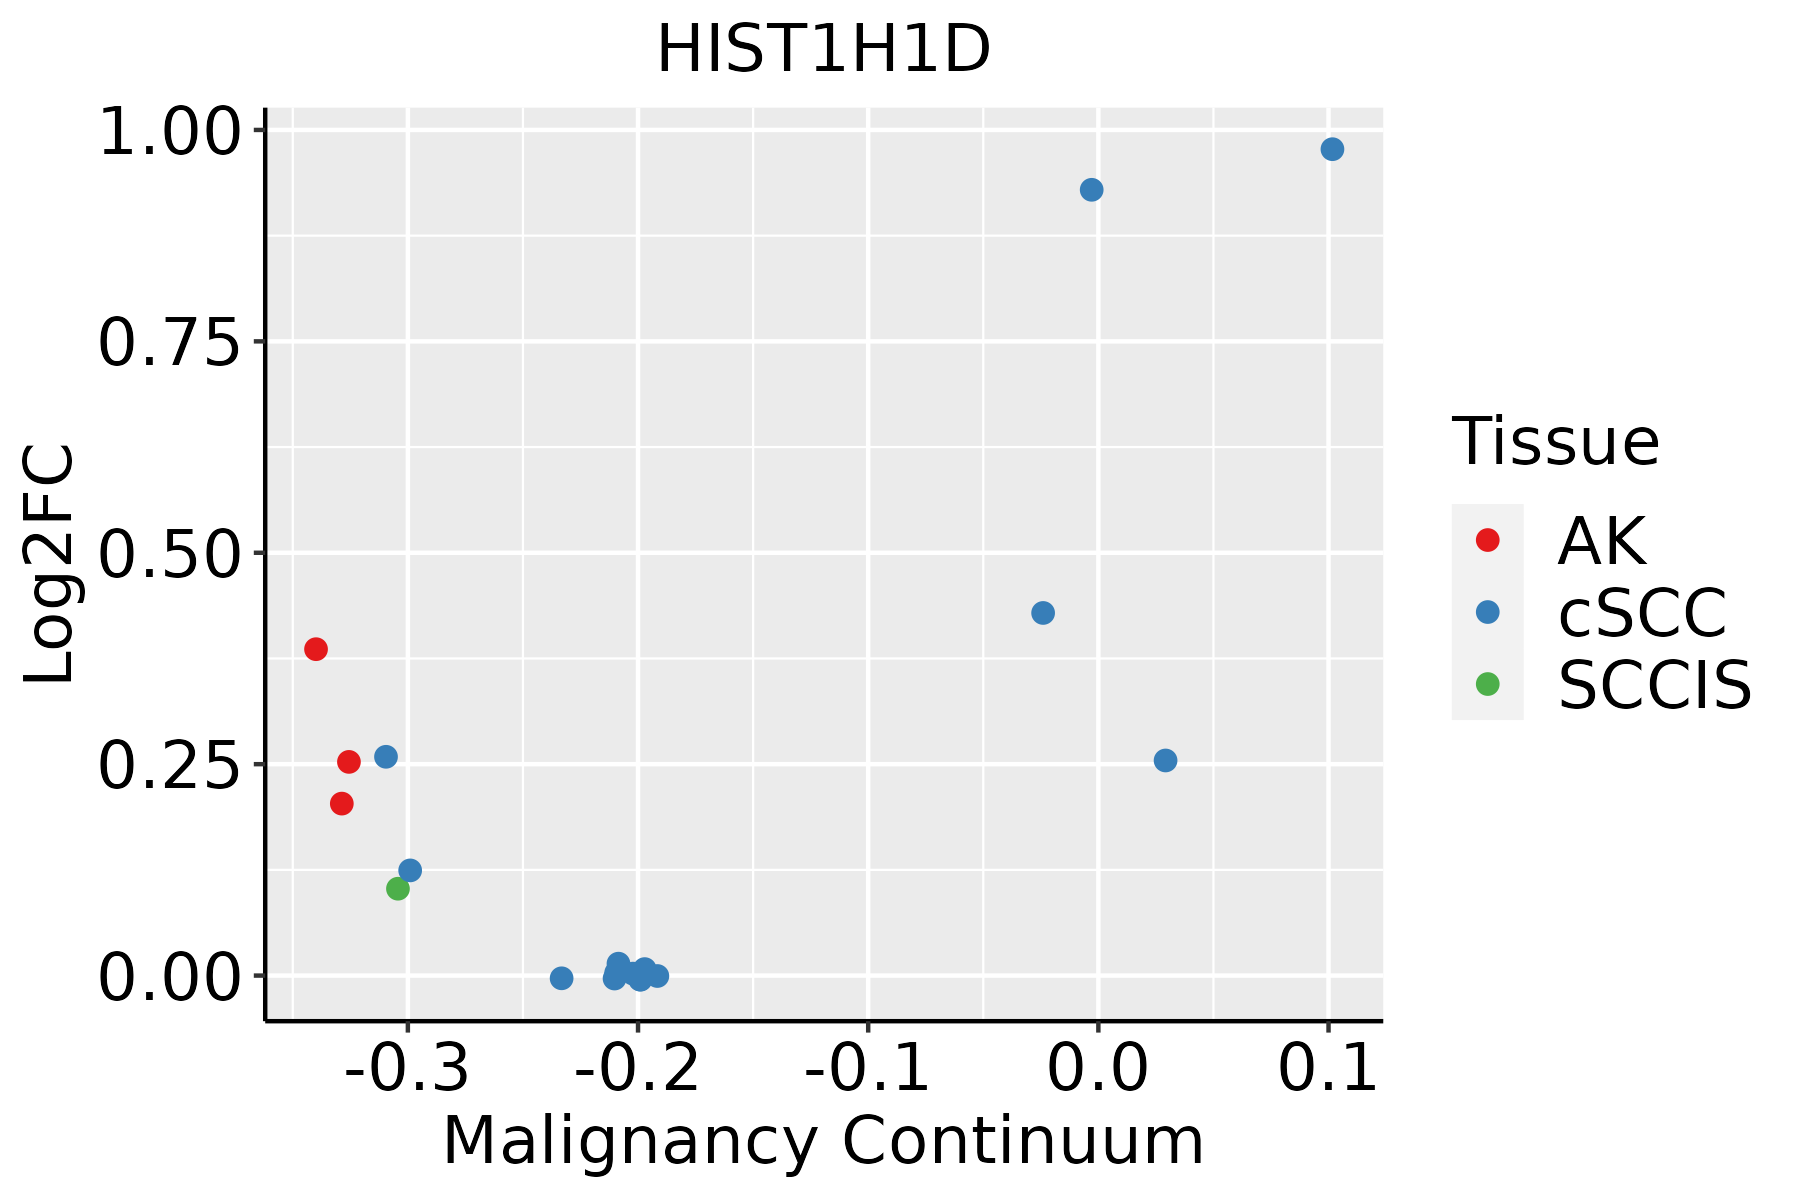 | AK: Actinic keratosis |
| cSCC: Cutaneous squamous cell carcinoma | ||
| SCCIS:squamous cell carcinoma in situ | ||
| Thyroid |  | ATC: Anaplastic thyroid cancer |
| HT: Hashimoto's thyroiditis | ||
| PTC: Papillary thyroid cancer |
| ∗log2FC in expression of this searched gene in stem-like cells from each diseased tissue sample relative to stem-like cells in normal samples in each tissue plotted against the malignancy continuum. Samples are colored based on if they are from different disease stage. |
Top |
Malignant transformation related pathway analysis |
| Find out the enriched GO biological processes and KEGG pathways involved in transition from healthy to precancer to cancer |
| Tissue | Disease Stage | Enriched GO biological Processes |
| Colorectum | AD |  |
| Colorectum | SER |  |
| Colorectum | MSS |  |
| Colorectum | MSI-H |  |
| Colorectum | FAP |  |
| ∗Top 15 enriched GO BP terms are showed in the bar plot of each disease state in each tissue. Each row represents a significant GO biological process which is colored according to the -log10(p.adjust). |
| Page: 1 2 3 4 5 6 7 8 9 |
| GO ID | Tissue | Disease Stage | Description | Gene Ratio | Bg Ratio | pvalue | p.adjust | Count |
| Page: 1 |
| Pathway ID | Tissue | Disease Stage | Description | Gene Ratio | Bg Ratio | pvalue | p.adjust | qvalue | Count |
| Page: 1 |
Top |
Cell-cell communication analysis |
| Identification of potential cell-cell interactions between two cell types and their ligand-receptor pairs for different disease states |
| Ligand | Receptor | LRpair | Pathway | Tissue | Disease Stage |
| Page: 1 |
Top |
Single-cell gene regulatory network inference analysis |
| Find out the significant the regulons (TFs) and the target genes of each regulon across cell types for different disease states |
| TF | Cell Type | Tissue | Disease Stage | Target Gene | RSS | Regulon Activity |
| ∗The dot plots of a searched regulon are shown for all cell subpopulations in each disease state of each tissue based on the regulon specific score inferred using pySCENIC and by calculating the average expression. |
| Page: 1 |
Top |
Somatic mutation of malignant transformation related genes |
| Annotation of somatic variants for genes involved in malignant transformation |
| Hugo Symbol | Variant Class | Variant Classification | dbSNP RS | HGVSc | HGVSp | HGVSp Short | SWISSPROT | BIOTYPE | SIFT | PolyPhen | Tumor Sample Barcode | Tissue | Histology | Sex | Age | Stage | Therapy Types | Drugs | Outcome |
| HIST1H1D | SNV | Missense_Mutation | c.475N>A | p.Val159Ile | p.V159I | P16402 | protein_coding | deleterious(0) | benign(0.015) | TCGA-A2-A0CX-01 | Breast | breast invasive carcinoma | Female | <65 | I/II | Chemotherapy | adriamycin | SD | |
| HIST1H1D | SNV | Missense_Mutation | c.191A>G | p.Lys64Arg | p.K64R | P16402 | protein_coding | deleterious(0) | probably_damaging(0.999) | TCGA-AR-A24O-01 | Breast | breast invasive carcinoma | Female | <65 | III/IV | Chemotherapy | cytoxan | PD | |
| HIST1H1D | SNV | Missense_Mutation | c.437C>A | p.Ala146Asp | p.A146D | P16402 | protein_coding | tolerated(0.14) | benign(0.193) | TCGA-JL-A3YW-01 | Breast | breast invasive carcinoma | Female | <65 | I/II | Unknown | Unknown | SD | |
| HIST1H1D | insertion | Frame_Shift_Ins | novel | c.214_215insC | p.Tyr72SerfsTer59 | p.Y72Sfs*59 | P16402 | protein_coding | TCGA-A2-A0EO-01 | Breast | breast invasive carcinoma | Female | <65 | I/II | Hormone Therapy | tamoxiphen | SD | ||
| HIST1H1D | insertion | In_Frame_Ins | novel | c.213_214insCAAGAGTGCGAAAAAGGTGAAAACACC | p.Gly71_Tyr72insGlnGluCysGluLysGlyGluAsnThr | p.G71_Y72insQECEKGENT | P16402 | protein_coding | TCGA-A2-A0EO-01 | Breast | breast invasive carcinoma | Female | <65 | I/II | Hormone Therapy | tamoxiphen | SD | ||
| HIST1H1D | SNV | Missense_Mutation | novel | c.455N>C | p.Ile152Thr | p.I152T | P16402 | protein_coding | tolerated(0.58) | benign(0) | TCGA-A6-6780-01 | Colorectum | colon adenocarcinoma | Male | >=65 | I/II | Unknown | Unknown | SD |
| HIST1H1D | SNV | Missense_Mutation | c.547N>G | p.Pro183Ala | p.P183A | P16402 | protein_coding | tolerated(0.91) | benign(0.011) | TCGA-A6-6781-01 | Colorectum | colon adenocarcinoma | Male | <65 | III/IV | Chemotherapy | oxaliplatin | SD | |
| HIST1H1D | SNV | Missense_Mutation | novel | c.427N>A | p.Ala143Thr | p.A143T | P16402 | protein_coding | tolerated(0.63) | benign(0) | TCGA-AA-3947-01 | Colorectum | colon adenocarcinoma | Female | <65 | I/II | Unknown | Unknown | SD |
| HIST1H1D | SNV | Missense_Mutation | rs759916366 | c.80C>T | p.Ala27Val | p.A27V | P16402 | protein_coding | tolerated(0.34) | benign(0.003) | TCGA-AA-A02H-01 | Colorectum | colon adenocarcinoma | Female | >=65 | III/IV | Unknown | Unknown | PD |
| HIST1H1D | SNV | Missense_Mutation | c.225N>C | p.Glu75Asp | p.E75D | P16402 | protein_coding | tolerated(0.07) | benign(0.32) | TCGA-CA-6717-01 | Colorectum | colon adenocarcinoma | Male | <65 | I/II | Chemotherapy | oxaliplatin | CR |
| Page: 1 2 3 4 |
Top |
Related drugs of malignant transformation related genes |
| Identification of chemicals and drugs interact with genes involved in malignant transfromation |
| (DGIdb 4.0) |
| Entrez ID | Symbol | Category | Interaction Types | Drug Claim Name | Drug Name | PMIDs |
| Page: 1 |

Copyright 2023-Present -The University of Texas Health Science Center at Houston |