
|
|||||
|
 | |
| |
| |
| |
| |
| |
|
Gene: HIST1H1C |
Gene summary for HIST1H1C |
| Gene information | Species | Human | Gene symbol | HIST1H1C | Gene ID | 3006 |
| Gene name | H1.2 linker histone, cluster member | |
| Gene Alias | H1.2 | |
| Cytomap | 6p22.2 | |
| Gene Type | protein-coding | GO ID | GO:0000018 | UniProtAcc | P16403 |
Top |
Malignant transformation analysis |
| Identification of the aberrant gene expression in precancerous and cancerous lesions by comparing the gene expression of stem-like cells in diseased tissues with normal stem cells |
| Entrez ID | Symbol | Replicates | Species | Organ | Tissue | Adj P-value | Log2FC | Malignancy |
| 3006 | HIST1H1C | GSM4909285 | Human | Breast | IDC | 2.61e-09 | -4.61e-01 | 0.21 |
| 3006 | HIST1H1C | GSM4909290 | Human | Breast | IDC | 2.58e-02 | -3.29e-01 | 0.2096 |
| 3006 | HIST1H1C | GSM4909293 | Human | Breast | IDC | 3.45e-18 | -5.16e-01 | 0.1581 |
| 3006 | HIST1H1C | GSM4909294 | Human | Breast | IDC | 8.48e-08 | -3.91e-01 | 0.2022 |
| 3006 | HIST1H1C | GSM4909296 | Human | Breast | IDC | 1.08e-18 | 6.08e-01 | 0.1524 |
| 3006 | HIST1H1C | GSM4909297 | Human | Breast | IDC | 1.21e-11 | -4.47e-01 | 0.1517 |
| 3006 | HIST1H1C | GSM4909298 | Human | Breast | IDC | 6.12e-12 | -4.88e-01 | 0.1551 |
| 3006 | HIST1H1C | GSM4909304 | Human | Breast | IDC | 3.50e-05 | -3.66e-01 | 0.1636 |
| 3006 | HIST1H1C | GSM4909305 | Human | Breast | IDC | 3.75e-03 | -4.09e-01 | 0.0436 |
| 3006 | HIST1H1C | GSM4909306 | Human | Breast | IDC | 3.48e-07 | -4.35e-01 | 0.1564 |
| 3006 | HIST1H1C | GSM4909308 | Human | Breast | IDC | 7.48e-04 | -2.87e-01 | 0.158 |
| 3006 | HIST1H1C | GSM4909311 | Human | Breast | IDC | 6.97e-22 | -5.08e-01 | 0.1534 |
| 3006 | HIST1H1C | GSM4909312 | Human | Breast | IDC | 5.25e-17 | -5.19e-01 | 0.1552 |
| 3006 | HIST1H1C | GSM4909319 | Human | Breast | IDC | 1.65e-25 | 1.38e-01 | 0.1563 |
| 3006 | HIST1H1C | GSM4909320 | Human | Breast | IDC | 5.07e-17 | 8.50e-01 | 0.1575 |
| 3006 | HIST1H1C | GSM4909321 | Human | Breast | IDC | 4.74e-12 | 5.07e-01 | 0.1559 |
| 3006 | HIST1H1C | ctrl6 | Human | Breast | Precancer | 8.55e-07 | 6.34e-01 | -0.0061 |
| 3006 | HIST1H1C | brca10 | Human | Breast | Precancer | 2.76e-29 | 8.84e-01 | -0.0029 |
| 3006 | HIST1H1C | NCCBC3 | Human | Breast | DCIS | 2.13e-02 | -3.48e-01 | 0.1198 |
| 3006 | HIST1H1C | NCCBC5 | Human | Breast | DCIS | 1.46e-03 | -2.20e-01 | 0.2046 |
| Page: 1 2 3 4 5 6 7 8 9 |
| Tissue | Expression Dynamics | Abbreviation |
| Breast | 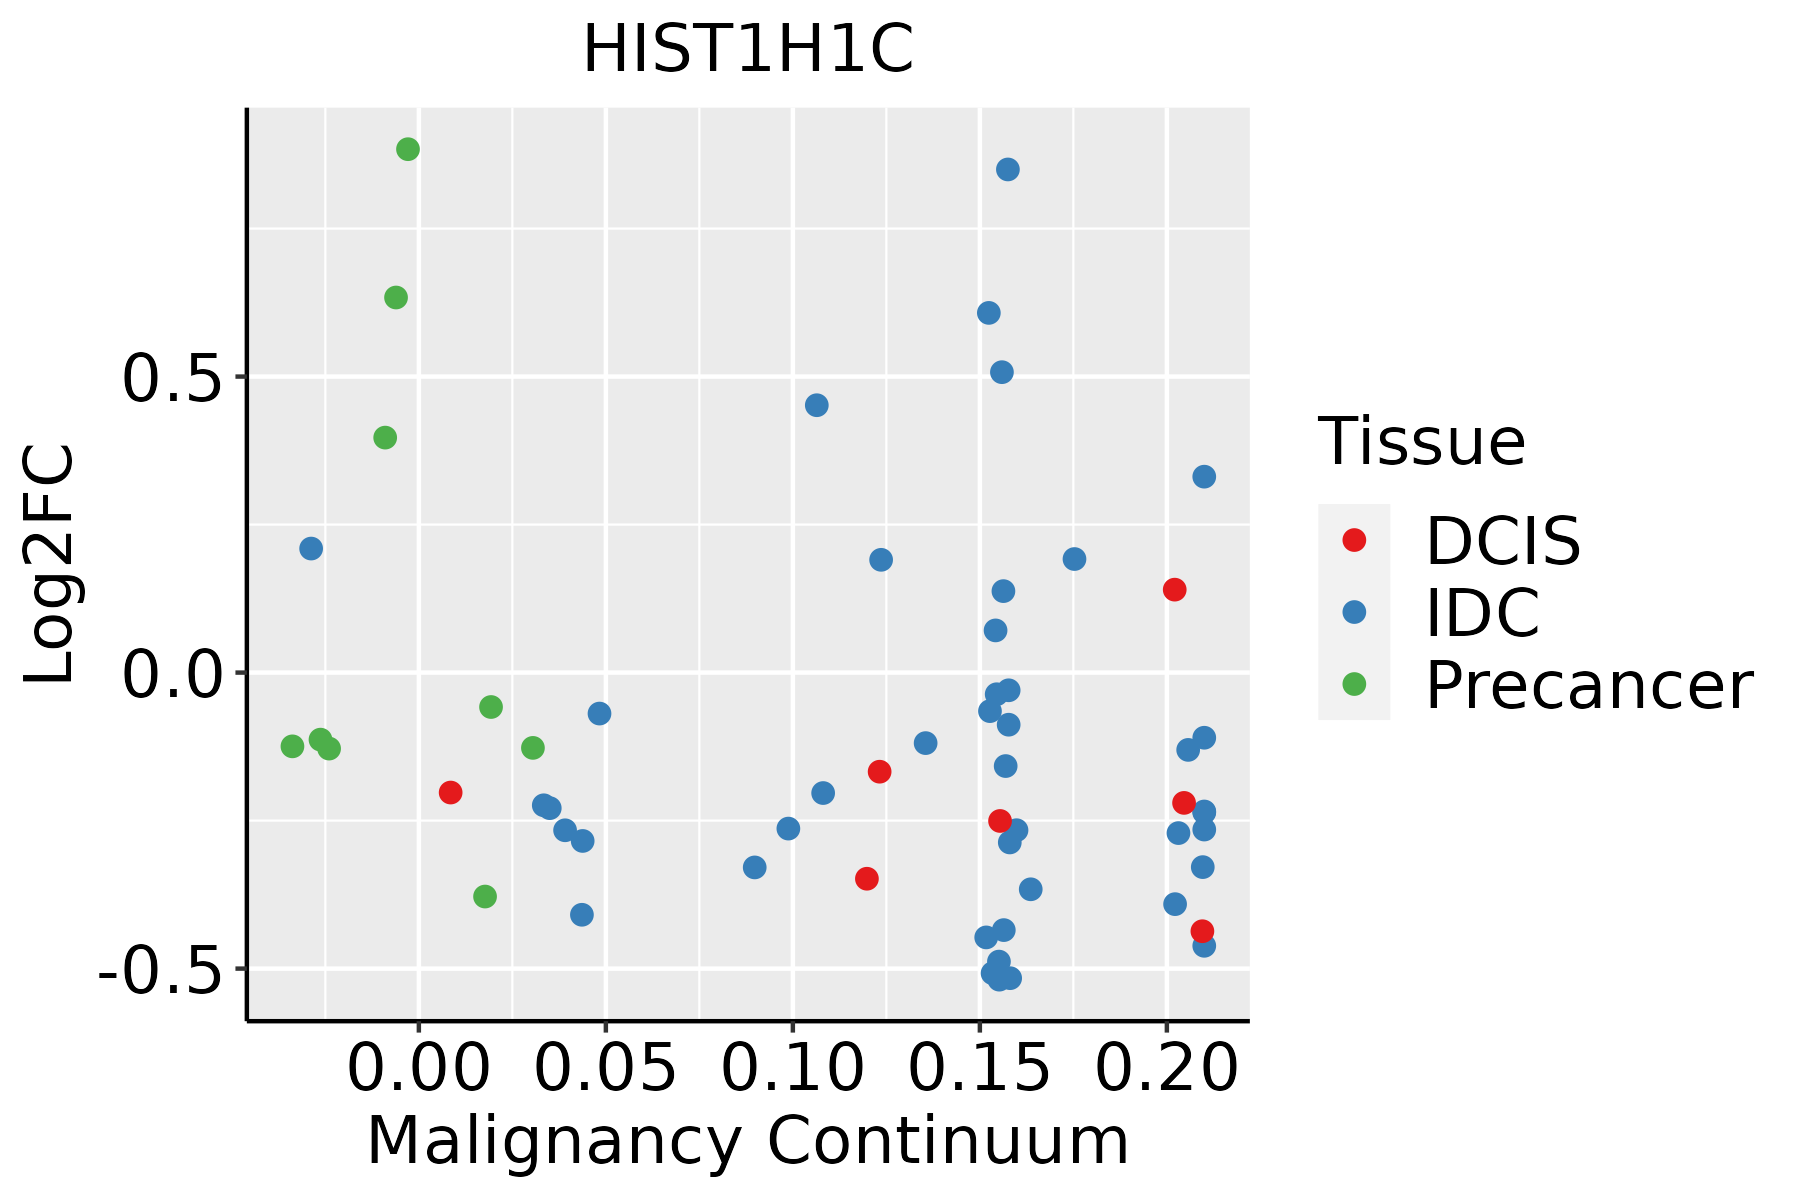 | IDC: Invasive ductal carcinoma |
| DCIS: Ductal carcinoma in situ | ||
| Precancer(BRCA1-mut): Precancerous lesion from BRCA1 mutation carriers | ||
| Cervix |  | CC: Cervix cancer |
| HSIL_HPV: HPV-infected high-grade squamous intraepithelial lesions | ||
| N_HPV: HPV-infected normal cervix | ||
| Esophagus | 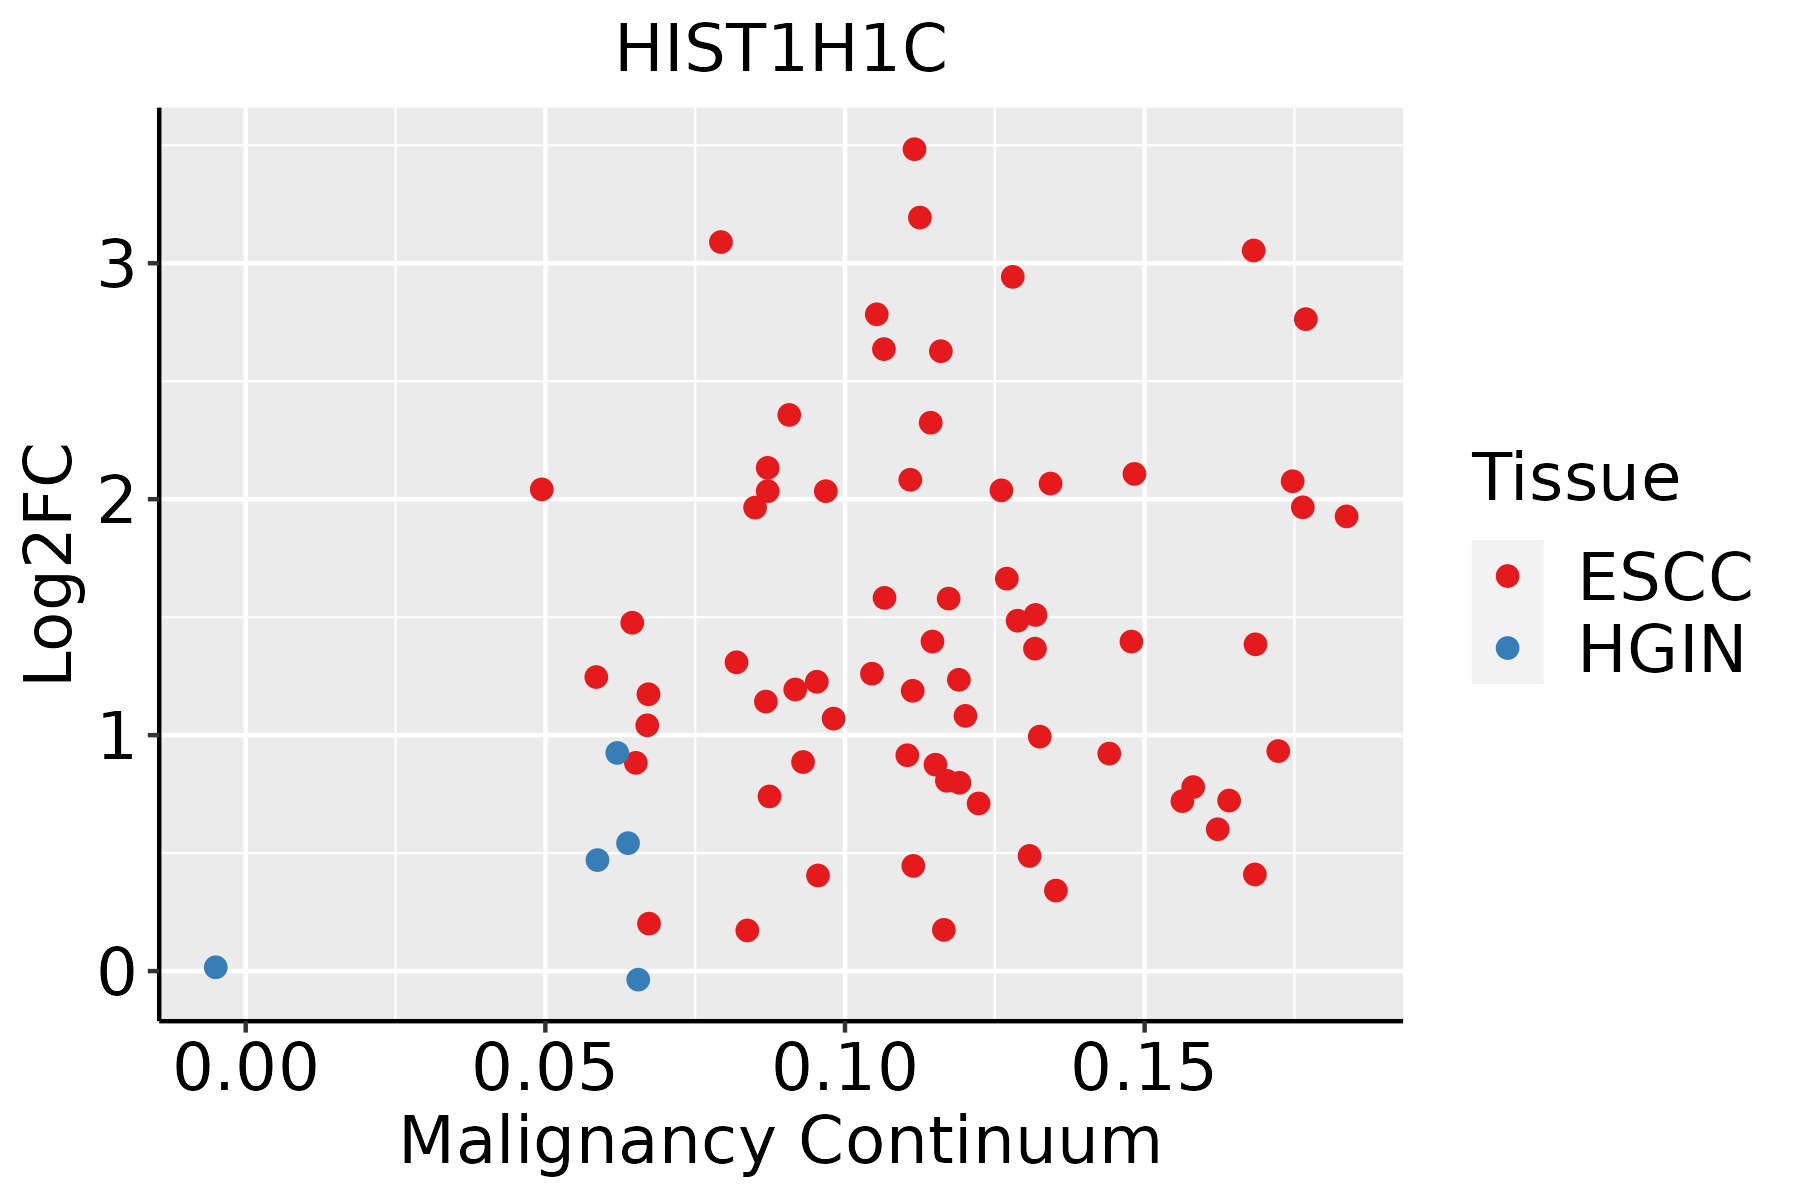 | ESCC: Esophageal squamous cell carcinoma |
| HGIN: High-grade intraepithelial neoplasias | ||
| LGIN: Low-grade intraepithelial neoplasias | ||
| Liver |  | HCC: Hepatocellular carcinoma |
| NAFLD: Non-alcoholic fatty liver disease | ||
| Oral Cavity | 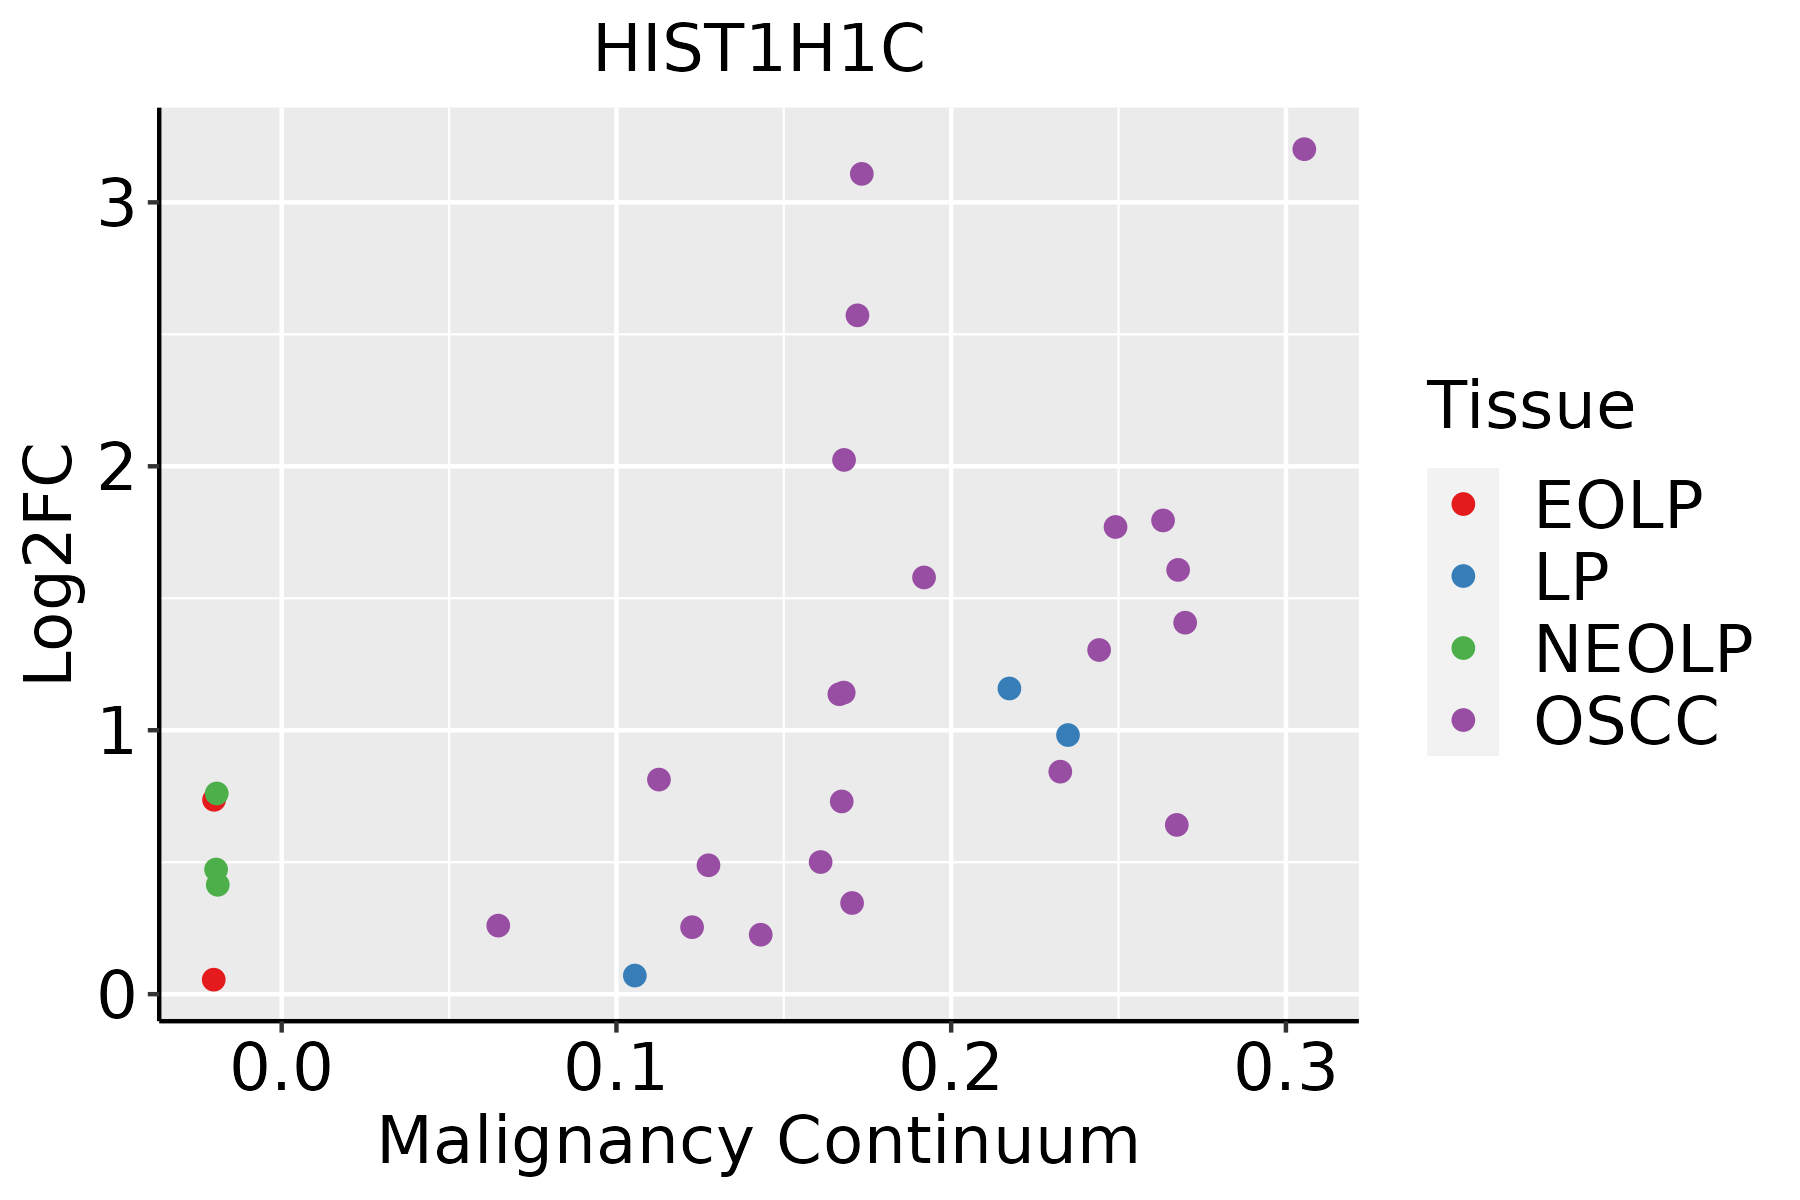 | EOLP: Erosive Oral lichen planus |
| LP: leukoplakia | ||
| NEOLP: Non-erosive oral lichen planus | ||
| OSCC: Oral squamous cell carcinoma | ||
| Prostate | 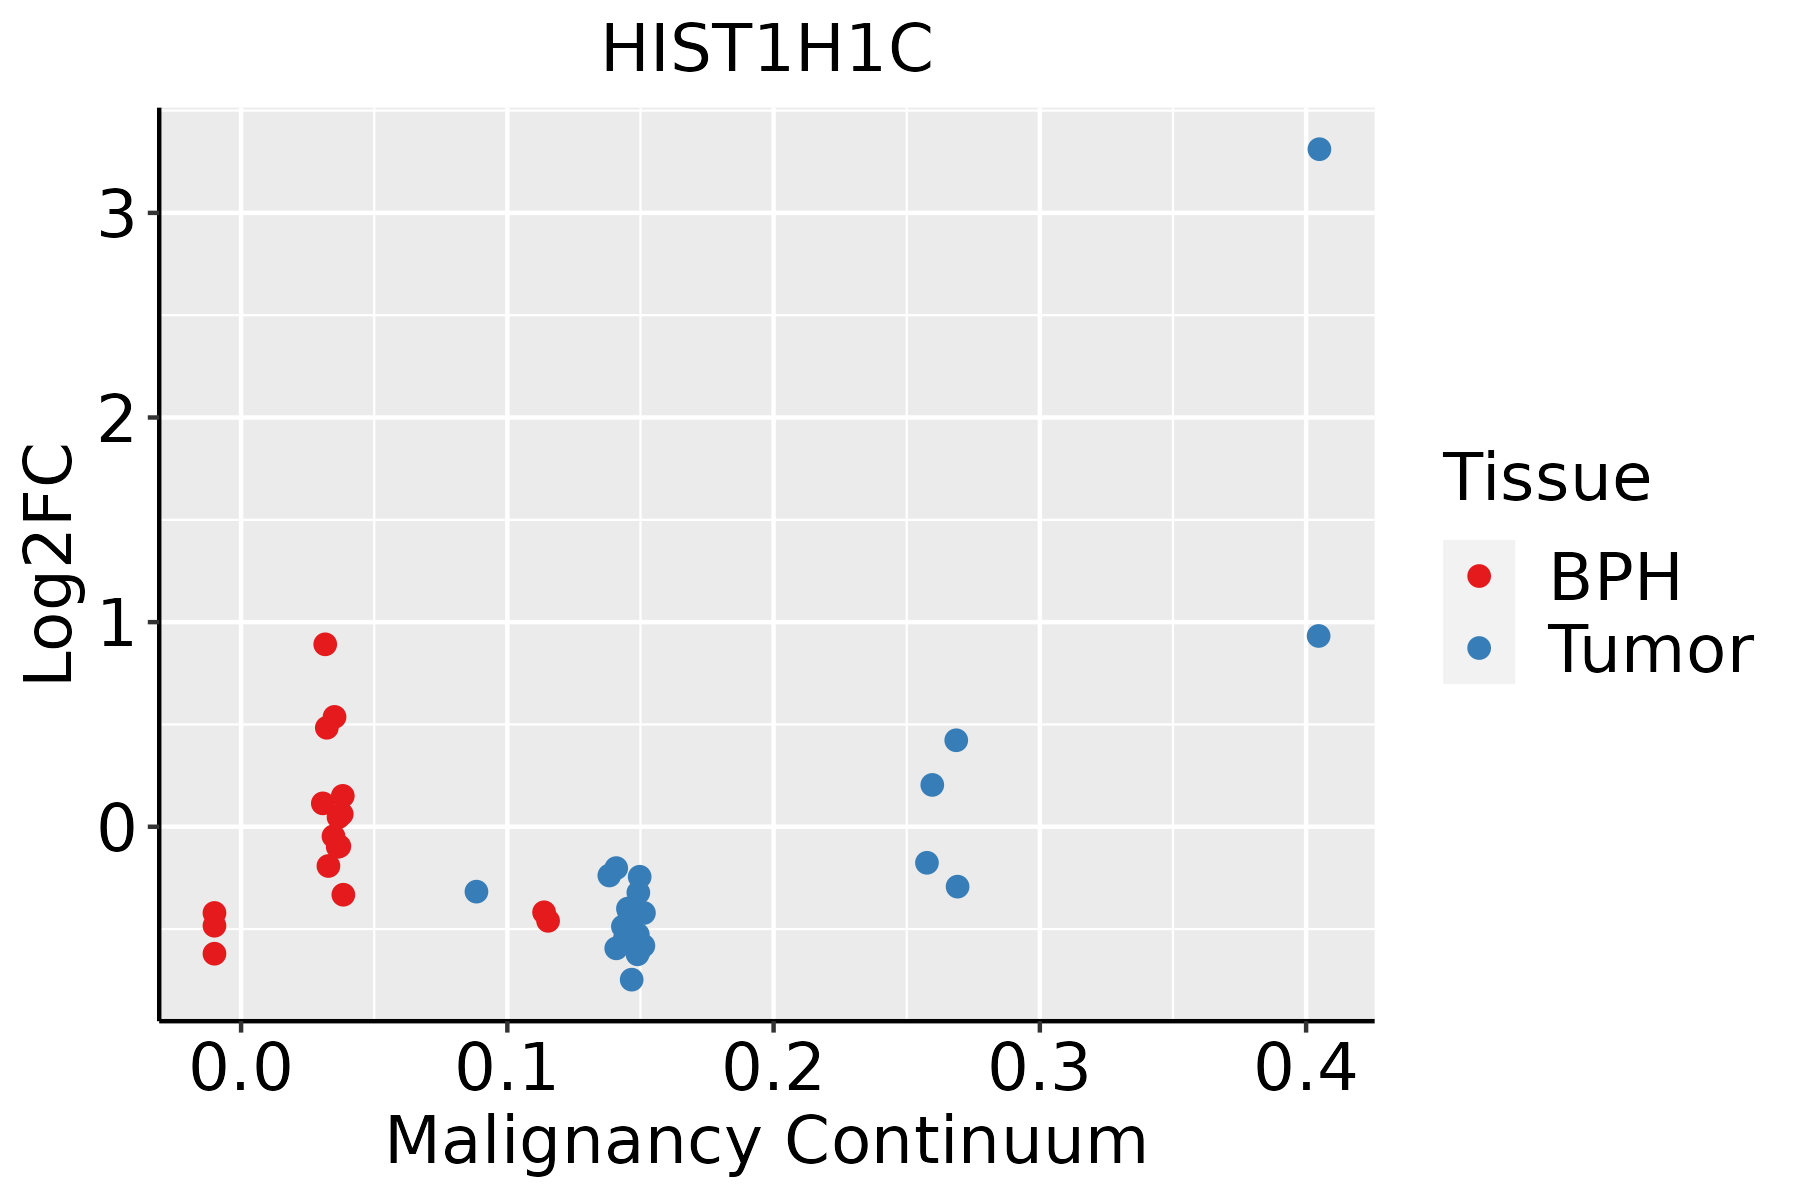 | BPH: Benign Prostatic Hyperplasia |
| Skin | 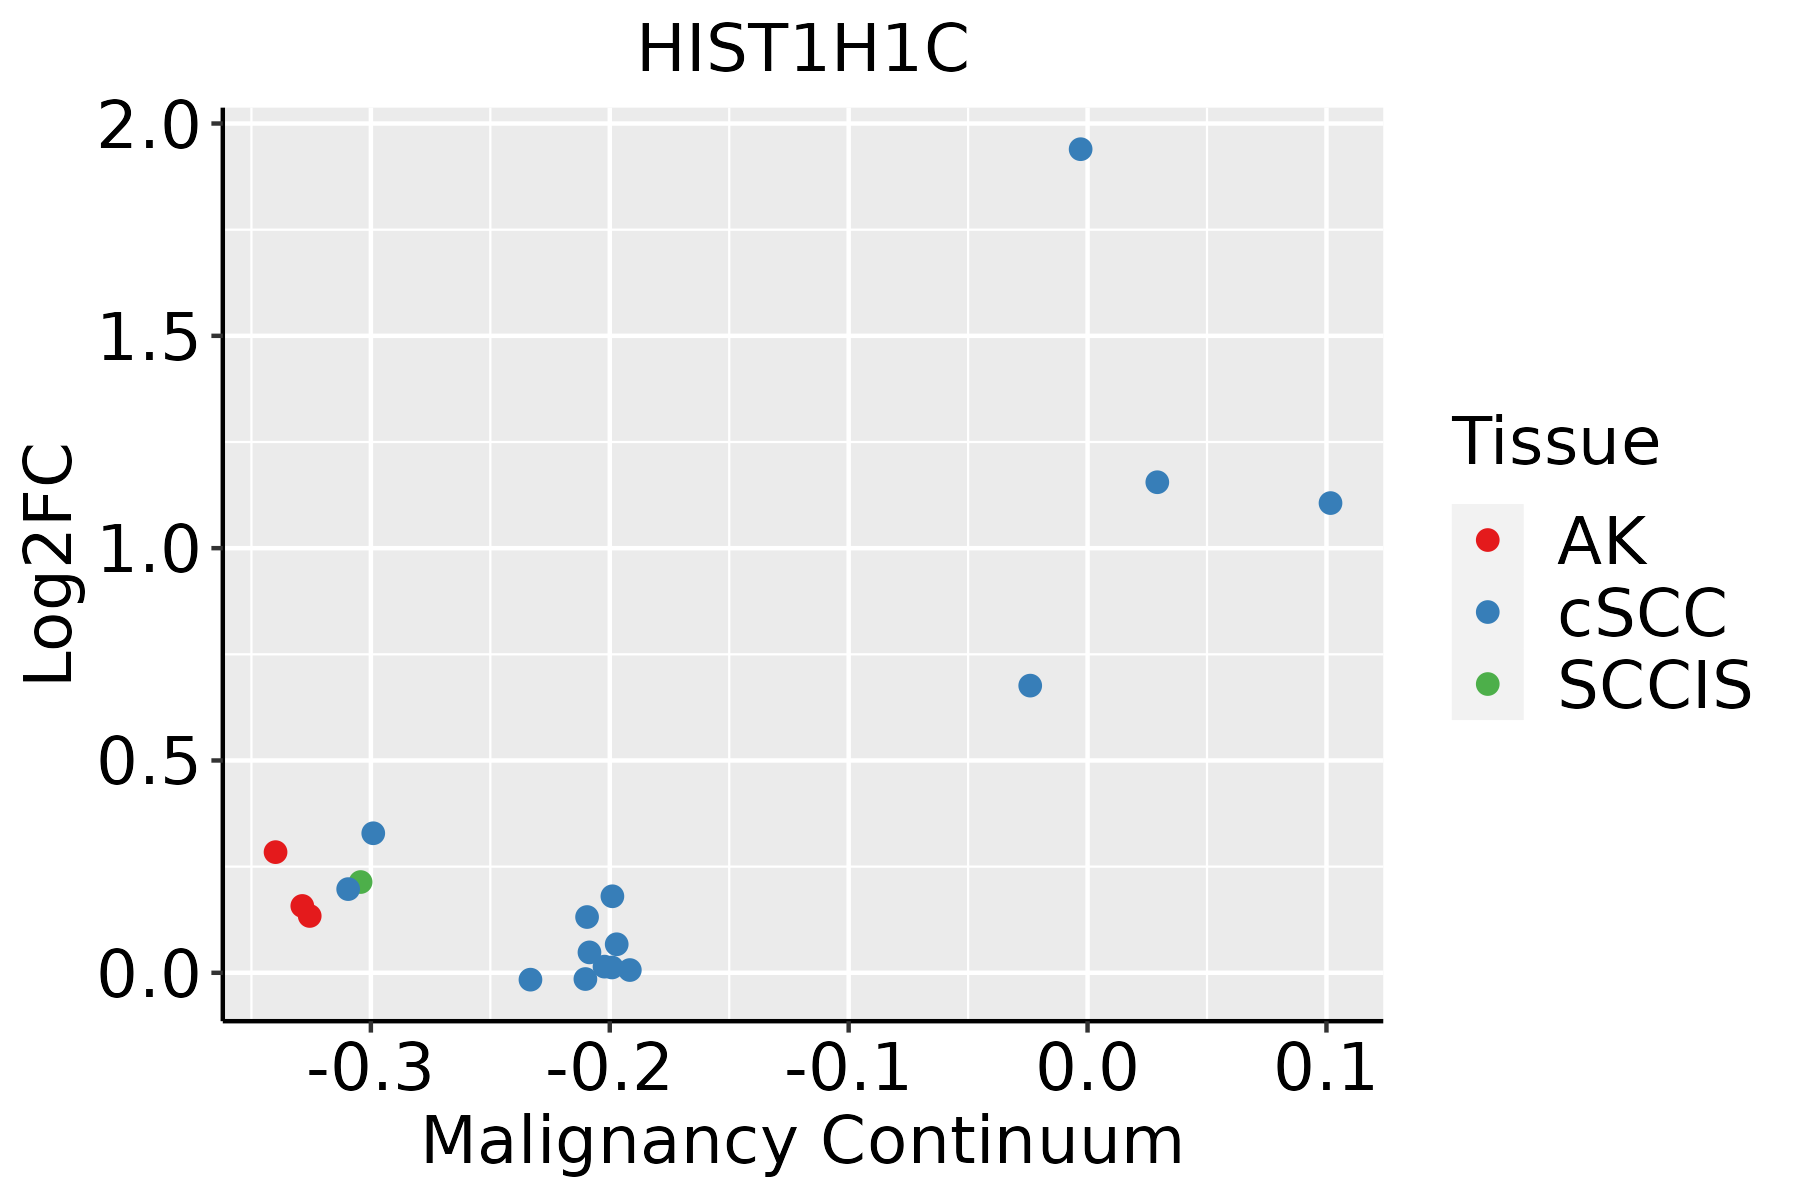 | AK: Actinic keratosis |
| cSCC: Cutaneous squamous cell carcinoma | ||
| SCCIS:squamous cell carcinoma in situ | ||
| Thyroid |  | ATC: Anaplastic thyroid cancer |
| HT: Hashimoto's thyroiditis | ||
| PTC: Papillary thyroid cancer |
| ∗log2FC in expression of this searched gene in stem-like cells from each diseased tissue sample relative to stem-like cells in normal samples in each tissue plotted against the malignancy continuum. Samples are colored based on if they are from different disease stage. |
Top |
Malignant transformation related pathway analysis |
| Find out the enriched GO biological processes and KEGG pathways involved in transition from healthy to precancer to cancer |
| Tissue | Disease Stage | Enriched GO biological Processes |
| Colorectum | AD |  |
| Colorectum | SER |  |
| Colorectum | MSS |  |
| Colorectum | MSI-H |  |
| Colorectum | FAP |  |
| ∗Top 15 enriched GO BP terms are showed in the bar plot of each disease state in each tissue. Each row represents a significant GO biological process which is colored according to the -log10(p.adjust). |
| Page: 1 2 3 4 5 6 7 8 9 |
| GO ID | Tissue | Disease Stage | Description | Gene Ratio | Bg Ratio | pvalue | p.adjust | Count |
| Page: 1 |
| Pathway ID | Tissue | Disease Stage | Description | Gene Ratio | Bg Ratio | pvalue | p.adjust | qvalue | Count |
| Page: 1 |
Top |
Cell-cell communication analysis |
| Identification of potential cell-cell interactions between two cell types and their ligand-receptor pairs for different disease states |
| Ligand | Receptor | LRpair | Pathway | Tissue | Disease Stage |
| Page: 1 |
Top |
Single-cell gene regulatory network inference analysis |
| Find out the significant the regulons (TFs) and the target genes of each regulon across cell types for different disease states |
| TF | Cell Type | Tissue | Disease Stage | Target Gene | RSS | Regulon Activity |
| ∗The dot plots of a searched regulon are shown for all cell subpopulations in each disease state of each tissue based on the regulon specific score inferred using pySCENIC and by calculating the average expression. |
| Page: 1 |
Top |
Somatic mutation of malignant transformation related genes |
| Annotation of somatic variants for genes involved in malignant transformation |
| Hugo Symbol | Variant Class | Variant Classification | dbSNP RS | HGVSc | HGVSp | HGVSp Short | SWISSPROT | BIOTYPE | SIFT | PolyPhen | Tumor Sample Barcode | Tissue | Histology | Sex | Age | Stage | Therapy Types | Drugs | Outcome |
| HIST1H1C | SNV | Missense_Mutation | novel | c.551N>G | p.Lys184Arg | p.K184R | P16403 | protein_coding | deleterious(0.01) | probably_damaging(0.985) | TCGA-5L-AAT1-01 | Breast | breast invasive carcinoma | Female | <65 | III/IV | Hormone Therapy | letrozol | SD |
| HIST1H1C | SNV | Missense_Mutation | c.595N>G | p.Lys199Glu | p.K199E | P16403 | protein_coding | deleterious(0) | probably_damaging(0.985) | TCGA-A8-A096-01 | Breast | breast invasive carcinoma | Female | >=65 | I/II | Unknown | Unknown | SD | |
| HIST1H1C | deletion | In_Frame_Del | c.475_489delNNNNNNNNNNNNNNN | p.Lys159_Ala163del | p.K159_A163del | P16403 | protein_coding | TCGA-E2-A14W-01 | Breast | breast invasive carcinoma | Male | >=65 | I/II | Chemotherapy | cytoxan | SD | |||
| HIST1H1C | SNV | Missense_Mutation | rs766767455 | c.387G>C | p.Lys129Asn | p.K129N | P16403 | protein_coding | tolerated(0.07) | benign(0.439) | TCGA-IR-A3LA-01 | Cervix | cervical & endocervical cancer | Female | <65 | I/II | Chemotherapy | cisplatin | CR |
| HIST1H1C | insertion | Frame_Shift_Ins | novel | c.143_144insT | p.Ala49GlyfsTer4 | p.A49Gfs*4 | P16403 | protein_coding | TCGA-EX-A1H6-01 | Cervix | cervical & endocervical cancer | Female | <65 | I/II | Unknown | Unknown | SD | ||
| HIST1H1C | SNV | Missense_Mutation | rs550065694 | c.173N>A | p.Ser58Tyr | p.S58Y | P16403 | protein_coding | deleterious(0) | probably_damaging(1) | TCGA-AA-3510-01 | Colorectum | colon adenocarcinoma | Male | >=65 | I/II | Unknown | Unknown | SD |
| HIST1H1C | SNV | Missense_Mutation | rs527943061 | c.439N>T | p.Pro147Ser | p.P147S | P16403 | protein_coding | tolerated(0.11) | benign(0.017) | TCGA-AA-A01V-01 | Colorectum | colon adenocarcinoma | Male | <65 | I/II | Unknown | Unknown | SD |
| HIST1H1C | SNV | Missense_Mutation | novel | c.568N>A | p.Ala190Thr | p.A190T | P16403 | protein_coding | deleterious(0) | benign(0.001) | TCGA-F4-6570-01 | Colorectum | colon adenocarcinoma | Female | >=65 | I/II | Unknown | Unknown | SD |
| HIST1H1C | SNV | Missense_Mutation | c.454A>G | p.Lys152Glu | p.K152E | P16403 | protein_coding | tolerated(0.67) | probably_damaging(0.985) | TCGA-NH-A5IV-01 | Colorectum | colon adenocarcinoma | Female | >=65 | I/II | Unknown | Unknown | SD | |
| HIST1H1C | SNV | Missense_Mutation | c.314N>G | p.Phe105Cys | p.F105C | P16403 | protein_coding | deleterious(0) | probably_damaging(1) | TCGA-NH-A6GC-01 | Colorectum | colon adenocarcinoma | Female | >=65 | I/II | Chemotherapy | fluorouracil | SD |
| Page: 1 2 3 4 5 |
Top |
Related drugs of malignant transformation related genes |
| Identification of chemicals and drugs interact with genes involved in malignant transfromation |
| (DGIdb 4.0) |
| Entrez ID | Symbol | Category | Interaction Types | Drug Claim Name | Drug Name | PMIDs |
| Page: 1 |

Copyright 2023-Present -The University of Texas Health Science Center at Houston |