
|
|||||
|
 | |
| |
| |
| |
| |
| |
|
Gene: HIRIP3 |
Gene summary for HIRIP3 |
| Gene information | Species | Human | Gene symbol | HIRIP3 | Gene ID | 8479 |
| Gene name | HIRA interacting protein 3 | |
| Gene Alias | HIRIP3 | |
| Cytomap | 16p11.2 | |
| Gene Type | protein-coding | GO ID | GO:0006325 | UniProtAcc | Q9BW71 |
Top |
Malignant transformation analysis |
| Identification of the aberrant gene expression in precancerous and cancerous lesions by comparing the gene expression of stem-like cells in diseased tissues with normal stem cells |
| Entrez ID | Symbol | Replicates | Species | Organ | Tissue | Adj P-value | Log2FC | Malignancy |
| 8479 | HIRIP3 | LZE8T | Human | Esophagus | ESCC | 9.36e-04 | 1.02e-01 | 0.067 |
| 8479 | HIRIP3 | LZE24T | Human | Esophagus | ESCC | 4.31e-13 | 4.30e-01 | 0.0596 |
| 8479 | HIRIP3 | LZE6T | Human | Esophagus | ESCC | 1.71e-03 | 1.81e-01 | 0.0845 |
| 8479 | HIRIP3 | P1T-E | Human | Esophagus | ESCC | 2.90e-05 | 3.11e-01 | 0.0875 |
| 8479 | HIRIP3 | P2T-E | Human | Esophagus | ESCC | 3.79e-37 | 6.76e-01 | 0.1177 |
| 8479 | HIRIP3 | P4T-E | Human | Esophagus | ESCC | 2.27e-13 | 3.38e-01 | 0.1323 |
| 8479 | HIRIP3 | P5T-E | Human | Esophagus | ESCC | 8.40e-16 | 1.80e-01 | 0.1327 |
| 8479 | HIRIP3 | P8T-E | Human | Esophagus | ESCC | 4.68e-24 | 2.07e-01 | 0.0889 |
| 8479 | HIRIP3 | P10T-E | Human | Esophagus | ESCC | 1.12e-11 | 1.47e-01 | 0.116 |
| 8479 | HIRIP3 | P12T-E | Human | Esophagus | ESCC | 2.37e-21 | 3.37e-01 | 0.1122 |
| 8479 | HIRIP3 | P15T-E | Human | Esophagus | ESCC | 1.63e-09 | 1.60e-01 | 0.1149 |
| 8479 | HIRIP3 | P16T-E | Human | Esophagus | ESCC | 7.22e-17 | 3.35e-01 | 0.1153 |
| 8479 | HIRIP3 | P20T-E | Human | Esophagus | ESCC | 1.98e-15 | 3.20e-01 | 0.1124 |
| 8479 | HIRIP3 | P21T-E | Human | Esophagus | ESCC | 1.61e-10 | 2.32e-01 | 0.1617 |
| 8479 | HIRIP3 | P22T-E | Human | Esophagus | ESCC | 1.02e-23 | 3.03e-01 | 0.1236 |
| 8479 | HIRIP3 | P23T-E | Human | Esophagus | ESCC | 6.72e-12 | 2.76e-01 | 0.108 |
| 8479 | HIRIP3 | P24T-E | Human | Esophagus | ESCC | 2.27e-14 | 1.44e-01 | 0.1287 |
| 8479 | HIRIP3 | P26T-E | Human | Esophagus | ESCC | 2.31e-19 | 2.62e-01 | 0.1276 |
| 8479 | HIRIP3 | P27T-E | Human | Esophagus | ESCC | 1.00e-06 | 1.66e-01 | 0.1055 |
| 8479 | HIRIP3 | P28T-E | Human | Esophagus | ESCC | 7.15e-16 | 1.47e-01 | 0.1149 |
| Page: 1 2 3 4 |
| Tissue | Expression Dynamics | Abbreviation |
| Esophagus |  | ESCC: Esophageal squamous cell carcinoma |
| HGIN: High-grade intraepithelial neoplasias | ||
| LGIN: Low-grade intraepithelial neoplasias | ||
| Oral Cavity |  | EOLP: Erosive Oral lichen planus |
| LP: leukoplakia | ||
| NEOLP: Non-erosive oral lichen planus | ||
| OSCC: Oral squamous cell carcinoma | ||
| Thyroid | 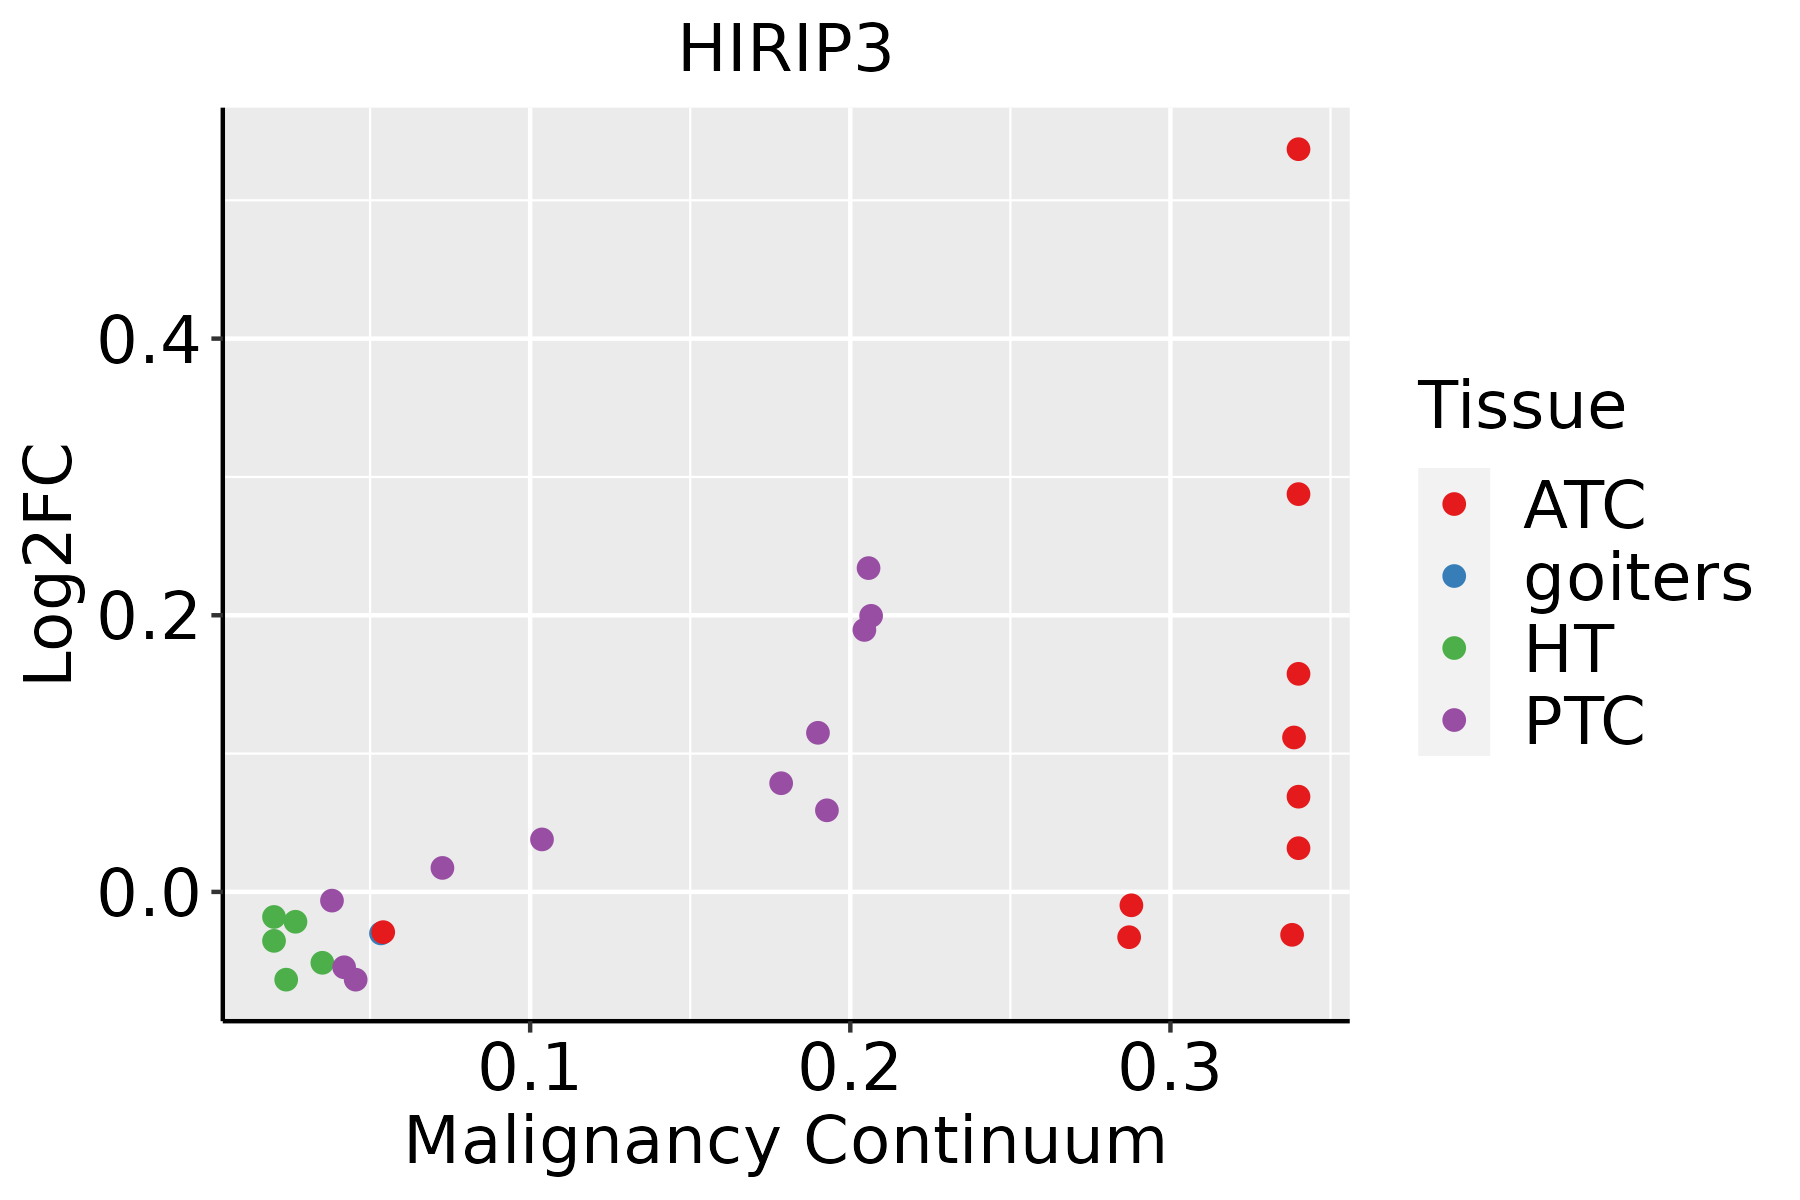 | ATC: Anaplastic thyroid cancer |
| HT: Hashimoto's thyroiditis | ||
| PTC: Papillary thyroid cancer |
| ∗log2FC in expression of this searched gene in stem-like cells from each diseased tissue sample relative to stem-like cells in normal samples in each tissue plotted against the malignancy continuum. Samples are colored based on if they are from different disease stage. |
Top |
Malignant transformation related pathway analysis |
| Find out the enriched GO biological processes and KEGG pathways involved in transition from healthy to precancer to cancer |
| Tissue | Disease Stage | Enriched GO biological Processes |
| Colorectum | AD |  |
| Colorectum | SER |  |
| Colorectum | MSS |  |
| Colorectum | MSI-H |  |
| Colorectum | FAP |  |
| ∗Top 15 enriched GO BP terms are showed in the bar plot of each disease state in each tissue. Each row represents a significant GO biological process which is colored according to the -log10(p.adjust). |
| Page: 1 2 3 4 5 6 7 8 9 |
| GO ID | Tissue | Disease Stage | Description | Gene Ratio | Bg Ratio | pvalue | p.adjust | Count |
| GO:000632517 | Esophagus | ESCC | chromatin organization | 240/8552 | 409/18723 | 6.52e-08 | 1.14e-06 | 240 |
| GO:000632510 | Oral cavity | OSCC | chromatin organization | 190/7305 | 409/18723 | 1.17e-03 | 5.97e-03 | 190 |
| GO:000632520 | Thyroid | PTC | chromatin organization | 183/5968 | 409/18723 | 2.55e-08 | 5.70e-07 | 183 |
| GO:0006325110 | Thyroid | ATC | chromatin organization | 189/6293 | 409/18723 | 6.40e-08 | 1.13e-06 | 189 |
| Page: 1 |
| Pathway ID | Tissue | Disease Stage | Description | Gene Ratio | Bg Ratio | pvalue | p.adjust | qvalue | Count |
| Page: 1 |
Top |
Cell-cell communication analysis |
| Identification of potential cell-cell interactions between two cell types and their ligand-receptor pairs for different disease states |
| Ligand | Receptor | LRpair | Pathway | Tissue | Disease Stage |
| Page: 1 |
Top |
Single-cell gene regulatory network inference analysis |
| Find out the significant the regulons (TFs) and the target genes of each regulon across cell types for different disease states |
| TF | Cell Type | Tissue | Disease Stage | Target Gene | RSS | Regulon Activity |
| ∗The dot plots of a searched regulon are shown for all cell subpopulations in each disease state of each tissue based on the regulon specific score inferred using pySCENIC and by calculating the average expression. |
| Page: 1 |
Top |
Somatic mutation of malignant transformation related genes |
| Annotation of somatic variants for genes involved in malignant transformation |
| Hugo Symbol | Variant Class | Variant Classification | dbSNP RS | HGVSc | HGVSp | HGVSp Short | SWISSPROT | BIOTYPE | SIFT | PolyPhen | Tumor Sample Barcode | Tissue | Histology | Sex | Age | Stage | Therapy Types | Drugs | Outcome |
| HIRIP3 | SNV | Missense_Mutation | rs749615547 | c.910N>A | p.Asp304Asn | p.D304N | Q9BW71 | protein_coding | tolerated(1) | benign(0) | TCGA-A2-A4RY-01 | Breast | breast invasive carcinoma | Female | <65 | III/IV | Chemotherapy | taxotere | CR |
| HIRIP3 | SNV | Missense_Mutation | novel | c.589N>A | p.Glu197Lys | p.E197K | Q9BW71 | protein_coding | deleterious(0.02) | benign(0.017) | TCGA-A2-A4S3-01 | Breast | breast invasive carcinoma | Female | <65 | I/II | Unknown | Unknown | SD |
| HIRIP3 | SNV | Missense_Mutation | rs770674805 | c.559G>A | p.Val187Ile | p.V187I | Q9BW71 | protein_coding | deleterious(0) | benign(0.037) | TCGA-AR-A5QM-01 | Breast | breast invasive carcinoma | Female | <65 | I/II | Hormone Therapy | anastrozole | PD |
| HIRIP3 | SNV | Missense_Mutation | c.762G>T | p.Lys254Asn | p.K254N | Q9BW71 | protein_coding | deleterious(0.04) | benign(0.006) | TCGA-BH-A1FU-01 | Breast | breast invasive carcinoma | Female | <65 | I/II | Unknown | Unknown | PD | |
| HIRIP3 | SNV | Missense_Mutation | novel | c.106C>G | p.His36Asp | p.H36D | Q9BW71 | protein_coding | deleterious(0) | possibly_damaging(0.462) | TCGA-VS-A9UH-01 | Cervix | cervical & endocervical cancer | Female | <65 | I/II | Chemotherapy | cisplatin | CR |
| HIRIP3 | SNV | Missense_Mutation | novel | c.1237A>G | p.Lys413Glu | p.K413E | Q9BW71 | protein_coding | deleterious(0.01) | probably_damaging(0.984) | TCGA-AA-3845-01 | Colorectum | colon adenocarcinoma | Female | >=65 | I/II | Unknown | Unknown | PD |
| HIRIP3 | SNV | Missense_Mutation | rs376313895 | c.1523N>A | p.Arg508His | p.R508H | Q9BW71 | protein_coding | deleterious(0.03) | probably_damaging(0.95) | TCGA-AA-3864-01 | Colorectum | colon adenocarcinoma | Male | >=65 | I/II | Unknown | Unknown | SD |
| HIRIP3 | SNV | Missense_Mutation | c.669N>G | p.Ser223Arg | p.S223R | Q9BW71 | protein_coding | tolerated(0.18) | benign(0.001) | TCGA-AA-A010-01 | Colorectum | colon adenocarcinoma | Female | <65 | I/II | Chemotherapy | folinic | CR | |
| HIRIP3 | SNV | Missense_Mutation | rs767923220 | c.1253N>A | p.Arg418His | p.R418H | Q9BW71 | protein_coding | tolerated(0.13) | benign(0.013) | TCGA-AU-6004-01 | Colorectum | colon adenocarcinoma | Female | >=65 | I/II | Unknown | Unknown | SD |
| HIRIP3 | SNV | Missense_Mutation | novel | c.284G>A | p.Arg95His | p.R95H | Q9BW71 | protein_coding | deleterious(0.02) | benign(0.017) | TCGA-CA-6717-01 | Colorectum | colon adenocarcinoma | Male | <65 | I/II | Chemotherapy | oxaliplatin | CR |
| Page: 1 2 3 4 5 |
Top |
Related drugs of malignant transformation related genes |
| Identification of chemicals and drugs interact with genes involved in malignant transfromation |
| (DGIdb 4.0) |
| Entrez ID | Symbol | Category | Interaction Types | Drug Claim Name | Drug Name | PMIDs |
| Page: 1 |

Copyright 2023-Present -The University of Texas Health Science Center at Houston |