
|
|||||
|
 | |
| |
| |
| |
| |
| |
|
Gene: HIRA |
Gene summary for HIRA |
| Gene information | Species | Human | Gene symbol | HIRA | Gene ID | 7290 |
| Gene name | histone cell cycle regulator | |
| Gene Alias | DGCR1 | |
| Cytomap | 22q11.21 | |
| Gene Type | protein-coding | GO ID | GO:0006139 | UniProtAcc | P54198 |
Top |
Malignant transformation analysis |
| Identification of the aberrant gene expression in precancerous and cancerous lesions by comparing the gene expression of stem-like cells in diseased tissues with normal stem cells |
| Entrez ID | Symbol | Replicates | Species | Organ | Tissue | Adj P-value | Log2FC | Malignancy |
| 7290 | HIRA | male-WTA | Human | Thyroid | PTC | 1.61e-43 | 3.00e-01 | 0.1037 |
| 7290 | HIRA | PTC01 | Human | Thyroid | PTC | 8.42e-18 | -1.53e-02 | 0.1899 |
| 7290 | HIRA | PTC04 | Human | Thyroid | PTC | 2.07e-11 | 1.06e-01 | 0.1927 |
| 7290 | HIRA | PTC05 | Human | Thyroid | PTC | 5.57e-08 | 2.01e-01 | 0.2065 |
| 7290 | HIRA | PTC06 | Human | Thyroid | PTC | 1.55e-33 | 7.78e-01 | 0.2057 |
| 7290 | HIRA | PTC07 | Human | Thyroid | PTC | 1.52e-25 | 4.76e-01 | 0.2044 |
| 7290 | HIRA | ATC12 | Human | Thyroid | ATC | 1.49e-07 | -1.49e-01 | 0.34 |
| 7290 | HIRA | ATC13 | Human | Thyroid | ATC | 1.47e-12 | -1.23e-01 | 0.34 |
| 7290 | HIRA | ATC4 | Human | Thyroid | ATC | 1.69e-07 | -1.25e-01 | 0.34 |
| 7290 | HIRA | ATC5 | Human | Thyroid | ATC | 3.23e-08 | -1.02e-01 | 0.34 |
| Page: 1 |
| Tissue | Expression Dynamics | Abbreviation |
| Thyroid | 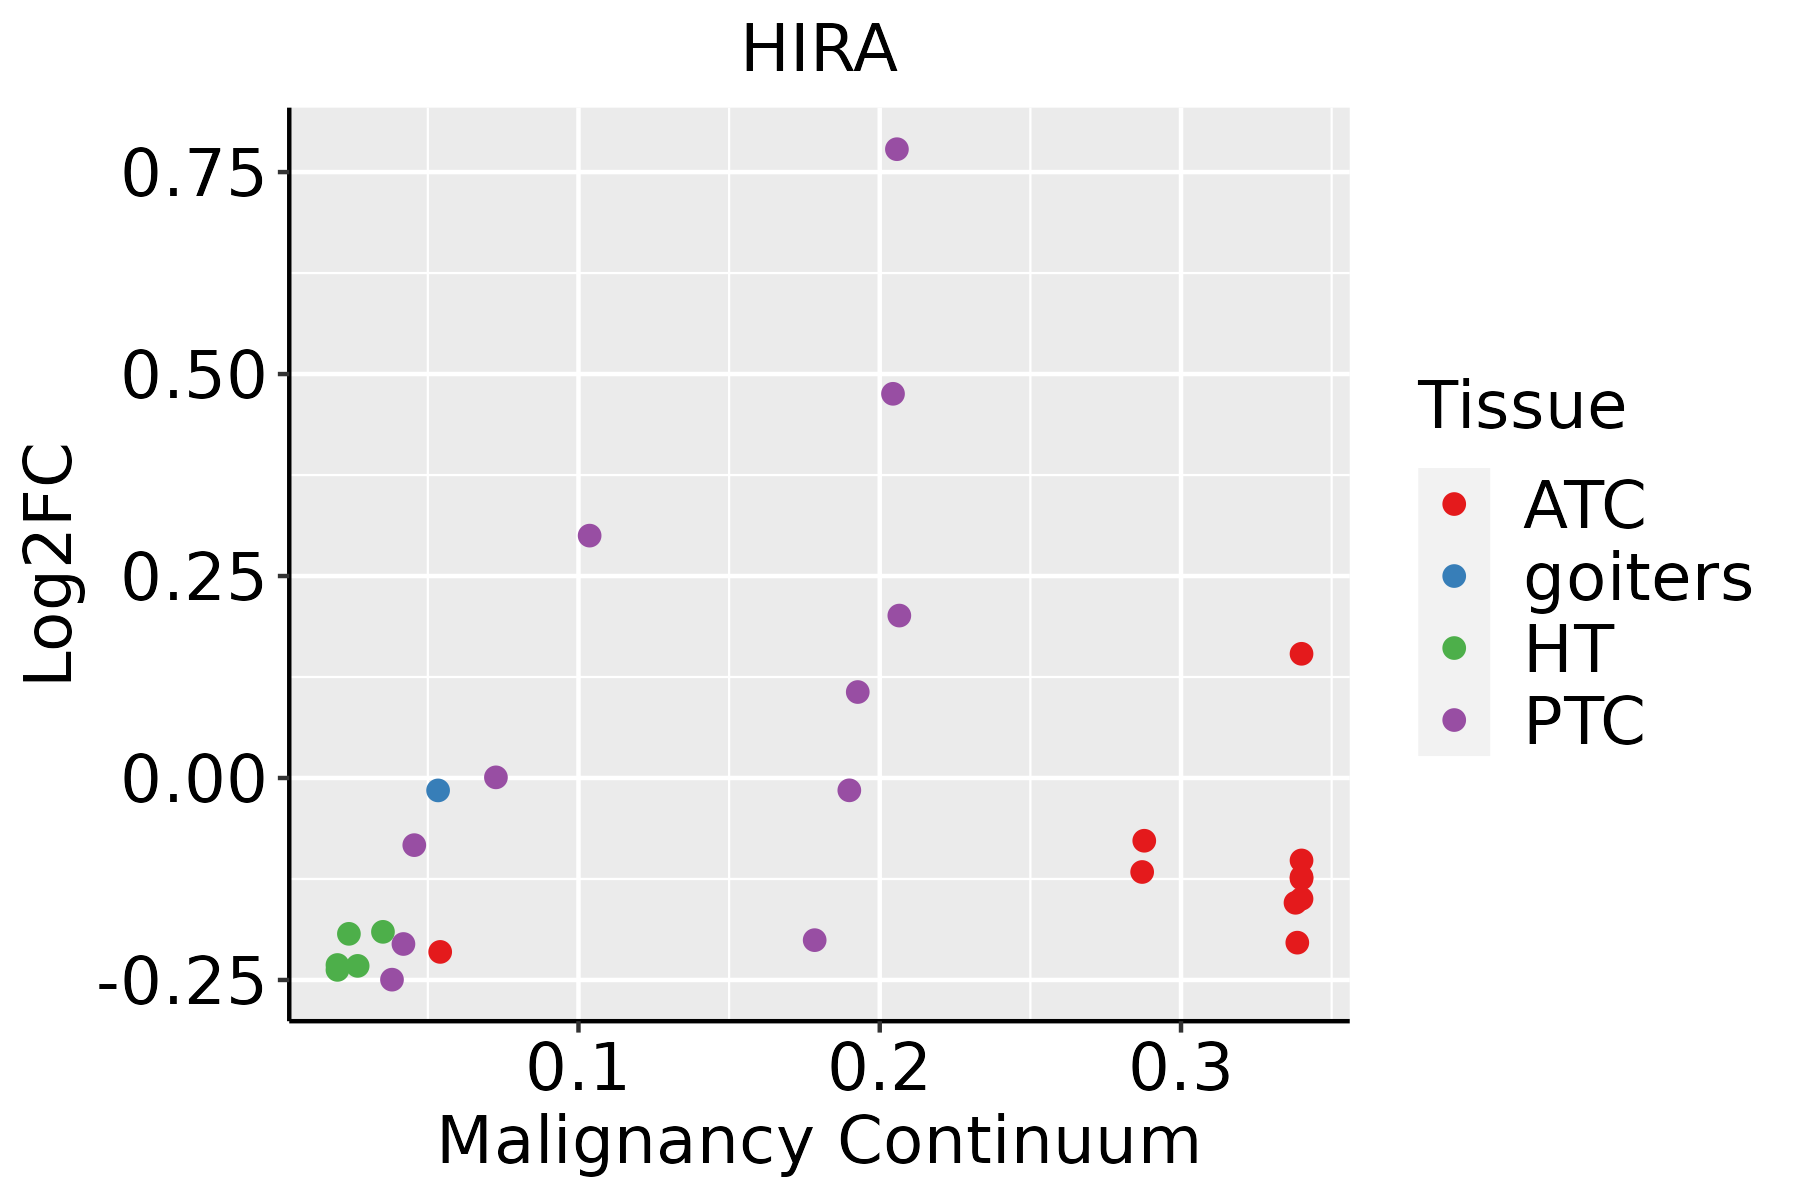 | ATC: Anaplastic thyroid cancer |
| HT: Hashimoto's thyroiditis | ||
| PTC: Papillary thyroid cancer |
| ∗log2FC in expression of this searched gene in stem-like cells from each diseased tissue sample relative to stem-like cells in normal samples in each tissue plotted against the malignancy continuum. Samples are colored based on if they are from different disease stage. |
Top |
Malignant transformation related pathway analysis |
| Find out the enriched GO biological processes and KEGG pathways involved in transition from healthy to precancer to cancer |
| Tissue | Disease Stage | Enriched GO biological Processes |
| Colorectum | AD |  |
| Colorectum | SER |  |
| Colorectum | MSS |  |
| Colorectum | MSI-H |  |
| Colorectum | FAP |  |
| ∗Top 15 enriched GO BP terms are showed in the bar plot of each disease state in each tissue. Each row represents a significant GO biological process which is colored according to the -log10(p.adjust). |
| Page: 1 2 3 4 5 6 7 8 9 |
| GO ID | Tissue | Disease Stage | Description | Gene Ratio | Bg Ratio | pvalue | p.adjust | Count |
| GO:000632520 | Thyroid | PTC | chromatin organization | 183/5968 | 409/18723 | 2.55e-08 | 5.70e-07 | 183 |
| GO:00063385 | Thyroid | PTC | chromatin remodeling | 106/5968 | 255/18723 | 6.56e-04 | 4.13e-03 | 106 |
| GO:0006325110 | Thyroid | ATC | chromatin organization | 189/6293 | 409/18723 | 6.40e-08 | 1.13e-06 | 189 |
| GO:000633813 | Thyroid | ATC | chromatin remodeling | 109/6293 | 255/18723 | 1.38e-03 | 7.15e-03 | 109 |
| GO:00718242 | Thyroid | ATC | protein-DNA complex subunit organization | 103/6293 | 241/18723 | 1.84e-03 | 9.03e-03 | 103 |
| Page: 1 |
| Pathway ID | Tissue | Disease Stage | Description | Gene Ratio | Bg Ratio | pvalue | p.adjust | qvalue | Count |
| Page: 1 |
Top |
Cell-cell communication analysis |
| Identification of potential cell-cell interactions between two cell types and their ligand-receptor pairs for different disease states |
| Ligand | Receptor | LRpair | Pathway | Tissue | Disease Stage |
| Page: 1 |
Top |
Single-cell gene regulatory network inference analysis |
| Find out the significant the regulons (TFs) and the target genes of each regulon across cell types for different disease states |
| TF | Cell Type | Tissue | Disease Stage | Target Gene | RSS | Regulon Activity |
| ∗The dot plots of a searched regulon are shown for all cell subpopulations in each disease state of each tissue based on the regulon specific score inferred using pySCENIC and by calculating the average expression. |
| Page: 1 |
Top |
Somatic mutation of malignant transformation related genes |
| Annotation of somatic variants for genes involved in malignant transformation |
| Hugo Symbol | Variant Class | Variant Classification | dbSNP RS | HGVSc | HGVSp | HGVSp Short | SWISSPROT | BIOTYPE | SIFT | PolyPhen | Tumor Sample Barcode | Tissue | Histology | Sex | Age | Stage | Therapy Types | Drugs | Outcome |
| HIRA | SNV | Missense_Mutation | c.2333N>G | p.Ser778Cys | p.S778C | P54198 | protein_coding | deleterious(0) | probably_damaging(0.946) | TCGA-A2-A0YK-01 | Breast | breast invasive carcinoma | Female | <65 | I/II | Chemotherapy | cytoxan | SD | |
| HIRA | SNV | Missense_Mutation | novel | c.74N>A | p.Gly25Glu | p.G25E | P54198 | protein_coding | tolerated(0.19) | probably_damaging(0.974) | TCGA-A8-A08H-01 | Breast | breast invasive carcinoma | Female | >=65 | I/II | Unknown | Unknown | SD |
| HIRA | SNV | Missense_Mutation | c.302N>T | p.Thr101Met | p.T101M | P54198 | protein_coding | deleterious(0.05) | benign(0.273) | TCGA-D8-A1XQ-01 | Breast | breast invasive carcinoma | Female | >=65 | I/II | Unknown | Unknown | SD | |
| HIRA | deletion | Frame_Shift_Del | novel | c.2416delG | p.Val806LeufsTer3 | p.V806Lfs*3 | P54198 | protein_coding | TCGA-EW-A2FV-01 | Breast | breast invasive carcinoma | Female | <65 | III/IV | Chemotherapy | docetaxel | SD | ||
| HIRA | SNV | Missense_Mutation | c.1846N>C | p.Glu616Gln | p.E616Q | P54198 | protein_coding | tolerated(0.16) | possibly_damaging(0.575) | TCGA-DR-A0ZM-01 | Cervix | cervical & endocervical cancer | Female | <65 | III/IV | Unspecific | Cisplatin | SD | |
| HIRA | SNV | Missense_Mutation | novel | c.499N>G | p.Leu167Val | p.L167V | P54198 | protein_coding | tolerated(1) | benign(0.023) | TCGA-DS-A1OB-01 | Cervix | cervical & endocervical cancer | Female | <65 | I/II | Chemotherapy | carboplatin | PD |
| HIRA | SNV | Missense_Mutation | novel | c.785N>C | p.Met262Thr | p.M262T | P54198 | protein_coding | deleterious(0) | possibly_damaging(0.896) | TCGA-5M-AAT6-01 | Colorectum | colon adenocarcinoma | Female | <65 | III/IV | Unknown | Unknown | PD |
| HIRA | SNV | Missense_Mutation | c.229N>T | p.Arg77Trp | p.R77W | P54198 | protein_coding | deleterious(0) | benign(0.262) | TCGA-A6-A565-01 | Colorectum | colon adenocarcinoma | Female | <65 | III/IV | Unspecific | 5FU | PD | |
| HIRA | SNV | Missense_Mutation | c.1372C>T | p.Arg458Trp | p.R458W | P54198 | protein_coding | deleterious(0) | probably_damaging(0.996) | TCGA-A6-A566-01 | Colorectum | colon adenocarcinoma | Female | <65 | III/IV | Chemotherapy | oxaliplatin | PD | |
| HIRA | SNV | Missense_Mutation | novel | c.1451N>C | p.Leu484Pro | p.L484P | P54198 | protein_coding | tolerated(0.16) | possibly_damaging(0.459) | TCGA-AA-3492-01 | Colorectum | colon adenocarcinoma | Female | >=65 | I/II | Unknown | Unknown | SD |
| Page: 1 2 3 4 5 6 7 8 9 10 |
Top |
Related drugs of malignant transformation related genes |
| Identification of chemicals and drugs interact with genes involved in malignant transfromation |
| (DGIdb 4.0) |
| Entrez ID | Symbol | Category | Interaction Types | Drug Claim Name | Drug Name | PMIDs |
| Page: 1 |

Copyright 2023-Present -The University of Texas Health Science Center at Houston |