
|
|||||
|
 | |
| |
| |
| |
| |
| |
|
Gene: HIPK1 |
Gene summary for HIPK1 |
| Gene information | Species | Human | Gene symbol | HIPK1 | Gene ID | 204851 |
| Gene name | homeodomain interacting protein kinase 1 | |
| Gene Alias | Myak | |
| Cytomap | 1p13.2 | |
| Gene Type | protein-coding | GO ID | GO:0001525 | UniProtAcc | Q86Z02 |
Top |
Malignant transformation analysis |
| Identification of the aberrant gene expression in precancerous and cancerous lesions by comparing the gene expression of stem-like cells in diseased tissues with normal stem cells |
| Entrez ID | Symbol | Replicates | Species | Organ | Tissue | Adj P-value | Log2FC | Malignancy |
| 204851 | HIPK1 | HCC1_Meng | Human | Liver | HCC | 7.37e-56 | 6.43e-02 | 0.0246 |
| 204851 | HIPK1 | HCC2_Meng | Human | Liver | HCC | 9.49e-35 | 3.28e-01 | 0.0107 |
| 204851 | HIPK1 | HCC1 | Human | Liver | HCC | 5.99e-08 | 3.44e+00 | 0.5336 |
| 204851 | HIPK1 | HCC2 | Human | Liver | HCC | 5.39e-20 | 3.88e+00 | 0.5341 |
| 204851 | HIPK1 | Pt13.b | Human | Liver | HCC | 4.76e-09 | 1.19e-01 | 0.0251 |
| 204851 | HIPK1 | S014 | Human | Liver | HCC | 1.38e-10 | 5.00e-01 | 0.2254 |
| 204851 | HIPK1 | S015 | Human | Liver | HCC | 2.40e-10 | 5.90e-01 | 0.2375 |
| 204851 | HIPK1 | S016 | Human | Liver | HCC | 8.64e-12 | 4.84e-01 | 0.2243 |
| 204851 | HIPK1 | S027 | Human | Liver | HCC | 5.23e-07 | 5.81e-01 | 0.2446 |
| 204851 | HIPK1 | S028 | Human | Liver | HCC | 5.14e-12 | 5.38e-01 | 0.2503 |
| 204851 | HIPK1 | S029 | Human | Liver | HCC | 1.82e-13 | 6.07e-01 | 0.2581 |
| 204851 | HIPK1 | Adj_PTCwithHT_8 | Human | Thyroid | HT | 2.36e-02 | -3.05e-01 | 0.0267 |
| 204851 | HIPK1 | PTCwithHT_8 | Human | Thyroid | HT | 1.15e-03 | -2.98e-01 | 0.0351 |
| 204851 | HIPK1 | male-WTA | Human | Thyroid | PTC | 2.39e-28 | 4.75e-02 | 0.1037 |
| 204851 | HIPK1 | PTC01 | Human | Thyroid | PTC | 7.35e-12 | -2.35e-02 | 0.1899 |
| 204851 | HIPK1 | PTC03 | Human | Thyroid | PTC | 5.27e-03 | 3.34e-02 | 0.1784 |
| 204851 | HIPK1 | PTC04 | Human | Thyroid | PTC | 5.40e-22 | 3.89e-01 | 0.1927 |
| 204851 | HIPK1 | PTC05 | Human | Thyroid | PTC | 1.08e-10 | 4.03e-01 | 0.2065 |
| 204851 | HIPK1 | PTC06 | Human | Thyroid | PTC | 1.01e-27 | 6.12e-01 | 0.2057 |
| 204851 | HIPK1 | PTC07 | Human | Thyroid | PTC | 7.69e-25 | 4.35e-01 | 0.2044 |
| Page: 1 2 |
| Tissue | Expression Dynamics | Abbreviation |
| Liver |  | HCC: Hepatocellular carcinoma |
| NAFLD: Non-alcoholic fatty liver disease | ||
| Thyroid | 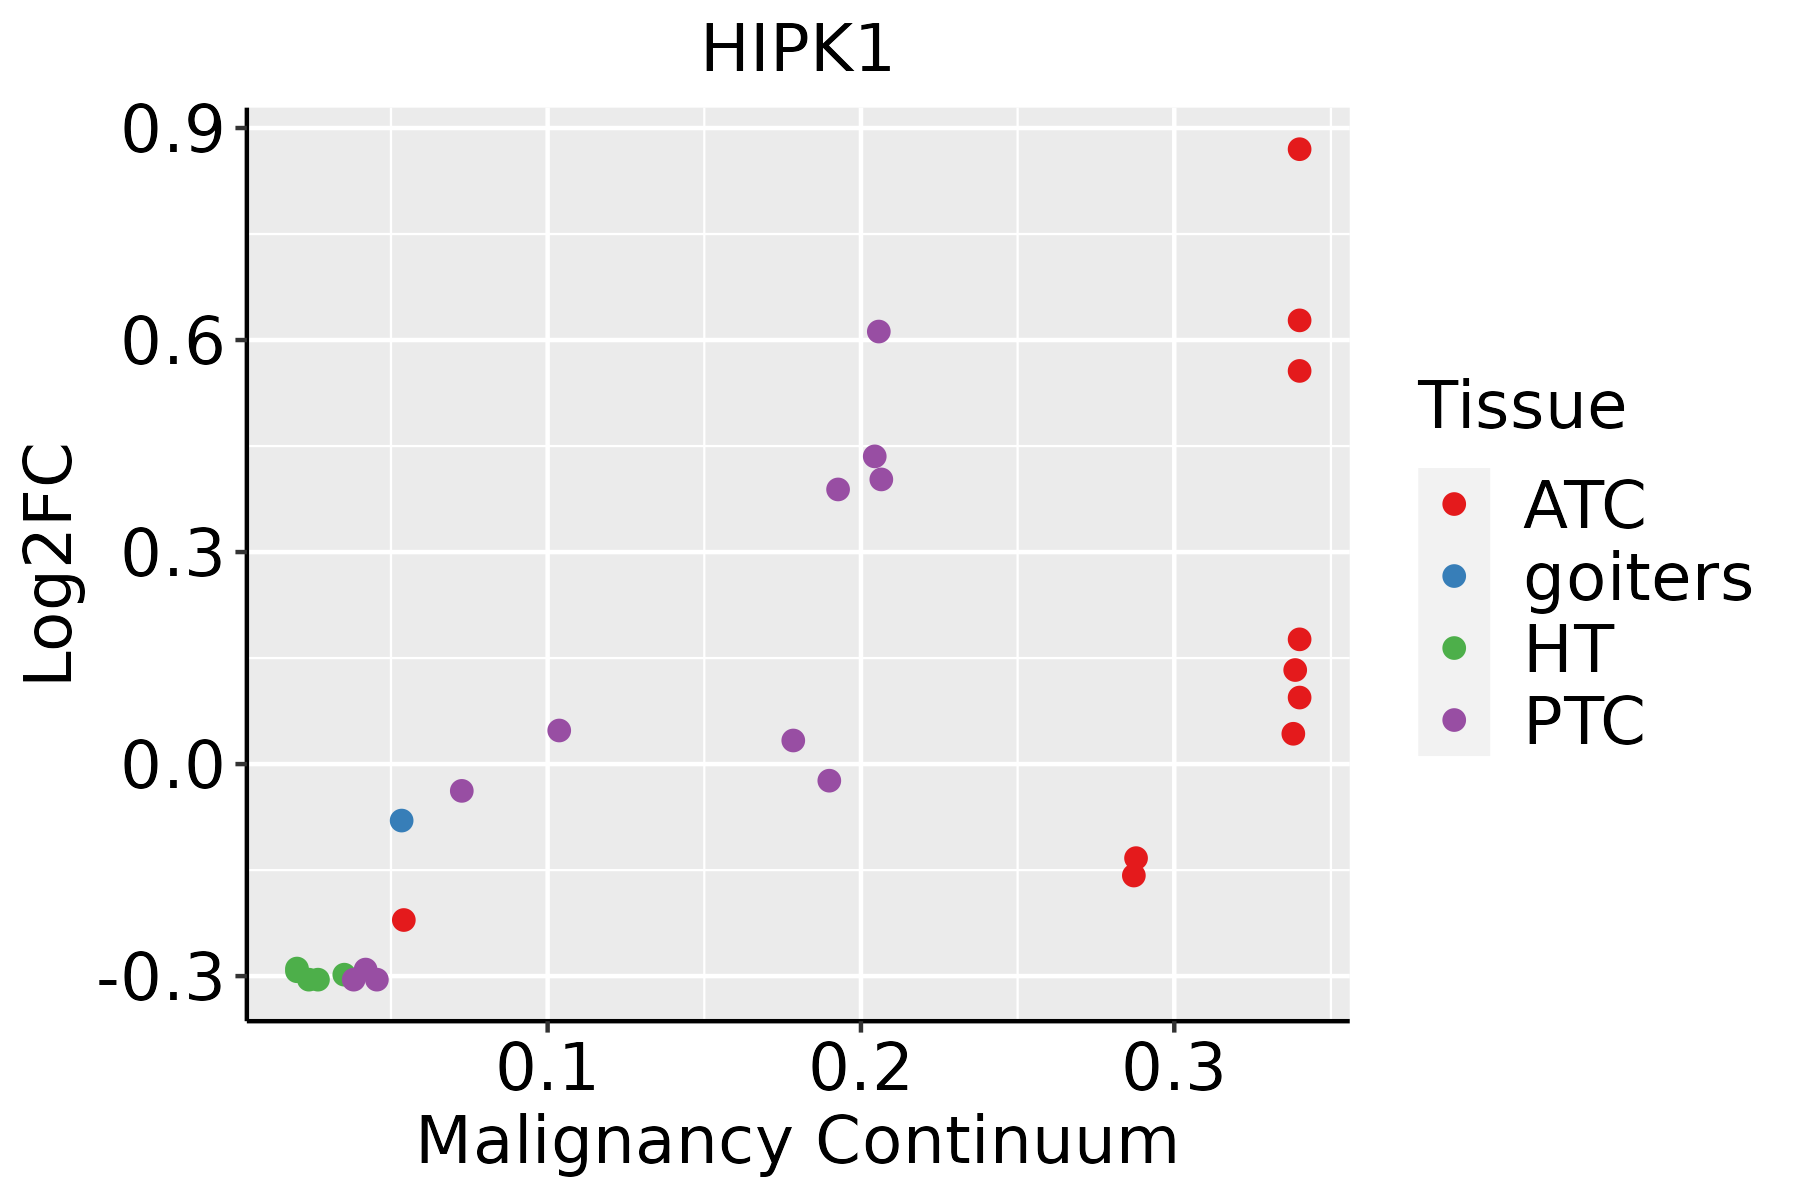 | ATC: Anaplastic thyroid cancer |
| HT: Hashimoto's thyroiditis | ||
| PTC: Papillary thyroid cancer |
| ∗log2FC in expression of this searched gene in stem-like cells from each diseased tissue sample relative to stem-like cells in normal samples in each tissue plotted against the malignancy continuum. Samples are colored based on if they are from different disease stage. |
Top |
Malignant transformation related pathway analysis |
| Find out the enriched GO biological processes and KEGG pathways involved in transition from healthy to precancer to cancer |
| Tissue | Disease Stage | Enriched GO biological Processes |
| Colorectum | AD |  |
| Colorectum | SER |  |
| Colorectum | MSS |  |
| Colorectum | MSI-H |  |
| Colorectum | FAP |  |
| ∗Top 15 enriched GO BP terms are showed in the bar plot of each disease state in each tissue. Each row represents a significant GO biological process which is colored according to the -log10(p.adjust). |
| Page: 1 2 3 4 5 6 7 8 9 |
| GO ID | Tissue | Disease Stage | Description | Gene Ratio | Bg Ratio | pvalue | p.adjust | Count |
| GO:009719322 | Liver | HCC | intrinsic apoptotic signaling pathway | 184/7958 | 288/18723 | 1.50e-13 | 8.32e-12 | 184 |
| GO:009719122 | Liver | HCC | extrinsic apoptotic signaling pathway | 143/7958 | 219/18723 | 6.99e-12 | 2.97e-10 | 143 |
| GO:007233122 | Liver | HCC | signal transduction by p53 class mediator | 108/7958 | 163/18723 | 7.14e-10 | 2.23e-08 | 108 |
| GO:007233212 | Liver | HCC | intrinsic apoptotic signaling pathway by p53 class mediator | 51/7958 | 76/18723 | 1.27e-05 | 1.42e-04 | 51 |
| GO:001810511 | Liver | HCC | peptidyl-serine phosphorylation | 169/7958 | 315/18723 | 3.86e-05 | 3.81e-04 | 169 |
| GO:001820911 | Liver | HCC | peptidyl-serine modification | 177/7958 | 338/18723 | 1.45e-04 | 1.17e-03 | 177 |
| GO:001810711 | Liver | HCC | peptidyl-threonine phosphorylation | 68/7958 | 116/18723 | 3.31e-04 | 2.33e-03 | 68 |
| GO:001821011 | Liver | HCC | peptidyl-threonine modification | 71/7958 | 125/18723 | 8.68e-04 | 5.14e-03 | 71 |
| GO:000863011 | Liver | HCC | intrinsic apoptotic signaling pathway in response to DNA damage | 58/7958 | 99/18723 | 8.97e-04 | 5.29e-03 | 58 |
| GO:004521622 | Liver | HCC | cell-cell junction organization | 107/7958 | 200/18723 | 1.06e-03 | 6.11e-03 | 107 |
| GO:003461211 | Liver | HCC | response to tumor necrosis factor | 132/7958 | 253/18723 | 1.14e-03 | 6.48e-03 | 132 |
| GO:004277111 | Liver | HCC | intrinsic apoptotic signaling pathway in response to DNA damage by p53 class mediator | 28/7958 | 43/18723 | 2.30e-03 | 1.14e-02 | 28 |
| GO:003433211 | Liver | HCC | adherens junction organization | 30/7958 | 49/18723 | 6.31e-03 | 2.57e-02 | 30 |
| GO:007135611 | Liver | HCC | cellular response to tumor necrosis factor | 115/7958 | 229/18723 | 1.08e-02 | 3.99e-02 | 115 |
| GO:000704312 | Liver | HCC | cell-cell junction assembly | 76/7958 | 146/18723 | 1.23e-02 | 4.47e-02 | 76 |
| GO:009719330 | Thyroid | HT | intrinsic apoptotic signaling pathway | 52/1272 | 288/18723 | 7.65e-11 | 1.06e-08 | 52 |
| GO:007233130 | Thyroid | HT | signal transduction by p53 class mediator | 31/1272 | 163/18723 | 1.52e-07 | 8.45e-06 | 31 |
| GO:004521628 | Thyroid | HT | cell-cell junction organization | 34/1272 | 200/18723 | 6.26e-07 | 2.62e-05 | 34 |
| GO:009719129 | Thyroid | HT | extrinsic apoptotic signaling pathway | 36/1272 | 219/18723 | 6.85e-07 | 2.80e-05 | 36 |
| GO:007233229 | Thyroid | HT | intrinsic apoptotic signaling pathway by p53 class mediator | 17/1272 | 76/18723 | 1.04e-05 | 2.81e-04 | 17 |
| Page: 1 2 3 4 5 |
| Pathway ID | Tissue | Disease Stage | Description | Gene Ratio | Bg Ratio | pvalue | p.adjust | qvalue | Count |
| hsa0421822 | Liver | HCC | Cellular senescence | 102/4020 | 156/8465 | 4.18e-06 | 3.59e-05 | 2.00e-05 | 102 |
| hsa0421832 | Liver | HCC | Cellular senescence | 102/4020 | 156/8465 | 4.18e-06 | 3.59e-05 | 2.00e-05 | 102 |
| Page: 1 |
Top |
Cell-cell communication analysis |
| Identification of potential cell-cell interactions between two cell types and their ligand-receptor pairs for different disease states |
| Ligand | Receptor | LRpair | Pathway | Tissue | Disease Stage |
| Page: 1 |
Top |
Single-cell gene regulatory network inference analysis |
| Find out the significant the regulons (TFs) and the target genes of each regulon across cell types for different disease states |
| TF | Cell Type | Tissue | Disease Stage | Target Gene | RSS | Regulon Activity |
| ∗The dot plots of a searched regulon are shown for all cell subpopulations in each disease state of each tissue based on the regulon specific score inferred using pySCENIC and by calculating the average expression. |
| Page: 1 |
Top |
Somatic mutation of malignant transformation related genes |
| Annotation of somatic variants for genes involved in malignant transformation |
| Hugo Symbol | Variant Class | Variant Classification | dbSNP RS | HGVSc | HGVSp | HGVSp Short | SWISSPROT | BIOTYPE | SIFT | PolyPhen | Tumor Sample Barcode | Tissue | Histology | Sex | Age | Stage | Therapy Types | Drugs | Outcome |
| HIPK1 | SNV | Missense_Mutation | c.2477N>G | p.Asn826Ser | p.N826S | Q86Z02 | protein_coding | tolerated(0.61) | probably_damaging(0.931) | TCGA-A2-A04P-01 | Breast | breast invasive carcinoma | Female | <65 | III/IV | Chemotherapy | taxol | PD | |
| HIPK1 | SNV | Missense_Mutation | c.3445C>G | p.Pro1149Ala | p.P1149A | Q86Z02 | protein_coding | tolerated(0.1) | probably_damaging(0.986) | TCGA-AC-A23H-01 | Breast | breast invasive carcinoma | Female | >=65 | I/II | Unknown | Unknown | PD | |
| HIPK1 | SNV | Missense_Mutation | c.124N>G | p.Tyr42Asp | p.Y42D | Q86Z02 | protein_coding | deleterious(0.04) | probably_damaging(0.979) | TCGA-AO-A124-01 | Breast | breast invasive carcinoma | Female | <65 | I/II | Chemotherapy | doxorubicin | SD | |
| HIPK1 | SNV | Missense_Mutation | rs142071670 | c.3566G>A | p.Arg1189Gln | p.R1189Q | Q86Z02 | protein_coding | tolerated(0.15) | benign(0.007) | TCGA-AR-A24N-01 | Breast | breast invasive carcinoma | Female | <65 | I/II | Unknown | Unknown | SD |
| HIPK1 | SNV | Missense_Mutation | c.433N>G | p.Leu145Val | p.L145V | Q86Z02 | protein_coding | tolerated(0.37) | benign(0.162) | TCGA-B6-A0RV-01 | Breast | breast invasive carcinoma | Female | <65 | III/IV | Unknown | Unknown | SD | |
| HIPK1 | SNV | Missense_Mutation | novel | c.1930N>G | p.Gln644Glu | p.Q644E | Q86Z02 | protein_coding | tolerated(0.13) | possibly_damaging(0.585) | TCGA-BH-A0B6-01 | Breast | breast invasive carcinoma | Female | <65 | I/II | Unknown | Unknown | SD |
| HIPK1 | insertion | Frame_Shift_Ins | novel | c.967_968insCA | p.Leu323ProfsTer12 | p.L323Pfs*12 | Q86Z02 | protein_coding | TCGA-A2-A0EY-01 | Breast | breast invasive carcinoma | Female | <65 | I/II | Chemotherapy | adriamycin | SD | ||
| HIPK1 | insertion | Nonsense_Mutation | novel | c.968_969insATTTTTCTGCTAACTTTCCTC | p.Leu323_Val324insPhePheCysTerLeuSerSer | p.L323_V324insFFC*LSS | Q86Z02 | protein_coding | TCGA-A2-A0EY-01 | Breast | breast invasive carcinoma | Female | <65 | I/II | Chemotherapy | adriamycin | SD | ||
| HIPK1 | insertion | Nonsense_Mutation | novel | c.1022_1023insAGTGCGAAGAAACTGAAAA | p.Ser342ValfsTer5 | p.S342Vfs*5 | Q86Z02 | protein_coding | TCGA-A8-A07G-01 | Breast | breast invasive carcinoma | Female | >=65 | I/II | Chemotherapy | 5-fluorouracil | CR | ||
| HIPK1 | insertion | Frame_Shift_Ins | novel | c.1024_1025insGAGCCCTCTGGCTG | p.Ser342ArgfsTer45 | p.S342Rfs*45 | Q86Z02 | protein_coding | TCGA-A8-A07G-01 | Breast | breast invasive carcinoma | Female | >=65 | I/II | Chemotherapy | 5-fluorouracil | CR |
| Page: 1 2 3 4 5 6 7 8 9 10 11 12 13 |
Top |
Related drugs of malignant transformation related genes |
| Identification of chemicals and drugs interact with genes involved in malignant transfromation |
| (DGIdb 4.0) |
| Entrez ID | Symbol | Category | Interaction Types | Drug Claim Name | Drug Name | PMIDs |
| 204851 | HIPK1 | TRANSCRIPTION FACTOR, KINASE, TYROSINE KINASE, SERINE THREONINE KINASE, ENZYME, DRUGGABLE GENOME | inhibitor | 135652717 | STAUROSPORINE |
| Page: 1 |

Copyright 2023-Present -The University of Texas Health Science Center at Houston |