
|
|||||
|
 | |
| |
| |
| |
| |
| |
|
Gene: HIP1R |
Gene summary for HIP1R |
| Gene information | Species | Human | Gene symbol | HIP1R | Gene ID | 9026 |
| Gene name | huntingtin interacting protein 1 related | |
| Gene Alias | HIP12 | |
| Cytomap | 12q24.31 | |
| Gene Type | protein-coding | GO ID | GO:0001696 | UniProtAcc | B3KQW8 |
Top |
Malignant transformation analysis |
| Identification of the aberrant gene expression in precancerous and cancerous lesions by comparing the gene expression of stem-like cells in diseased tissues with normal stem cells |
| Entrez ID | Symbol | Replicates | Species | Organ | Tissue | Adj P-value | Log2FC | Malignancy |
| 9026 | HIP1R | LZE5T | Human | Esophagus | ESCC | 7.82e-03 | 3.46e-01 | 0.0514 |
| 9026 | HIP1R | LZE7T | Human | Esophagus | ESCC | 4.47e-04 | 2.75e-01 | 0.0667 |
| 9026 | HIP1R | LZE20T | Human | Esophagus | ESCC | 3.71e-06 | 1.65e-01 | 0.0662 |
| 9026 | HIP1R | LZE24T | Human | Esophagus | ESCC | 2.89e-14 | 3.54e-01 | 0.0596 |
| 9026 | HIP1R | LZE21T | Human | Esophagus | ESCC | 1.13e-04 | 3.65e-01 | 0.0655 |
| 9026 | HIP1R | P1T-E | Human | Esophagus | ESCC | 2.93e-13 | 5.13e-01 | 0.0875 |
| 9026 | HIP1R | P2T-E | Human | Esophagus | ESCC | 5.73e-26 | 5.53e-01 | 0.1177 |
| 9026 | HIP1R | P4T-E | Human | Esophagus | ESCC | 1.92e-10 | 2.49e-01 | 0.1323 |
| 9026 | HIP1R | P5T-E | Human | Esophagus | ESCC | 1.69e-18 | 4.14e-01 | 0.1327 |
| 9026 | HIP1R | P8T-E | Human | Esophagus | ESCC | 4.42e-24 | 4.96e-01 | 0.0889 |
| 9026 | HIP1R | P9T-E | Human | Esophagus | ESCC | 1.65e-03 | 1.39e-01 | 0.1131 |
| 9026 | HIP1R | P10T-E | Human | Esophagus | ESCC | 4.44e-08 | 1.23e-01 | 0.116 |
| 9026 | HIP1R | P11T-E | Human | Esophagus | ESCC | 2.26e-07 | 3.98e-01 | 0.1426 |
| 9026 | HIP1R | P12T-E | Human | Esophagus | ESCC | 2.81e-16 | 3.20e-01 | 0.1122 |
| 9026 | HIP1R | P15T-E | Human | Esophagus | ESCC | 1.40e-14 | 3.38e-01 | 0.1149 |
| 9026 | HIP1R | P16T-E | Human | Esophagus | ESCC | 3.26e-15 | 2.36e-01 | 0.1153 |
| 9026 | HIP1R | P17T-E | Human | Esophagus | ESCC | 7.22e-10 | 4.00e-01 | 0.1278 |
| 9026 | HIP1R | P20T-E | Human | Esophagus | ESCC | 3.11e-09 | 2.71e-01 | 0.1124 |
| 9026 | HIP1R | P21T-E | Human | Esophagus | ESCC | 3.24e-28 | 5.04e-01 | 0.1617 |
| 9026 | HIP1R | P22T-E | Human | Esophagus | ESCC | 5.12e-05 | 1.10e-01 | 0.1236 |
| Page: 1 2 3 4 5 |
| Tissue | Expression Dynamics | Abbreviation |
| Esophagus | 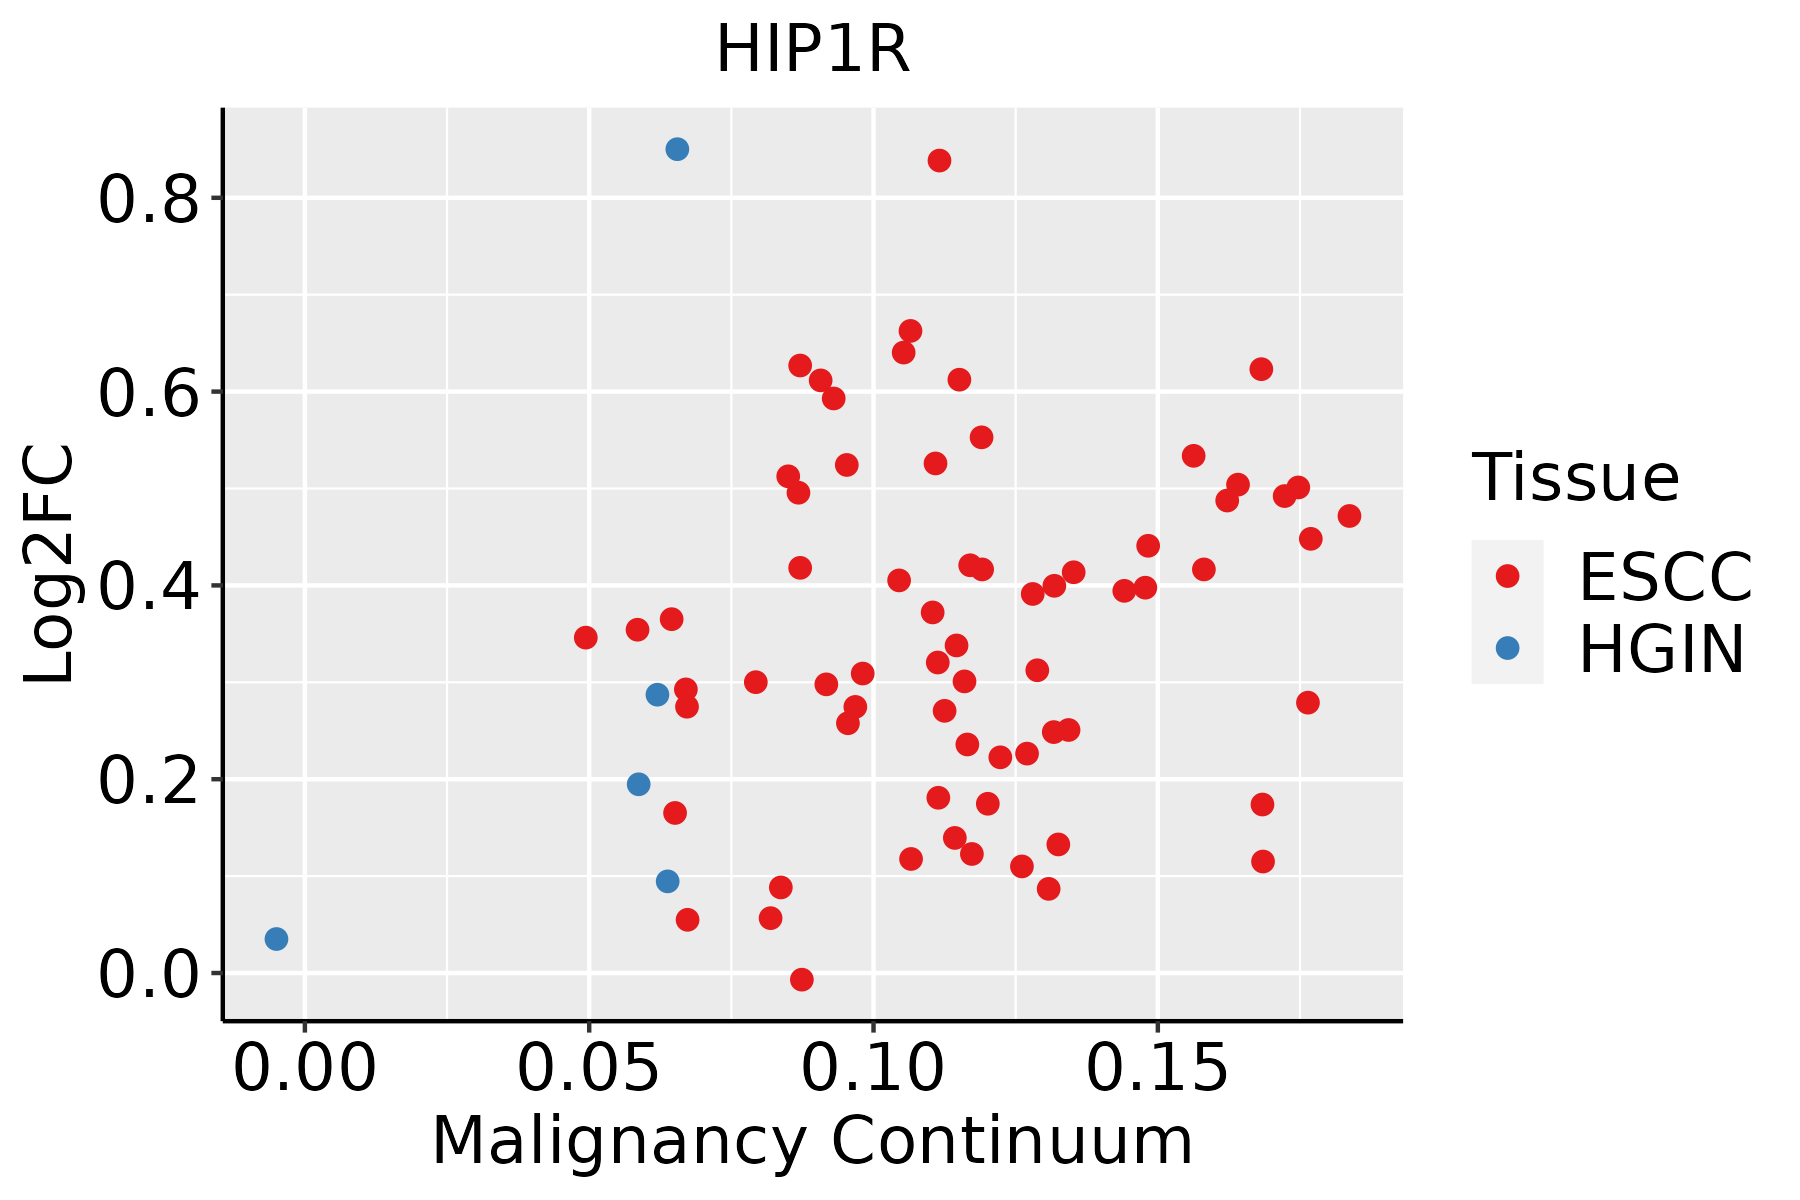 | ESCC: Esophageal squamous cell carcinoma |
| HGIN: High-grade intraepithelial neoplasias | ||
| LGIN: Low-grade intraepithelial neoplasias | ||
| Liver |  | HCC: Hepatocellular carcinoma |
| NAFLD: Non-alcoholic fatty liver disease | ||
| Oral Cavity | 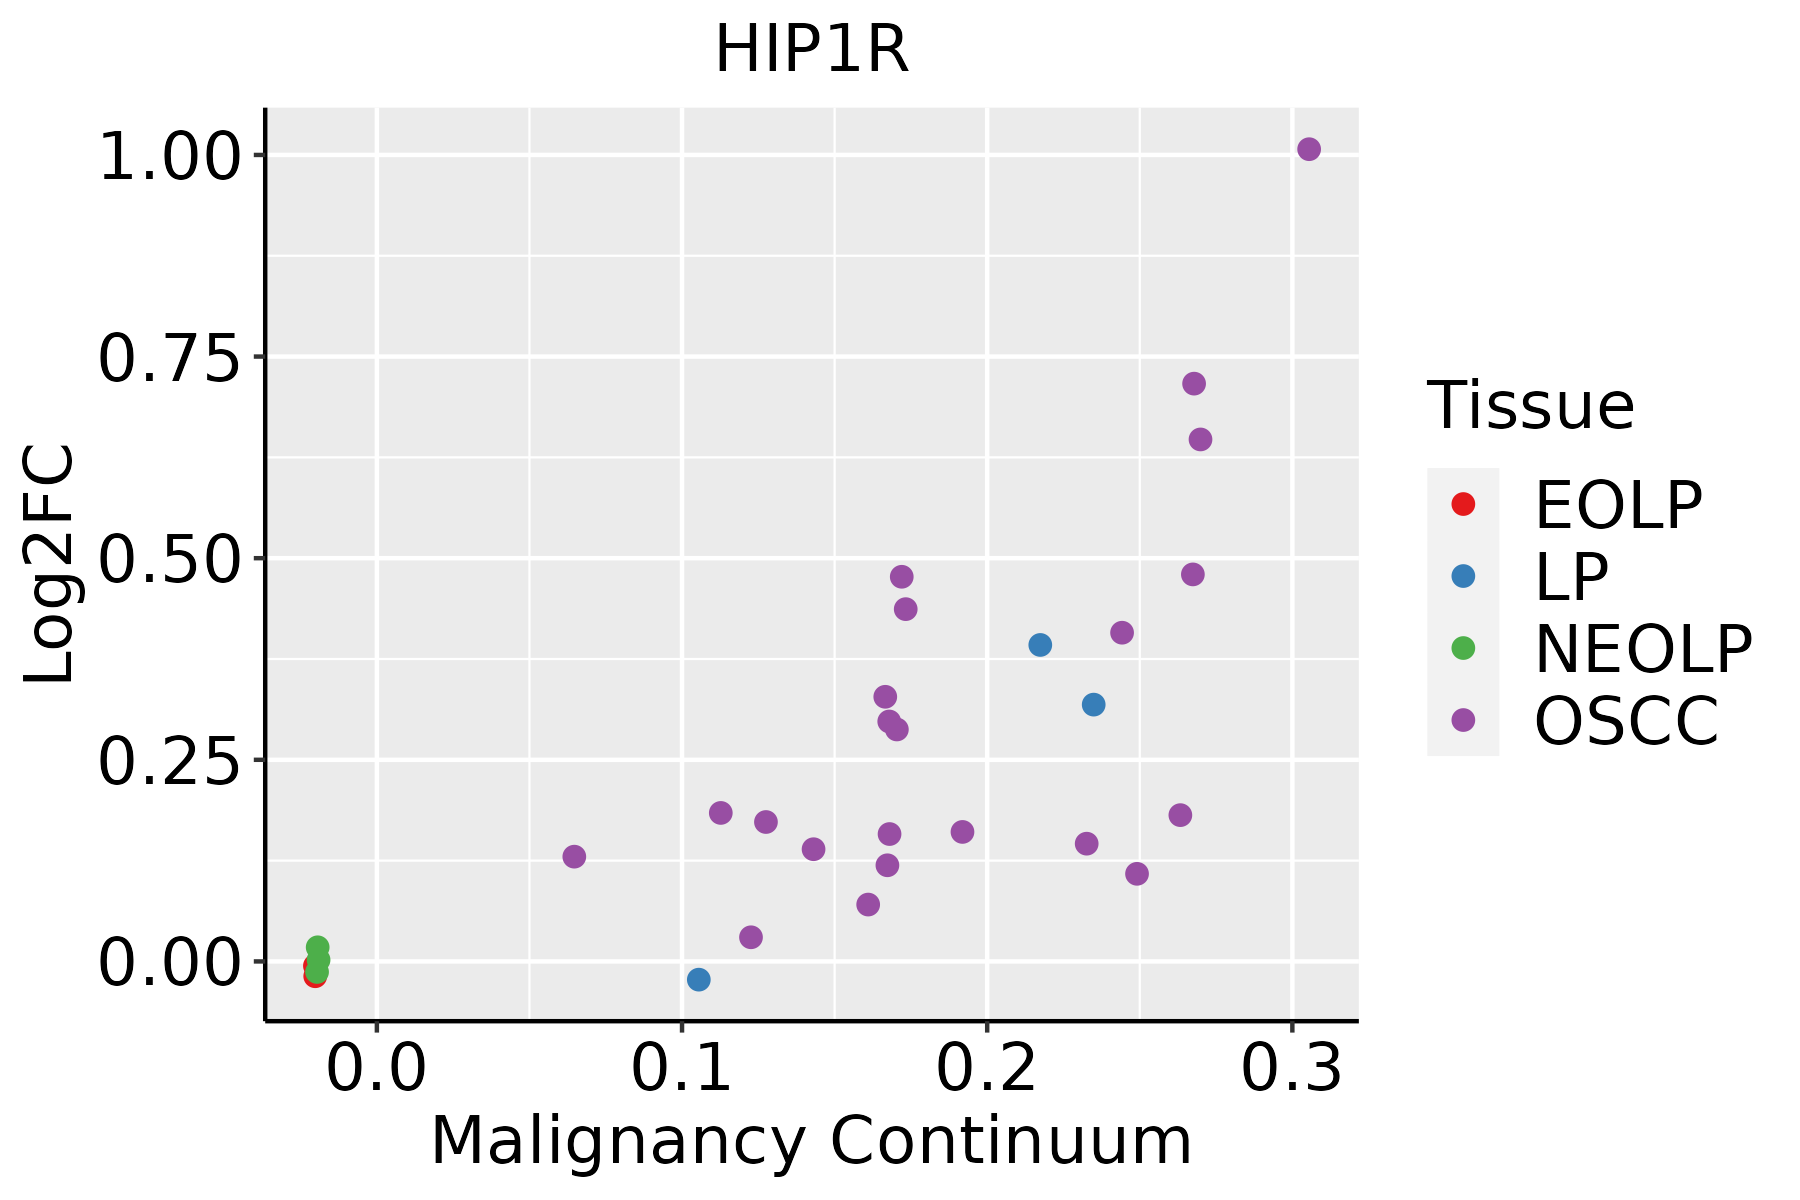 | EOLP: Erosive Oral lichen planus |
| LP: leukoplakia | ||
| NEOLP: Non-erosive oral lichen planus | ||
| OSCC: Oral squamous cell carcinoma |
| ∗log2FC in expression of this searched gene in stem-like cells from each diseased tissue sample relative to stem-like cells in normal samples in each tissue plotted against the malignancy continuum. Samples are colored based on if they are from different disease stage. |
Top |
Malignant transformation related pathway analysis |
| Find out the enriched GO biological processes and KEGG pathways involved in transition from healthy to precancer to cancer |
| Tissue | Disease Stage | Enriched GO biological Processes |
| Colorectum | AD |  |
| Colorectum | SER |  |
| Colorectum | MSS |  |
| Colorectum | MSI-H |  |
| Colorectum | FAP |  |
| ∗Top 15 enriched GO BP terms are showed in the bar plot of each disease state in each tissue. Each row represents a significant GO biological process which is colored according to the -log10(p.adjust). |
| Page: 1 2 3 4 5 6 7 8 9 |
| GO ID | Tissue | Disease Stage | Description | Gene Ratio | Bg Ratio | pvalue | p.adjust | Count |
| GO:0031647111 | Esophagus | ESCC | regulation of protein stability | 223/8552 | 298/18723 | 5.76e-25 | 1.52e-22 | 223 |
| GO:0051098111 | Esophagus | ESCC | regulation of binding | 251/8552 | 363/18723 | 6.73e-20 | 8.46e-18 | 251 |
| GO:0045862111 | Esophagus | ESCC | positive regulation of proteolysis | 256/8552 | 372/18723 | 7.88e-20 | 9.43e-18 | 256 |
| GO:0006839110 | Esophagus | ESCC | mitochondrial transport | 187/8552 | 254/18723 | 8.35e-20 | 9.81e-18 | 187 |
| GO:0043254111 | Esophagus | ESCC | regulation of protein-containing complex assembly | 278/8552 | 428/18723 | 3.81e-16 | 2.77e-14 | 278 |
| GO:0050821111 | Esophagus | ESCC | protein stabilization | 140/8552 | 191/18723 | 6.50e-15 | 3.61e-13 | 140 |
| GO:0031334111 | Esophagus | ESCC | positive regulation of protein-containing complex assembly | 166/8552 | 237/18723 | 2.06e-14 | 1.07e-12 | 166 |
| GO:000700619 | Esophagus | ESCC | mitochondrial membrane organization | 93/8552 | 116/18723 | 2.16e-14 | 1.11e-12 | 93 |
| GO:0010821110 | Esophagus | ESCC | regulation of mitochondrion organization | 107/8552 | 144/18723 | 2.31e-12 | 9.41e-11 | 107 |
| GO:0008637110 | Esophagus | ESCC | apoptotic mitochondrial changes | 83/8552 | 107/18723 | 1.43e-11 | 5.08e-10 | 83 |
| GO:2000116111 | Esophagus | ESCC | regulation of cysteine-type endopeptidase activity | 158/8552 | 235/18723 | 1.67e-11 | 5.90e-10 | 158 |
| GO:0043281111 | Esophagus | ESCC | regulation of cysteine-type endopeptidase activity involved in apoptotic process | 143/8552 | 209/18723 | 2.12e-11 | 7.31e-10 | 143 |
| GO:0051099111 | Esophagus | ESCC | positive regulation of binding | 122/8552 | 173/18723 | 2.79e-11 | 9.45e-10 | 122 |
| GO:004339320 | Esophagus | ESCC | regulation of protein binding | 135/8552 | 196/18723 | 3.69e-11 | 1.22e-09 | 135 |
| GO:1902905111 | Esophagus | ESCC | positive regulation of supramolecular fiber organization | 142/8552 | 209/18723 | 5.51e-11 | 1.76e-09 | 142 |
| GO:1902903111 | Esophagus | ESCC | regulation of supramolecular fiber organization | 237/8552 | 383/18723 | 9.06e-11 | 2.75e-09 | 237 |
| GO:0010952111 | Esophagus | ESCC | positive regulation of peptidase activity | 133/8552 | 197/18723 | 4.31e-10 | 1.14e-08 | 133 |
| GO:0052547111 | Esophagus | ESCC | regulation of peptidase activity | 275/8552 | 461/18723 | 7.54e-10 | 1.88e-08 | 275 |
| GO:0010639110 | Esophagus | ESCC | negative regulation of organelle organization | 215/8552 | 348/18723 | 8.20e-10 | 2.01e-08 | 215 |
| GO:005149520 | Esophagus | ESCC | positive regulation of cytoskeleton organization | 147/8552 | 226/18723 | 2.93e-09 | 6.38e-08 | 147 |
| Page: 1 2 3 4 5 6 7 8 9 10 11 12 13 |
| Pathway ID | Tissue | Disease Stage | Description | Gene Ratio | Bg Ratio | pvalue | p.adjust | qvalue | Count |
| Page: 1 |
Top |
Cell-cell communication analysis |
| Identification of potential cell-cell interactions between two cell types and their ligand-receptor pairs for different disease states |
| Ligand | Receptor | LRpair | Pathway | Tissue | Disease Stage |
| Page: 1 |
Top |
Single-cell gene regulatory network inference analysis |
| Find out the significant the regulons (TFs) and the target genes of each regulon across cell types for different disease states |
| TF | Cell Type | Tissue | Disease Stage | Target Gene | RSS | Regulon Activity |
| ∗The dot plots of a searched regulon are shown for all cell subpopulations in each disease state of each tissue based on the regulon specific score inferred using pySCENIC and by calculating the average expression. |
| Page: 1 |
Top |
Somatic mutation of malignant transformation related genes |
| Annotation of somatic variants for genes involved in malignant transformation |
| Hugo Symbol | Variant Class | Variant Classification | dbSNP RS | HGVSc | HGVSp | HGVSp Short | SWISSPROT | BIOTYPE | SIFT | PolyPhen | Tumor Sample Barcode | Tissue | Histology | Sex | Age | Stage | Therapy Types | Drugs | Outcome |
| HIP1R | SNV | Missense_Mutation | rs771199833 | c.2192N>T | p.Arg731Leu | p.R731L | O75146 | protein_coding | deleterious(0.02) | benign(0.001) | TCGA-A7-A3RF-01 | Breast | breast invasive carcinoma | Female | >=65 | I/II | Hormone Therapy | anastrozole | PD |
| HIP1R | SNV | Missense_Mutation | c.2901T>G | p.Asp967Glu | p.D967E | O75146 | protein_coding | deleterious(0.03) | probably_damaging(0.998) | TCGA-E2-A1B4-01 | Breast | breast invasive carcinoma | Female | >=65 | III/IV | Hormone Therapy | arimidex | SD | |
| HIP1R | SNV | Missense_Mutation | rs749155510 | c.1696N>T | p.Arg566Trp | p.R566W | O75146 | protein_coding | deleterious(0.01) | possibly_damaging(0.677) | TCGA-2W-A8YY-01 | Cervix | cervical & endocervical cancer | Female | <65 | I/II | Chemotherapy | cisplatin | CR |
| HIP1R | insertion | Frame_Shift_Ins | novel | c.2349_2350insCTGG | p.Asp784LeufsTer13 | p.D784Lfs*13 | O75146 | protein_coding | TCGA-DS-A1OA-01 | Cervix | cervical & endocervical cancer | Female | >=65 | I/II | Chemotherapy | carboplatin | PD | ||
| HIP1R | insertion | Frame_Shift_Ins | novel | c.2351_2352insAAGC | p.Asp784GlufsTer13 | p.D784Efs*13 | O75146 | protein_coding | TCGA-DS-A1OA-01 | Cervix | cervical & endocervical cancer | Female | >=65 | I/II | Chemotherapy | carboplatin | PD | ||
| HIP1R | SNV | Missense_Mutation | rs375128048 | c.374N>A | p.Arg125His | p.R125H | O75146 | protein_coding | tolerated(0.08) | possibly_damaging(0.708) | TCGA-5M-AAT6-01 | Colorectum | colon adenocarcinoma | Female | <65 | III/IV | Unknown | Unknown | PD |
| HIP1R | SNV | Missense_Mutation | rs752398981 | c.1888G>A | p.Glu630Lys | p.E630K | O75146 | protein_coding | deleterious(0.01) | possibly_damaging(0.701) | TCGA-AA-3492-01 | Colorectum | colon adenocarcinoma | Female | >=65 | I/II | Unknown | Unknown | SD |
| HIP1R | SNV | Missense_Mutation | rs185463143 | c.1801C>T | p.Arg601Trp | p.R601W | O75146 | protein_coding | deleterious(0.02) | possibly_damaging(0.462) | TCGA-AA-3663-01 | Colorectum | colon adenocarcinoma | Male | <65 | I/II | Unknown | Unknown | SD |
| HIP1R | SNV | Missense_Mutation | rs756668419 | c.842G>A | p.Arg281Gln | p.R281Q | O75146 | protein_coding | tolerated(1) | benign(0.013) | TCGA-AA-3947-01 | Colorectum | colon adenocarcinoma | Female | <65 | I/II | Unknown | Unknown | SD |
| HIP1R | SNV | Missense_Mutation | rs140673904 | c.3068C>T | p.Ala1023Val | p.A1023V | O75146 | protein_coding | tolerated(0.27) | benign(0.013) | TCGA-AA-3947-01 | Colorectum | colon adenocarcinoma | Female | <65 | I/II | Unknown | Unknown | SD |
| Page: 1 2 3 4 5 6 7 8 |
Top |
Related drugs of malignant transformation related genes |
| Identification of chemicals and drugs interact with genes involved in malignant transfromation |
| (DGIdb 4.0) |
| Entrez ID | Symbol | Category | Interaction Types | Drug Claim Name | Drug Name | PMIDs |
| Page: 1 |

Copyright 2023-Present -The University of Texas Health Science Center at Houston |