
|
|||||
|
 | |
| |
| |
| |
| |
| |
|
Gene: HINT1 |
Gene summary for HINT1 |
| Gene information | Species | Human | Gene symbol | HINT1 | Gene ID | 3094 |
| Gene name | histidine triad nucleotide binding protein 1 | |
| Gene Alias | HINT | |
| Cytomap | 5q23.3 | |
| Gene Type | protein-coding | GO ID | GO:0006139 | UniProtAcc | P49773 |
Top |
Malignant transformation analysis |
| Identification of the aberrant gene expression in precancerous and cancerous lesions by comparing the gene expression of stem-like cells in diseased tissues with normal stem cells |
| Entrez ID | Symbol | Replicates | Species | Organ | Tissue | Adj P-value | Log2FC | Malignancy |
| 3094 | HINT1 | GSM4909280 | Human | Breast | Precancer | 2.31e-02 | -5.60e-01 | 0.0305 |
| 3094 | HINT1 | GSM4909285 | Human | Breast | IDC | 1.54e-05 | 2.15e-01 | 0.21 |
| 3094 | HINT1 | GSM4909286 | Human | Breast | IDC | 2.68e-05 | -3.09e-02 | 0.1081 |
| 3094 | HINT1 | GSM4909288 | Human | Breast | IDC | 3.19e-05 | 6.92e-02 | 0.0988 |
| 3094 | HINT1 | GSM4909291 | Human | Breast | IDC | 1.96e-11 | 2.84e-01 | 0.1753 |
| 3094 | HINT1 | GSM4909294 | Human | Breast | IDC | 6.69e-52 | 3.72e-01 | 0.2022 |
| 3094 | HINT1 | GSM4909295 | Human | Breast | IDC | 1.29e-03 | -3.65e-01 | 0.0898 |
| 3094 | HINT1 | GSM4909296 | Human | Breast | IDC | 8.40e-12 | -1.65e-01 | 0.1524 |
| 3094 | HINT1 | GSM4909297 | Human | Breast | IDC | 4.06e-26 | -3.08e-01 | 0.1517 |
| 3094 | HINT1 | GSM4909298 | Human | Breast | IDC | 1.34e-10 | 2.79e-01 | 0.1551 |
| 3094 | HINT1 | GSM4909301 | Human | Breast | IDC | 1.44e-04 | -2.99e-01 | 0.1577 |
| 3094 | HINT1 | GSM4909302 | Human | Breast | IDC | 7.78e-05 | -3.31e-01 | 0.1545 |
| 3094 | HINT1 | GSM4909304 | Human | Breast | IDC | 1.50e-08 | -3.16e-01 | 0.1636 |
| 3094 | HINT1 | GSM4909306 | Human | Breast | IDC | 5.79e-16 | 2.71e-01 | 0.1564 |
| 3094 | HINT1 | GSM4909307 | Human | Breast | IDC | 9.47e-07 | 1.77e-01 | 0.1569 |
| 3094 | HINT1 | GSM4909309 | Human | Breast | IDC | 3.03e-06 | 3.09e-02 | 0.0483 |
| 3094 | HINT1 | GSM4909311 | Human | Breast | IDC | 3.51e-53 | -5.33e-01 | 0.1534 |
| 3094 | HINT1 | GSM4909312 | Human | Breast | IDC | 5.55e-12 | 2.27e-03 | 0.1552 |
| 3094 | HINT1 | GSM4909313 | Human | Breast | IDC | 2.68e-07 | 1.07e-01 | 0.0391 |
| 3094 | HINT1 | GSM4909315 | Human | Breast | IDC | 6.52e-33 | 3.37e-01 | 0.21 |
| Page: 1 2 3 4 5 6 7 8 9 10 11 12 13 14 15 16 17 |
| Tissue | Expression Dynamics | Abbreviation |
| Breast |  | IDC: Invasive ductal carcinoma |
| DCIS: Ductal carcinoma in situ | ||
| Precancer(BRCA1-mut): Precancerous lesion from BRCA1 mutation carriers | ||
| Cervix |  | CC: Cervix cancer |
| HSIL_HPV: HPV-infected high-grade squamous intraepithelial lesions | ||
| N_HPV: HPV-infected normal cervix | ||
| Colorectum (GSE201348) |  | FAP: Familial adenomatous polyposis |
| CRC: Colorectal cancer | ||
| Colorectum (HTA11) |  | AD: Adenomas |
| SER: Sessile serrated lesions | ||
| MSI-H: Microsatellite-high colorectal cancer | ||
| MSS: Microsatellite stable colorectal cancer | ||
| Endometrium | 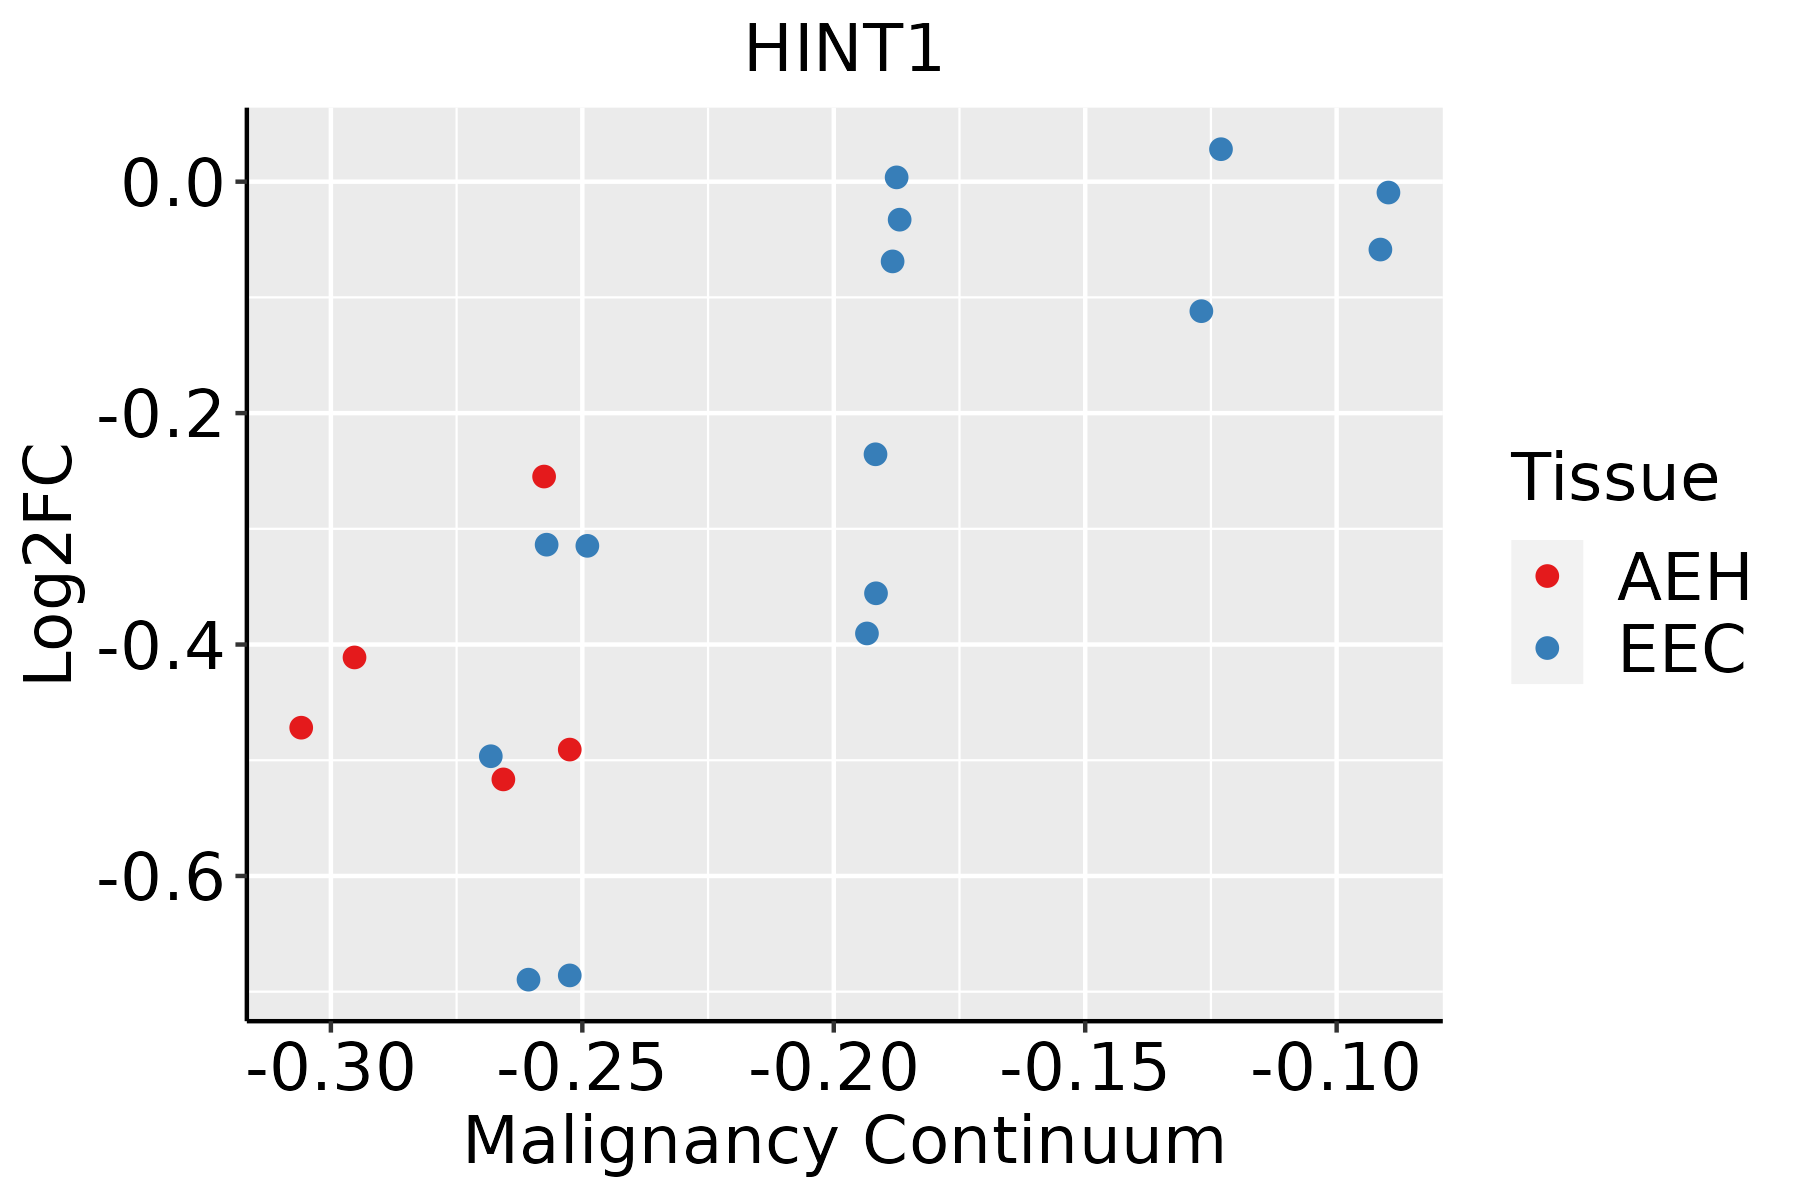 | AEH: Atypical endometrial hyperplasia |
| EEC: Endometrioid Cancer | ||
| Esophagus |  | ESCC: Esophageal squamous cell carcinoma |
| HGIN: High-grade intraepithelial neoplasias | ||
| LGIN: Low-grade intraepithelial neoplasias | ||
| Liver |  | HCC: Hepatocellular carcinoma |
| NAFLD: Non-alcoholic fatty liver disease | ||
| Oral Cavity |  | EOLP: Erosive Oral lichen planus |
| LP: leukoplakia | ||
| NEOLP: Non-erosive oral lichen planus | ||
| OSCC: Oral squamous cell carcinoma | ||
| Prostate |  | BPH: Benign Prostatic Hyperplasia |
| Skin | 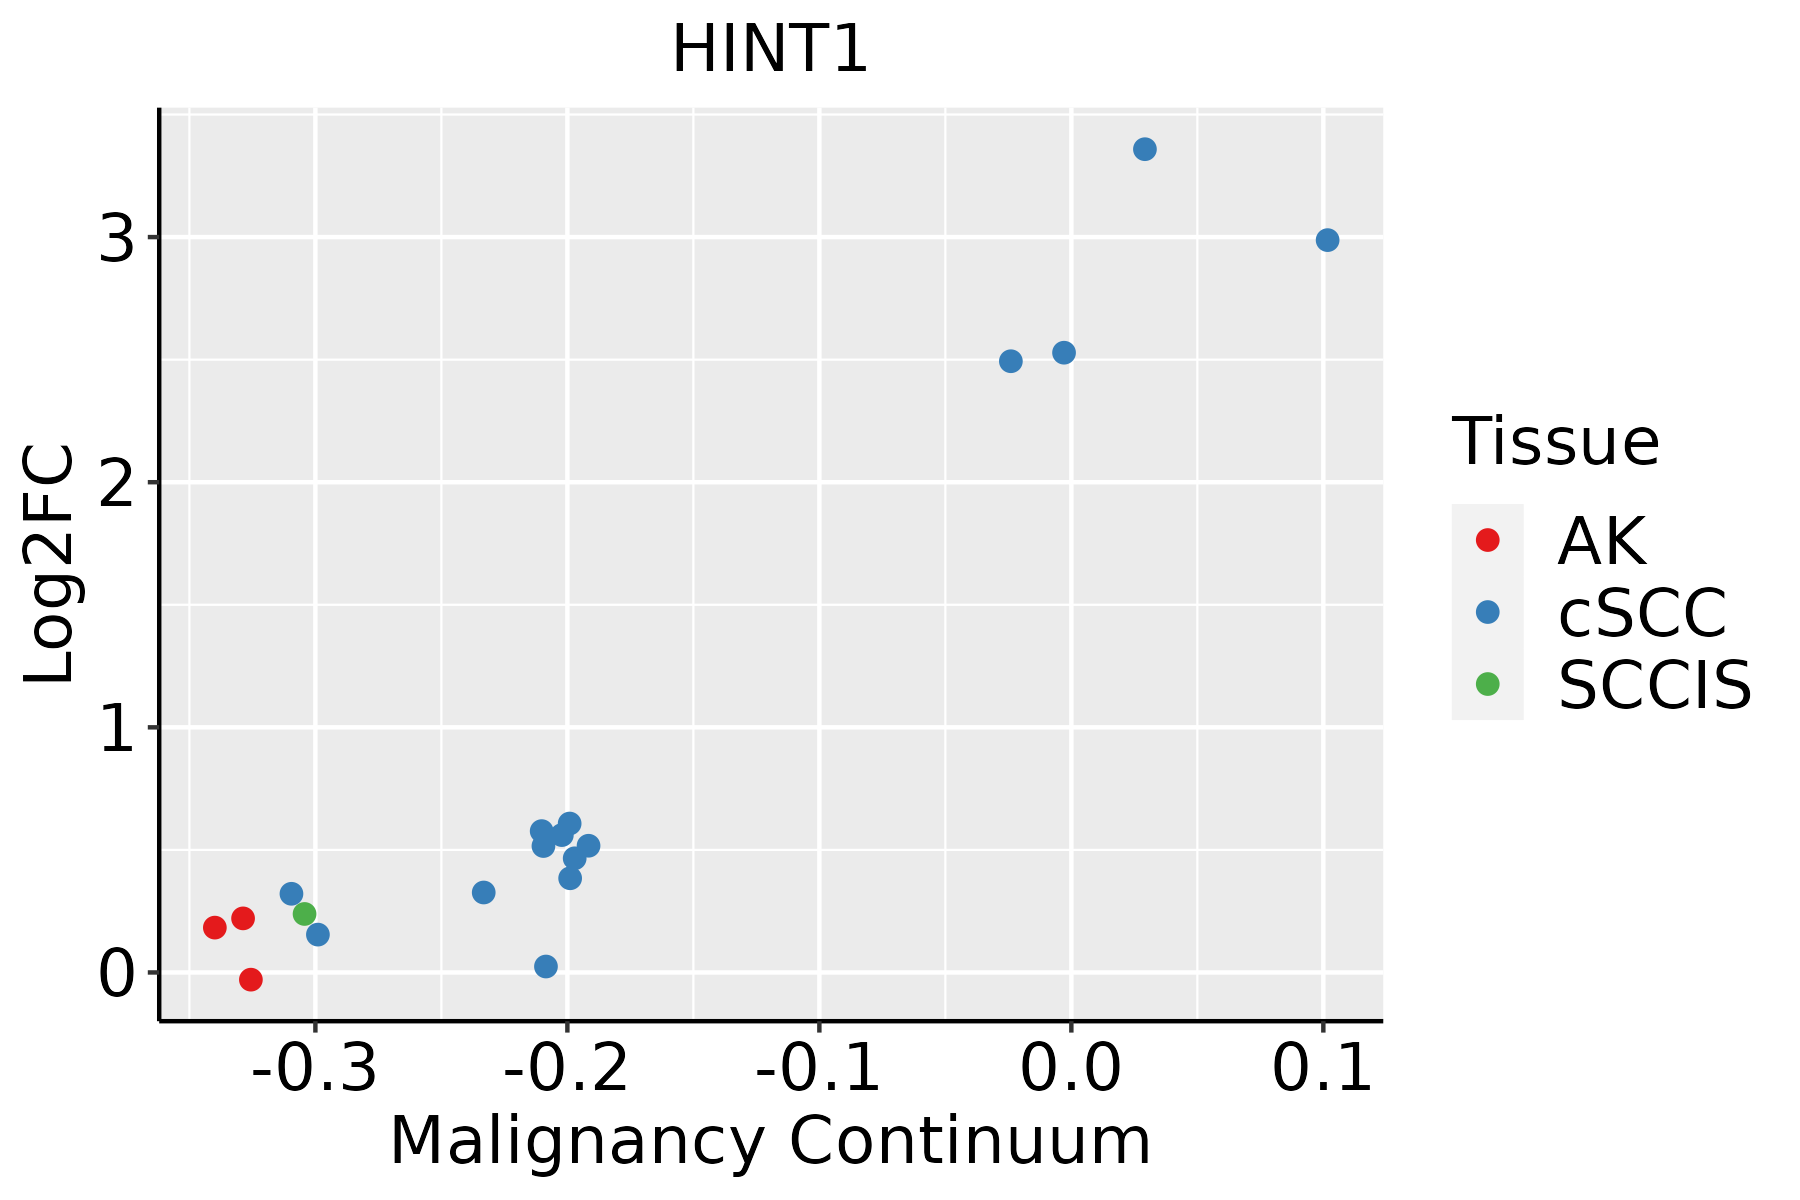 | AK: Actinic keratosis |
| cSCC: Cutaneous squamous cell carcinoma | ||
| SCCIS:squamous cell carcinoma in situ | ||
| Thyroid | 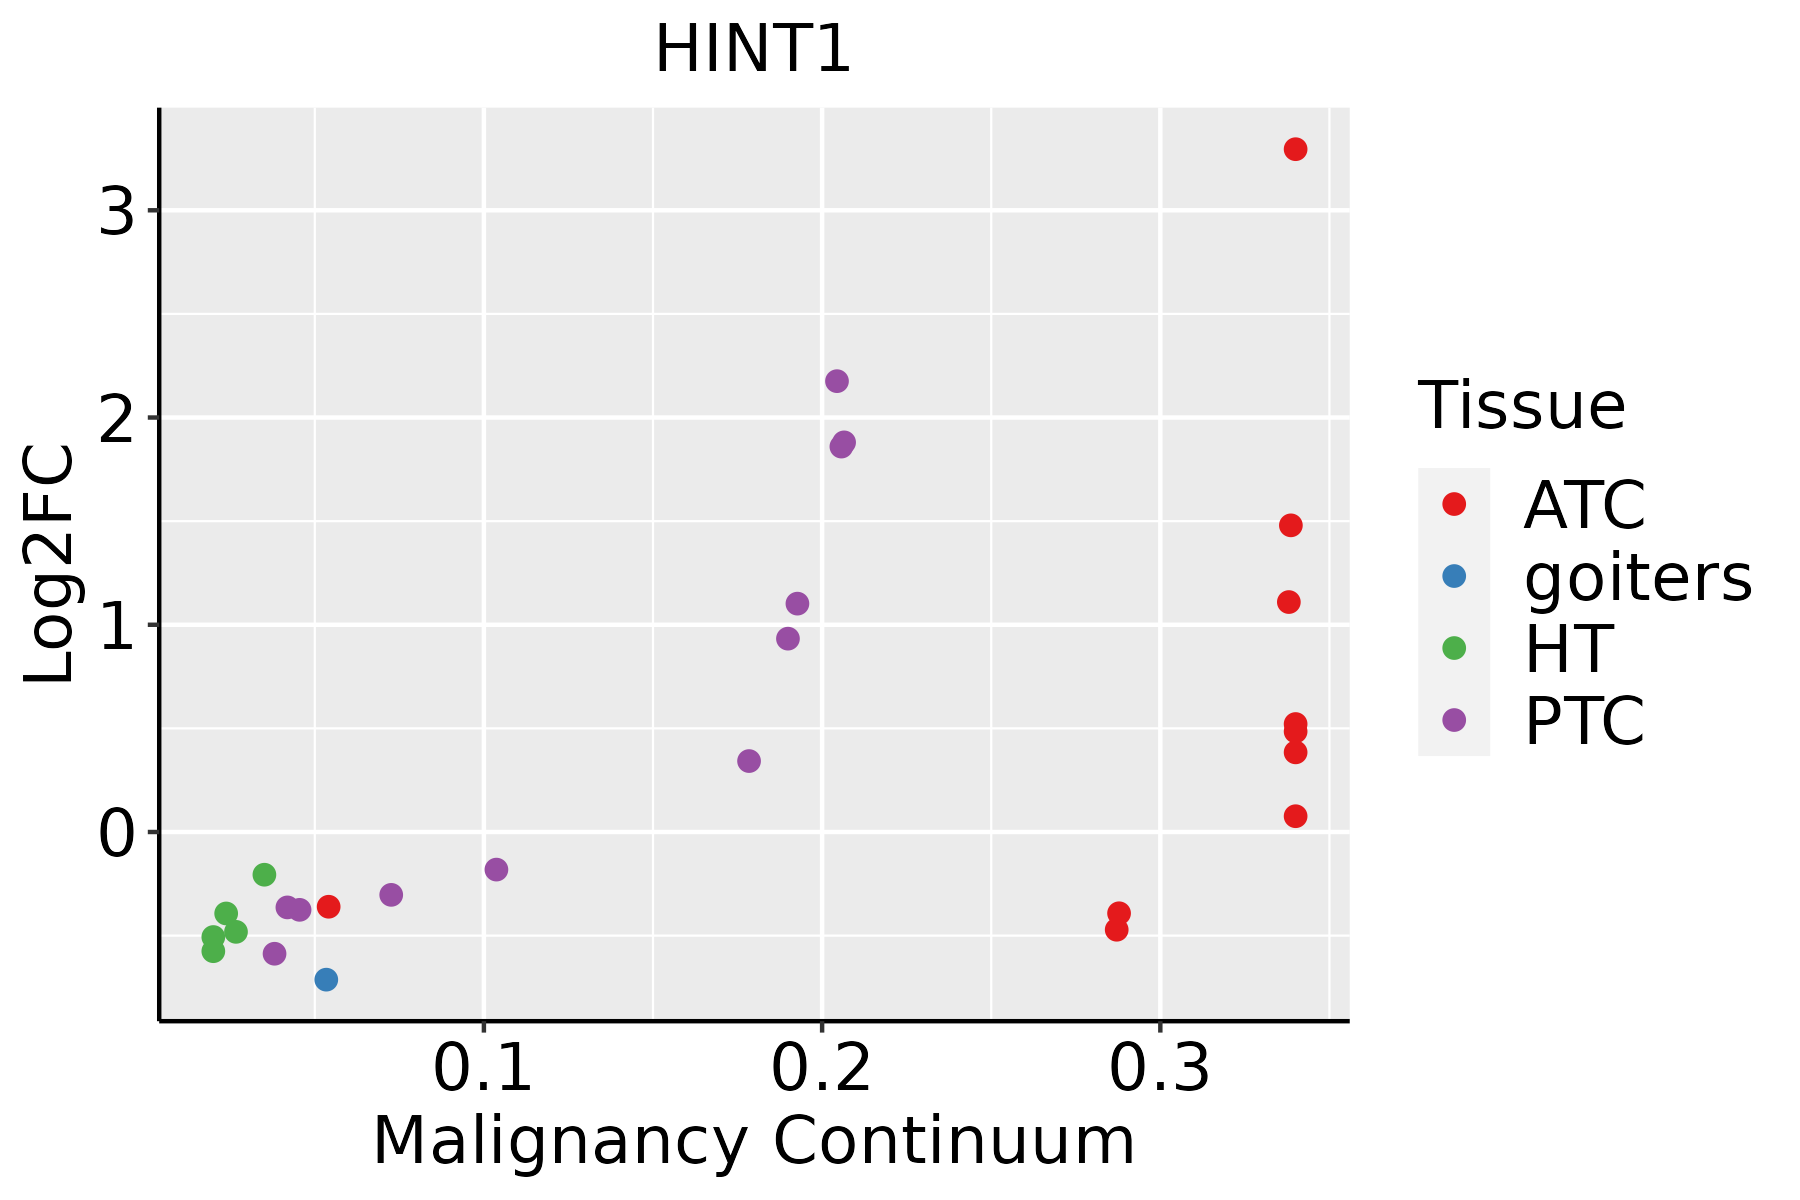 | ATC: Anaplastic thyroid cancer |
| HT: Hashimoto's thyroiditis | ||
| PTC: Papillary thyroid cancer |
| ∗log2FC in expression of this searched gene in stem-like cells from each diseased tissue sample relative to stem-like cells in normal samples in each tissue plotted against the malignancy continuum. Samples are colored based on if they are from different disease stage. |
Top |
Malignant transformation related pathway analysis |
| Find out the enriched GO biological processes and KEGG pathways involved in transition from healthy to precancer to cancer |
| Tissue | Disease Stage | Enriched GO biological Processes |
| Colorectum | AD |  |
| Colorectum | SER |  |
| Colorectum | MSS |  |
| Colorectum | MSI-H |  |
| Colorectum | FAP |  |
| ∗Top 15 enriched GO BP terms are showed in the bar plot of each disease state in each tissue. Each row represents a significant GO biological process which is colored according to the -log10(p.adjust). |
| Page: 1 2 3 4 5 6 7 8 9 |
| GO ID | Tissue | Disease Stage | Description | Gene Ratio | Bg Ratio | pvalue | p.adjust | Count |
| GO:00971939 | Breast | Precancer | intrinsic apoptotic signaling pathway | 59/1080 | 288/18723 | 8.07e-18 | 3.60e-15 | 59 |
| GO:00196938 | Breast | Precancer | ribose phosphate metabolic process | 49/1080 | 396/18723 | 3.81e-07 | 1.78e-05 | 49 |
| GO:00091509 | Breast | Precancer | purine ribonucleotide metabolic process | 46/1080 | 368/18723 | 6.47e-07 | 2.71e-05 | 46 |
| GO:00091179 | Breast | Precancer | nucleotide metabolic process | 56/1080 | 489/18723 | 7.40e-07 | 3.00e-05 | 56 |
| GO:00092598 | Breast | Precancer | ribonucleotide metabolic process | 47/1080 | 385/18723 | 9.69e-07 | 3.84e-05 | 47 |
| GO:00067539 | Breast | Precancer | nucleoside phosphate metabolic process | 56/1080 | 497/18723 | 1.24e-06 | 4.70e-05 | 56 |
| GO:00061639 | Breast | Precancer | purine nucleotide metabolic process | 47/1080 | 396/18723 | 2.14e-06 | 7.50e-05 | 47 |
| GO:00723319 | Breast | Precancer | signal transduction by p53 class mediator | 26/1080 | 163/18723 | 2.23e-06 | 7.76e-05 | 26 |
| GO:00723328 | Breast | Precancer | intrinsic apoptotic signaling pathway by p53 class mediator | 16/1080 | 76/18723 | 5.49e-06 | 1.63e-04 | 16 |
| GO:00725219 | Breast | Precancer | purine-containing compound metabolic process | 47/1080 | 416/18723 | 8.19e-06 | 2.20e-04 | 47 |
| GO:00346558 | Breast | Precancer | nucleobase-containing compound catabolic process | 42/1080 | 407/18723 | 1.91e-04 | 3.06e-03 | 42 |
| GO:00467007 | Breast | Precancer | heterocycle catabolic process | 44/1080 | 445/18723 | 3.49e-04 | 4.88e-03 | 44 |
| GO:00442708 | Breast | Precancer | cellular nitrogen compound catabolic process | 44/1080 | 451/18723 | 4.64e-04 | 6.12e-03 | 44 |
| GO:00194397 | Breast | Precancer | aromatic compound catabolic process | 44/1080 | 467/18723 | 9.55e-04 | 1.07e-02 | 44 |
| GO:19013617 | Breast | Precancer | organic cyclic compound catabolic process | 45/1080 | 495/18723 | 1.73e-03 | 1.74e-02 | 45 |
| GO:009719314 | Breast | IDC | intrinsic apoptotic signaling pathway | 69/1434 | 288/18723 | 6.32e-18 | 2.99e-15 | 69 |
| GO:000915014 | Breast | IDC | purine ribonucleotide metabolic process | 55/1434 | 368/18723 | 1.30e-06 | 5.72e-05 | 55 |
| GO:001969314 | Breast | IDC | ribose phosphate metabolic process | 58/1434 | 396/18723 | 1.31e-06 | 5.73e-05 | 58 |
| GO:000675313 | Breast | IDC | nucleoside phosphate metabolic process | 68/1434 | 497/18723 | 2.01e-06 | 8.23e-05 | 68 |
| GO:000911713 | Breast | IDC | nucleotide metabolic process | 67/1434 | 489/18723 | 2.28e-06 | 9.05e-05 | 67 |
| Page: 1 2 3 4 5 6 7 8 9 10 11 12 13 14 15 16 17 18 19 20 21 22 23 |
| Pathway ID | Tissue | Disease Stage | Description | Gene Ratio | Bg Ratio | pvalue | p.adjust | qvalue | Count |
| Page: 1 |
Top |
Cell-cell communication analysis |
| Identification of potential cell-cell interactions between two cell types and their ligand-receptor pairs for different disease states |
| Ligand | Receptor | LRpair | Pathway | Tissue | Disease Stage |
| Page: 1 |
Top |
Single-cell gene regulatory network inference analysis |
| Find out the significant the regulons (TFs) and the target genes of each regulon across cell types for different disease states |
| TF | Cell Type | Tissue | Disease Stage | Target Gene | RSS | Regulon Activity |
| ∗The dot plots of a searched regulon are shown for all cell subpopulations in each disease state of each tissue based on the regulon specific score inferred using pySCENIC and by calculating the average expression. |
| Page: 1 |
Top |
Somatic mutation of malignant transformation related genes |
| Annotation of somatic variants for genes involved in malignant transformation |
| Hugo Symbol | Variant Class | Variant Classification | dbSNP RS | HGVSc | HGVSp | HGVSp Short | SWISSPROT | BIOTYPE | SIFT | PolyPhen | Tumor Sample Barcode | Tissue | Histology | Sex | Age | Stage | Therapy Types | Drugs | Outcome |
| HINT1 | SNV | Missense_Mutation | rs373197800 | c.284G>A | p.Arg95Gln | p.R95Q | P49773 | protein_coding | tolerated(0.06) | probably_damaging(0.96) | TCGA-2W-A8YY-01 | Cervix | cervical & endocervical cancer | Female | <65 | I/II | Chemotherapy | cisplatin | CR |
| HINT1 | SNV | Missense_Mutation | c.205N>T | p.Asp69Tyr | p.D69Y | P49773 | protein_coding | deleterious(0) | benign(0.266) | TCGA-AA-A029-01 | Colorectum | colon adenocarcinoma | Male | >=65 | I/II | Unknown | Unknown | SD | |
| HINT1 | SNV | Missense_Mutation | c.171N>T | p.Lys57Asn | p.K57N | P49773 | protein_coding | deleterious(0) | probably_damaging(0.953) | TCGA-B5-A0JY-01 | Endometrium | uterine corpus endometrioid carcinoma | Female | <65 | III/IV | Chemotherapy | doxorubicin | SD | |
| HINT1 | SNV | Missense_Mutation | novel | c.248A>G | p.Lys83Arg | p.K83R | P49773 | protein_coding | tolerated(0.13) | benign(0.02) | TCGA-B5-A3FA-01 | Endometrium | uterine corpus endometrioid carcinoma | Female | >=65 | I/II | Unknown | Unknown | SD |
| HINT1 | SNV | Missense_Mutation | novel | c.295N>G | p.Asn99Asp | p.N99D | P49773 | protein_coding | deleterious(0) | possibly_damaging(0.876) | TCGA-BK-A6W3-01 | Endometrium | uterine corpus endometrioid carcinoma | Female | <65 | I/II | Unknown | Unknown | SD |
| HINT1 | SNV | Missense_Mutation | novel | c.173N>C | p.Lys58Thr | p.K58T | P49773 | protein_coding | deleterious(0.04) | benign(0.107) | TCGA-E6-A1LX-01 | Endometrium | uterine corpus endometrioid carcinoma | Female | <65 | I/II | Unknown | Unknown | SD |
| HINT1 | SNV | Missense_Mutation | novel | c.158N>G | p.Leu53Arg | p.L53R | P49773 | protein_coding | deleterious(0.02) | probably_damaging(1) | TCGA-EY-A548-01 | Endometrium | uterine corpus endometrioid carcinoma | Female | >=65 | I/II | Unknown | Unknown | SD |
| HINT1 | SNV | Missense_Mutation | rs773013836 | c.59N>A | p.Gly20Glu | p.G20E | P49773 | protein_coding | deleterious(0.04) | benign(0.034) | TCGA-50-5049-01 | Lung | lung adenocarcinoma | Male | >=65 | I/II | Unknown | Unknown | PD |
| HINT1 | SNV | Missense_Mutation | c.7G>A | p.Asp3Asn | p.D3N | P49773 | protein_coding | tolerated(0.13) | benign(0.006) | TCGA-64-5779-01 | Lung | lung adenocarcinoma | Male | <65 | III/IV | Chemotherapy | cisplatin | PD | |
| HINT1 | SNV | Missense_Mutation | rs749444327 | c.93C>G | p.Ile31Met | p.I31M | P49773 | protein_coding | deleterious(0.01) | benign(0.387) | TCGA-98-8021-01 | Lung | lung squamous cell carcinoma | Female | >=65 | I/II | Unknown | Unknown | PD |
| Page: 1 |
Top |
Related drugs of malignant transformation related genes |
| Identification of chemicals and drugs interact with genes involved in malignant transfromation |
| (DGIdb 4.0) |
| Entrez ID | Symbol | Category | Interaction Types | Drug Claim Name | Drug Name | PMIDs |
| 3094 | HINT1 | NA | nicotine | NICOTINE | 17978999 |
| Page: 1 |

Copyright 2023-Present -The University of Texas Health Science Center at Houston |