
|
|||||
|
 | |
| |
| |
| |
| |
| |
|
Gene: HILPDA |
Gene summary for HILPDA |
| Gene information | Species | Human | Gene symbol | HILPDA | Gene ID | 29923 |
| Gene name | hypoxia inducible lipid droplet associated | |
| Gene Alias | C7orf68 | |
| Cytomap | 7q32.1 | |
| Gene Type | protein-coding | GO ID | GO:0001666 | UniProtAcc | Q9Y5L2 |
Top |
Malignant transformation analysis |
| Identification of the aberrant gene expression in precancerous and cancerous lesions by comparing the gene expression of stem-like cells in diseased tissues with normal stem cells |
| Entrez ID | Symbol | Replicates | Species | Organ | Tissue | Adj P-value | Log2FC | Malignancy |
| 29923 | HILPDA | GSM4909281 | Human | Breast | IDC | 4.18e-14 | -9.03e-03 | 0.21 |
| 29923 | HILPDA | GSM4909282 | Human | Breast | IDC | 7.52e-03 | -2.88e-01 | -0.0288 |
| 29923 | HILPDA | GSM4909285 | Human | Breast | IDC | 4.48e-08 | -9.25e-02 | 0.21 |
| 29923 | HILPDA | GSM4909286 | Human | Breast | IDC | 6.14e-14 | -1.99e-01 | 0.1081 |
| 29923 | HILPDA | GSM4909287 | Human | Breast | IDC | 3.70e-02 | -2.64e-01 | 0.2057 |
| 29923 | HILPDA | GSM4909290 | Human | Breast | IDC | 1.57e-04 | -2.82e-01 | 0.2096 |
| 29923 | HILPDA | GSM4909293 | Human | Breast | IDC | 4.46e-16 | -1.90e-01 | 0.1581 |
| 29923 | HILPDA | GSM4909297 | Human | Breast | IDC | 9.41e-03 | -3.72e-01 | 0.1517 |
| 29923 | HILPDA | GSM4909298 | Human | Breast | IDC | 4.32e-07 | -2.10e-01 | 0.1551 |
| 29923 | HILPDA | GSM4909299 | Human | Breast | IDC | 2.96e-12 | -5.02e-01 | 0.035 |
| 29923 | HILPDA | GSM4909300 | Human | Breast | IDC | 3.49e-02 | -4.43e-01 | 0.0334 |
| 29923 | HILPDA | GSM4909301 | Human | Breast | IDC | 4.53e-04 | -3.89e-01 | 0.1577 |
| 29923 | HILPDA | GSM4909304 | Human | Breast | IDC | 3.10e-09 | -1.47e-01 | 0.1636 |
| 29923 | HILPDA | GSM4909305 | Human | Breast | IDC | 1.68e-03 | -3.36e-01 | 0.0436 |
| 29923 | HILPDA | GSM4909306 | Human | Breast | IDC | 2.83e-09 | -1.18e-01 | 0.1564 |
| 29923 | HILPDA | GSM4909307 | Human | Breast | IDC | 6.21e-03 | -2.59e-01 | 0.1569 |
| 29923 | HILPDA | GSM4909308 | Human | Breast | IDC | 3.39e-07 | -2.59e-01 | 0.158 |
| 29923 | HILPDA | GSM4909311 | Human | Breast | IDC | 1.05e-08 | -4.48e-01 | 0.1534 |
| 29923 | HILPDA | GSM4909313 | Human | Breast | IDC | 1.19e-06 | -4.34e-01 | 0.0391 |
| 29923 | HILPDA | GSM4909315 | Human | Breast | IDC | 3.62e-02 | 2.91e-01 | 0.21 |
| Page: 1 2 3 4 5 6 7 |
| Tissue | Expression Dynamics | Abbreviation |
| Breast | 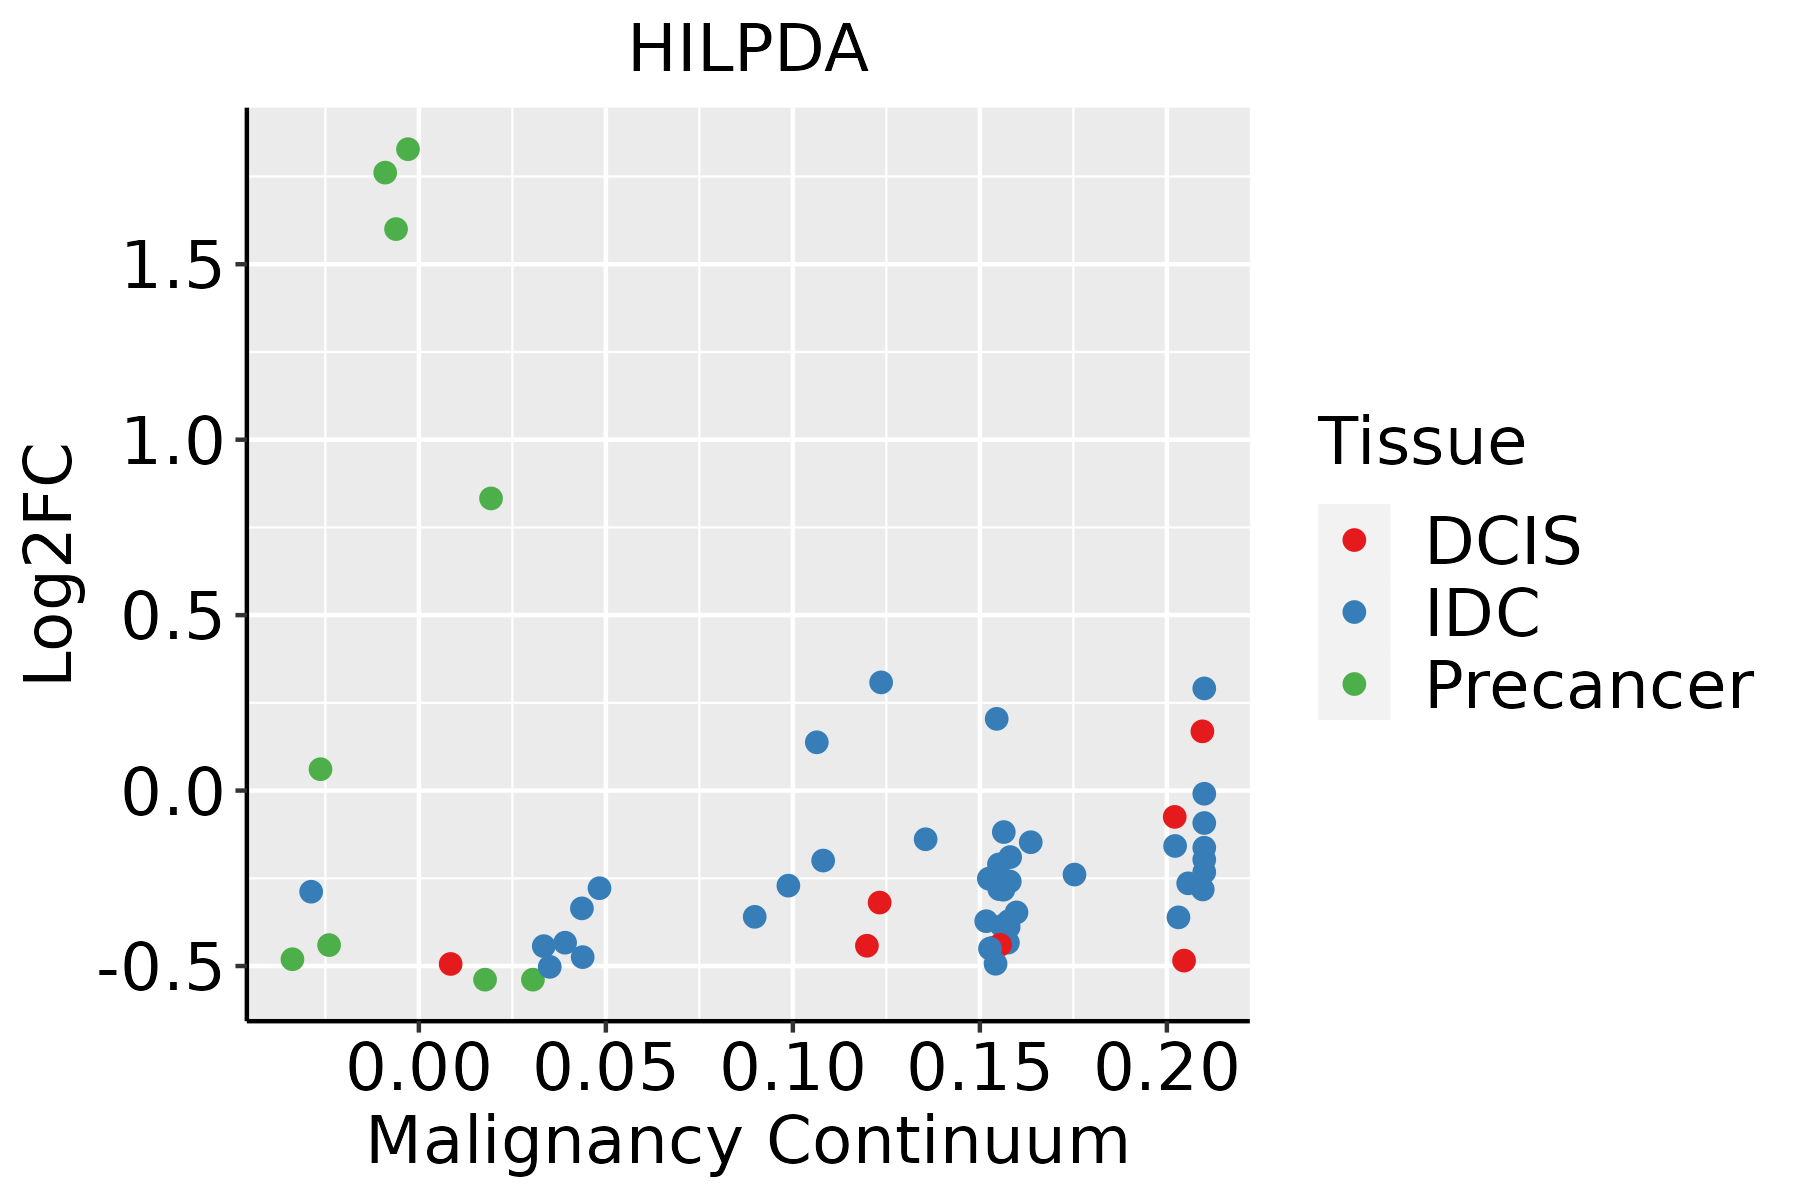 | IDC: Invasive ductal carcinoma |
| DCIS: Ductal carcinoma in situ | ||
| Precancer(BRCA1-mut): Precancerous lesion from BRCA1 mutation carriers | ||
| Esophagus | 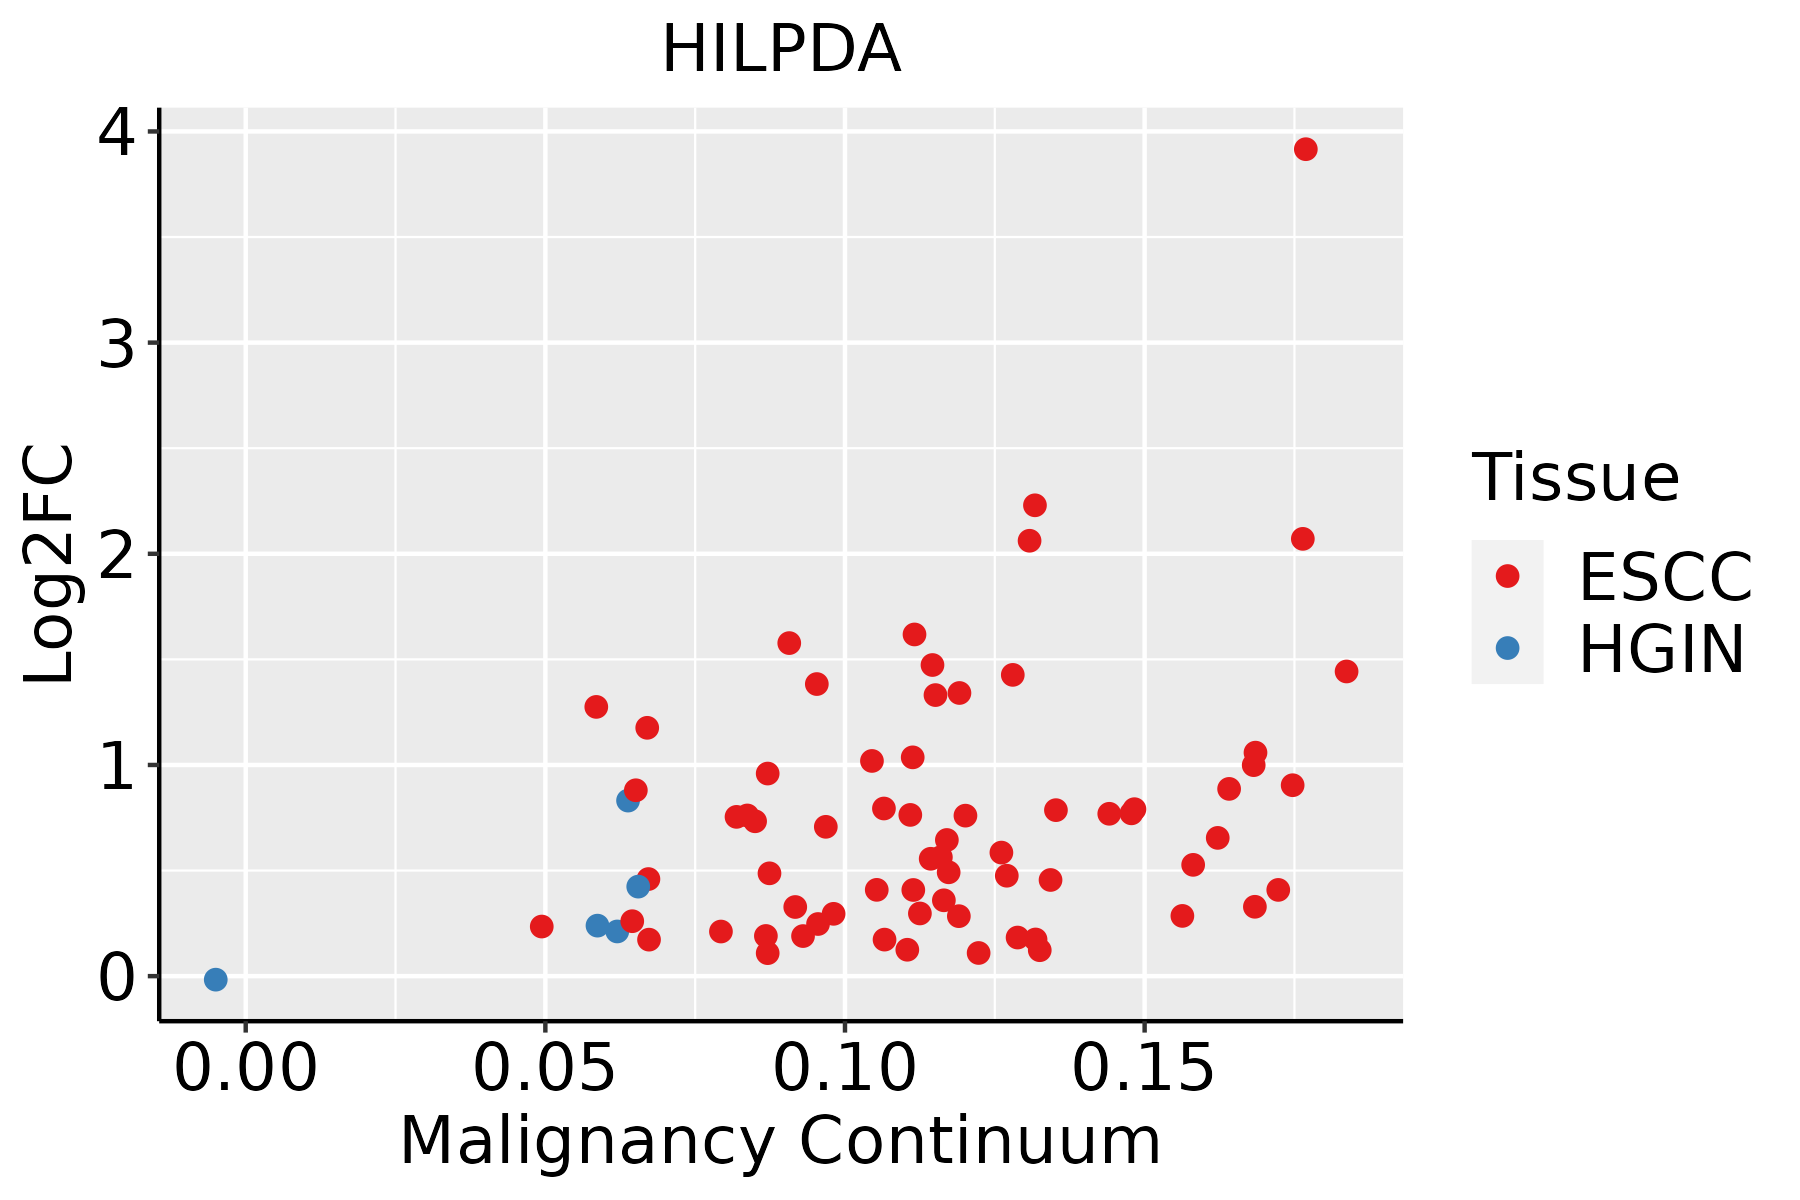 | ESCC: Esophageal squamous cell carcinoma |
| HGIN: High-grade intraepithelial neoplasias | ||
| LGIN: Low-grade intraepithelial neoplasias | ||
| Liver | 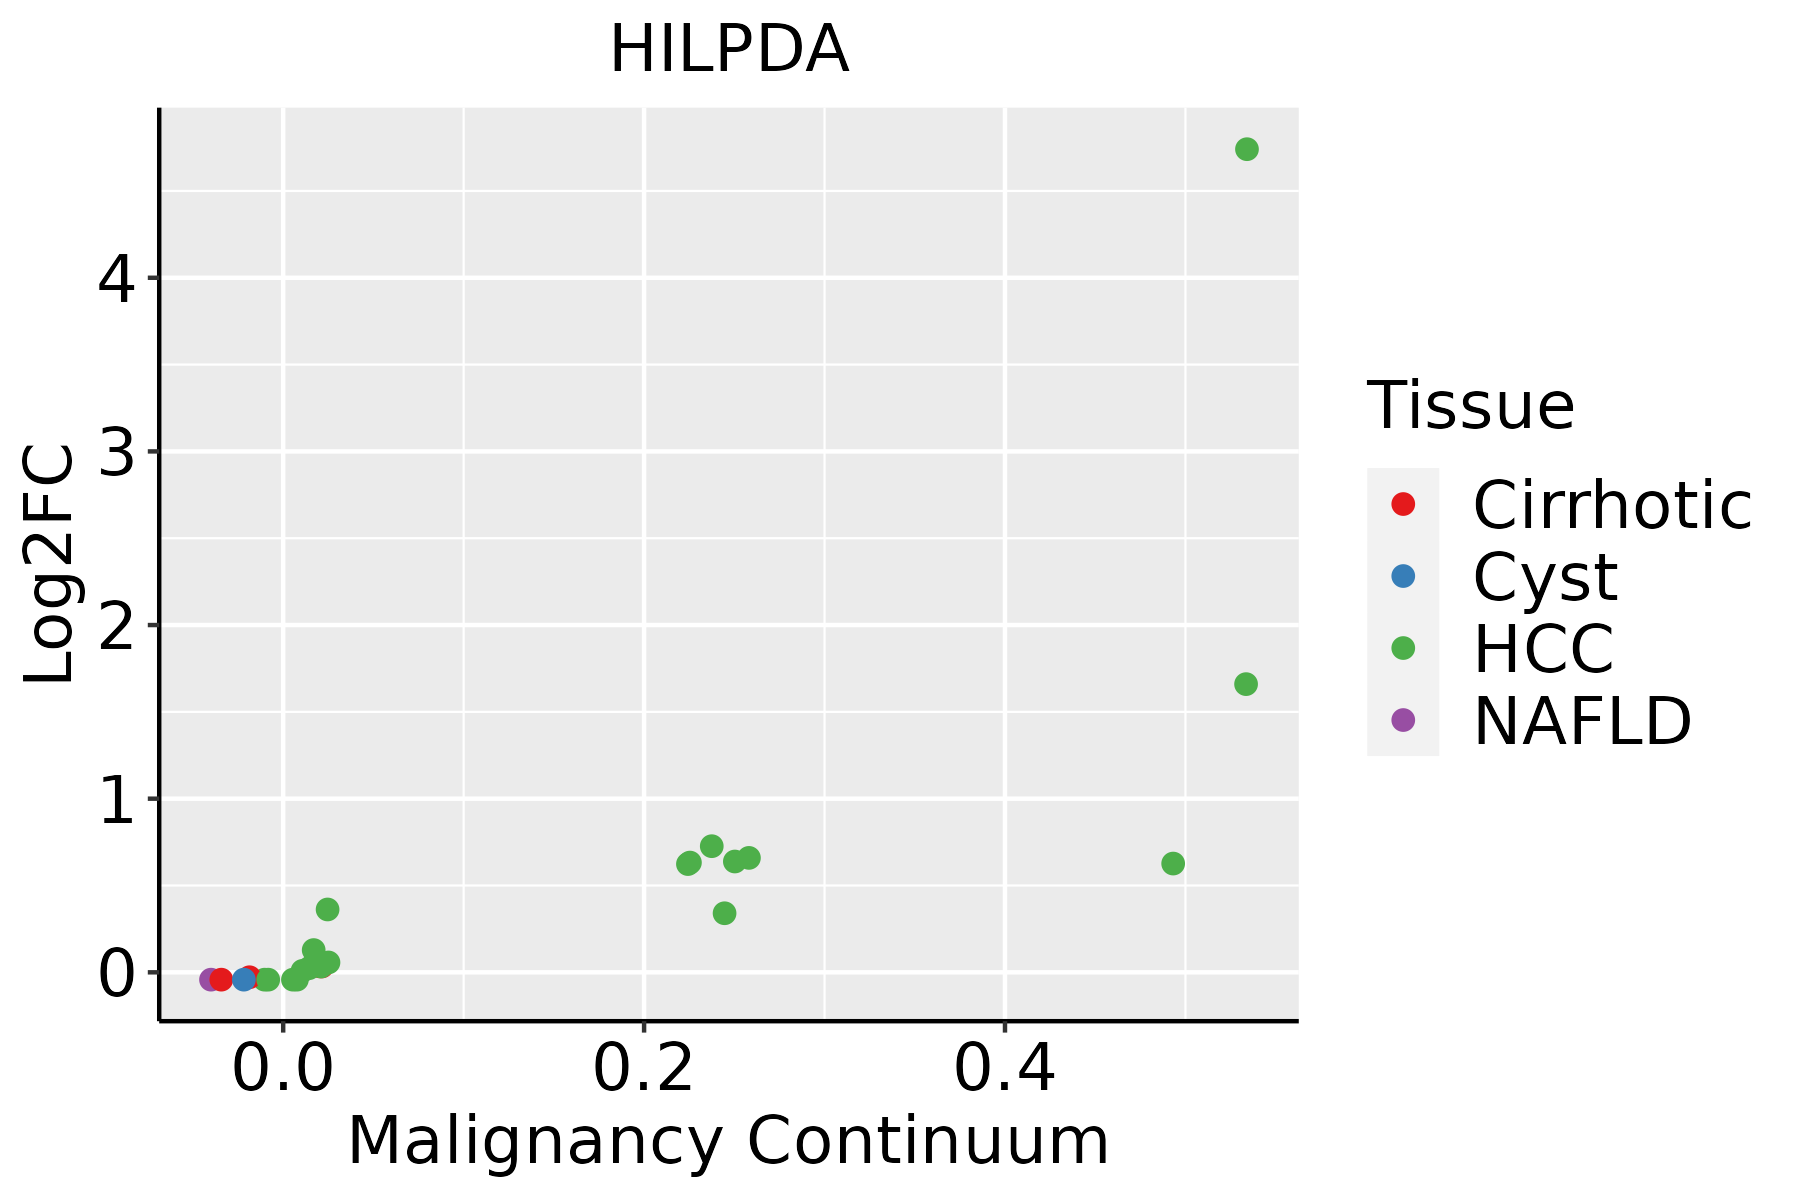 | HCC: Hepatocellular carcinoma |
| NAFLD: Non-alcoholic fatty liver disease | ||
| Lung |  | AAH: Atypical adenomatous hyperplasia |
| AIS: Adenocarcinoma in situ | ||
| IAC: Invasive lung adenocarcinoma | ||
| MIA: Minimally invasive adenocarcinoma | ||
| Oral Cavity | 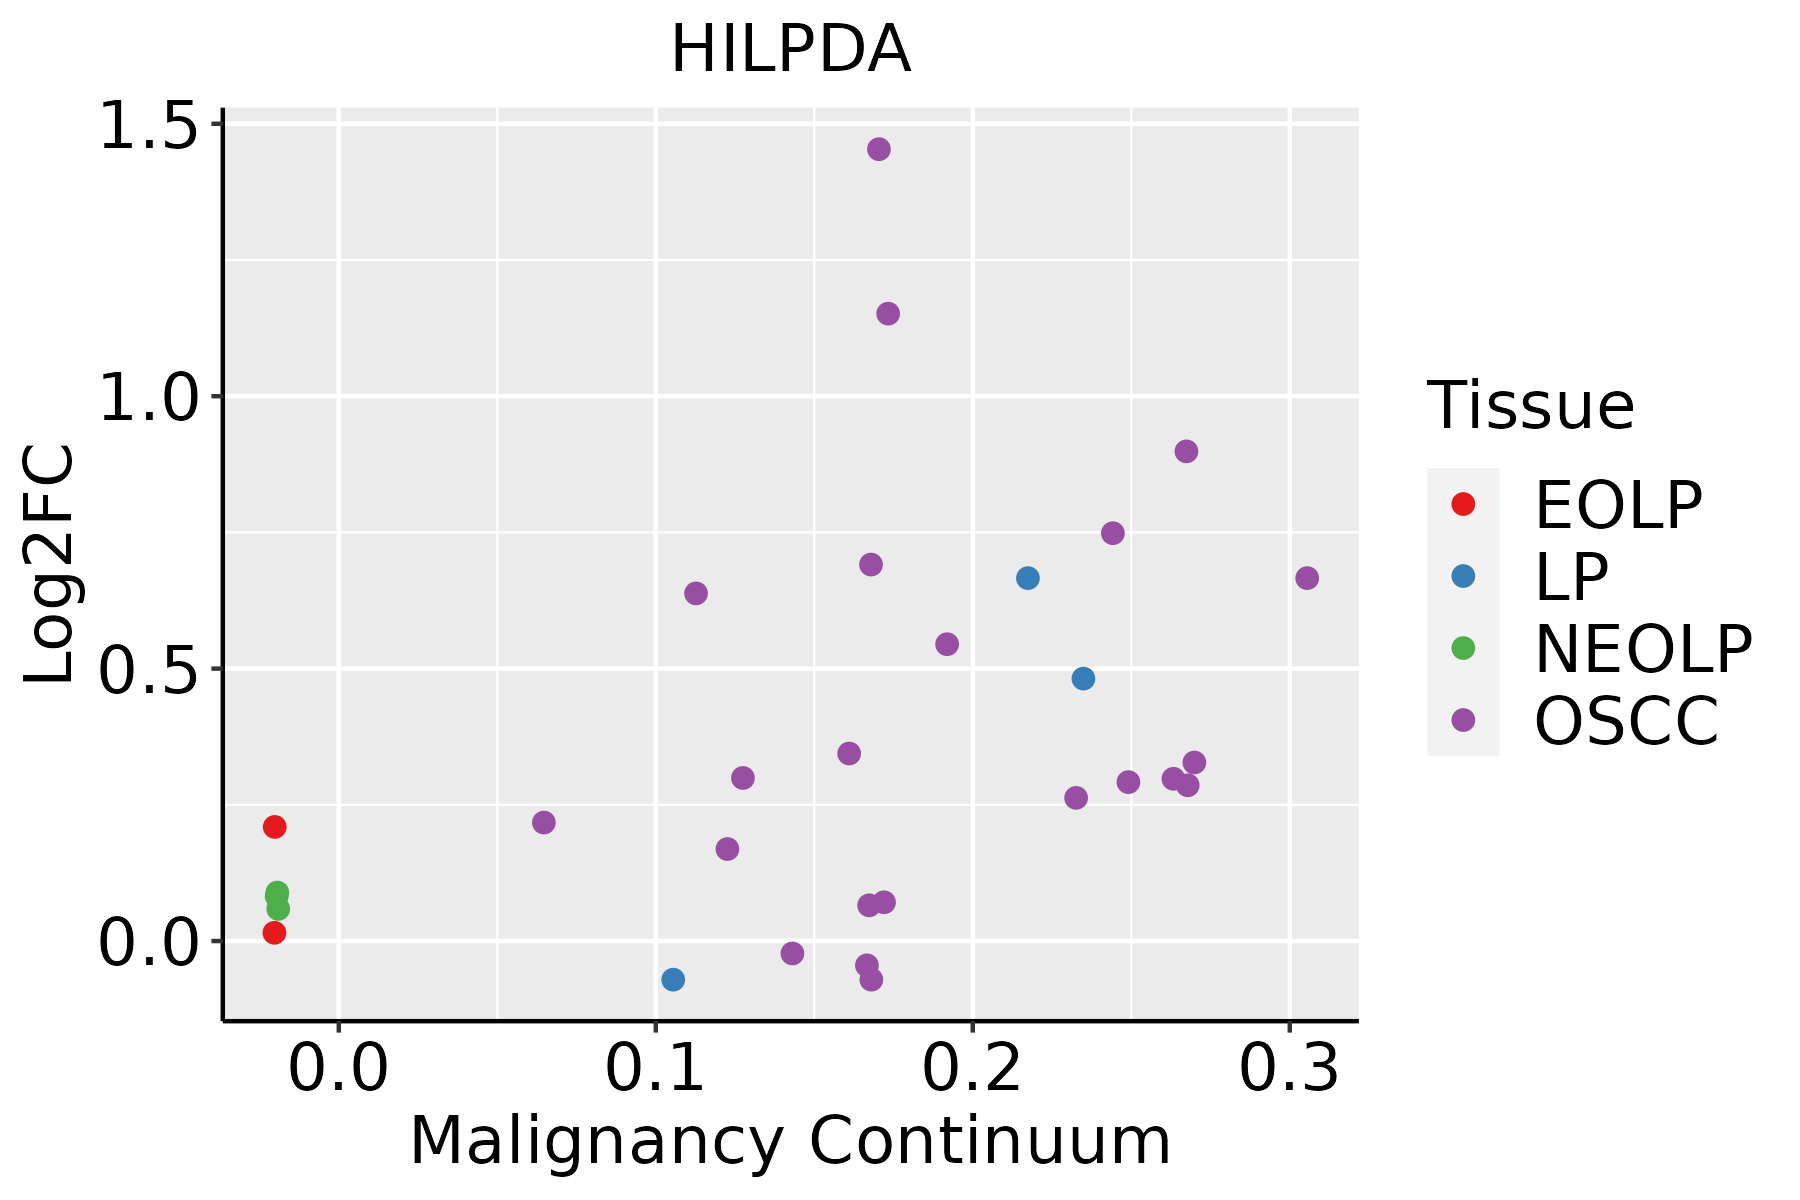 | EOLP: Erosive Oral lichen planus |
| LP: leukoplakia | ||
| NEOLP: Non-erosive oral lichen planus | ||
| OSCC: Oral squamous cell carcinoma | ||
| Thyroid |  | ATC: Anaplastic thyroid cancer |
| HT: Hashimoto's thyroiditis | ||
| PTC: Papillary thyroid cancer |
| ∗log2FC in expression of this searched gene in stem-like cells from each diseased tissue sample relative to stem-like cells in normal samples in each tissue plotted against the malignancy continuum. Samples are colored based on if they are from different disease stage. |
Top |
Malignant transformation related pathway analysis |
| Find out the enriched GO biological processes and KEGG pathways involved in transition from healthy to precancer to cancer |
| Tissue | Disease Stage | Enriched GO biological Processes |
| Colorectum | AD |  |
| Colorectum | SER |  |
| Colorectum | MSS |  |
| Colorectum | MSI-H |  |
| Colorectum | FAP |  |
| ∗Top 15 enriched GO BP terms are showed in the bar plot of each disease state in each tissue. Each row represents a significant GO biological process which is colored according to the -log10(p.adjust). |
| Page: 1 2 3 4 5 6 7 8 9 |
| GO ID | Tissue | Disease Stage | Description | Gene Ratio | Bg Ratio | pvalue | p.adjust | Count |
| GO:00362939 | Breast | Precancer | response to decreased oxygen levels | 53/1080 | 322/18723 | 4.09e-12 | 6.84e-10 | 53 |
| GO:00016669 | Breast | Precancer | response to hypoxia | 51/1080 | 307/18723 | 7.33e-12 | 1.11e-09 | 51 |
| GO:00704829 | Breast | Precancer | response to oxygen levels | 55/1080 | 347/18723 | 7.47e-12 | 1.11e-09 | 55 |
| GO:00362948 | Breast | Precancer | cellular response to decreased oxygen levels | 31/1080 | 161/18723 | 2.61e-09 | 2.11e-07 | 31 |
| GO:00714538 | Breast | Precancer | cellular response to oxygen levels | 32/1080 | 177/18723 | 7.32e-09 | 5.52e-07 | 32 |
| GO:00714565 | Breast | Precancer | cellular response to hypoxia | 29/1080 | 151/18723 | 8.98e-09 | 6.50e-07 | 29 |
| GO:00018196 | Breast | Precancer | positive regulation of cytokine production | 52/1080 | 467/18723 | 4.18e-06 | 1.29e-04 | 52 |
| GO:00512358 | Breast | Precancer | maintenance of location | 40/1080 | 327/18723 | 5.85e-06 | 1.71e-04 | 40 |
| GO:007048214 | Breast | IDC | response to oxygen levels | 64/1434 | 347/18723 | 3.45e-11 | 5.57e-09 | 64 |
| GO:003629314 | Breast | IDC | response to decreased oxygen levels | 60/1434 | 322/18723 | 9.26e-11 | 1.25e-08 | 60 |
| GO:000166614 | Breast | IDC | response to hypoxia | 58/1434 | 307/18723 | 1.09e-10 | 1.38e-08 | 58 |
| GO:003629413 | Breast | IDC | cellular response to decreased oxygen levels | 34/1434 | 161/18723 | 4.73e-08 | 3.02e-06 | 34 |
| GO:007145613 | Breast | IDC | cellular response to hypoxia | 32/1434 | 151/18723 | 1.07e-07 | 6.26e-06 | 32 |
| GO:007145313 | Breast | IDC | cellular response to oxygen levels | 35/1434 | 177/18723 | 1.68e-07 | 9.10e-06 | 35 |
| GO:005123513 | Breast | IDC | maintenance of location | 48/1434 | 327/18723 | 9.90e-06 | 2.77e-04 | 48 |
| GO:000181911 | Breast | IDC | positive regulation of cytokine production | 61/1434 | 467/18723 | 2.81e-05 | 6.58e-04 | 61 |
| GO:003629323 | Breast | DCIS | response to decreased oxygen levels | 60/1390 | 322/18723 | 2.64e-11 | 4.56e-09 | 60 |
| GO:007048223 | Breast | DCIS | response to oxygen levels | 63/1390 | 347/18723 | 2.66e-11 | 4.56e-09 | 63 |
| GO:000166623 | Breast | DCIS | response to hypoxia | 58/1390 | 307/18723 | 3.19e-11 | 5.16e-09 | 58 |
| GO:003629422 | Breast | DCIS | cellular response to decreased oxygen levels | 34/1390 | 161/18723 | 2.21e-08 | 1.49e-06 | 34 |
| Page: 1 2 3 4 5 |
| Pathway ID | Tissue | Disease Stage | Description | Gene Ratio | Bg Ratio | pvalue | p.adjust | qvalue | Count |
| Page: 1 |
Top |
Cell-cell communication analysis |
| Identification of potential cell-cell interactions between two cell types and their ligand-receptor pairs for different disease states |
| Ligand | Receptor | LRpair | Pathway | Tissue | Disease Stage |
| Page: 1 |
Top |
Single-cell gene regulatory network inference analysis |
| Find out the significant the regulons (TFs) and the target genes of each regulon across cell types for different disease states |
| TF | Cell Type | Tissue | Disease Stage | Target Gene | RSS | Regulon Activity |
| ∗The dot plots of a searched regulon are shown for all cell subpopulations in each disease state of each tissue based on the regulon specific score inferred using pySCENIC and by calculating the average expression. |
| Page: 1 |
Top |
Somatic mutation of malignant transformation related genes |
| Annotation of somatic variants for genes involved in malignant transformation |
| Hugo Symbol | Variant Class | Variant Classification | dbSNP RS | HGVSc | HGVSp | HGVSp Short | SWISSPROT | BIOTYPE | SIFT | PolyPhen | Tumor Sample Barcode | Tissue | Histology | Sex | Age | Stage | Therapy Types | Drugs | Outcome |
| HILPDA | SNV | Missense_Mutation | novel | c.32N>A | p.Gly11Asp | p.G11D | Q9Y5L2 | protein_coding | deleterious_low_confidence(0) | probably_damaging(0.999) | TCGA-B5-A1MX-01 | Endometrium | uterine corpus endometrioid carcinoma | Female | <65 | I/II | Hormone Therapy | megace | SD |
| HILPDA | insertion | Frame_Shift_Ins | novel | c.86_87insA | p.Leu31ThrfsTer59 | p.L31Tfs*59 | Q9Y5L2 | protein_coding | TCGA-55-1592-01 | Lung | lung adenocarcinoma | Male | >=65 | I/II | Unknown | Unknown | PD | ||
| HILPDA | SNV | Missense_Mutation | novel | c.171N>G | p.Asp57Glu | p.D57E | Q9Y5L2 | protein_coding | tolerated_low_confidence(0.32) | benign(0.017) | TCGA-CN-5361-01 | Oral cavity | head & neck squamous cell carcinoma | Male | >=65 | I/II | Unknown | Unknown | PD |
| Page: 1 |
Top |
Related drugs of malignant transformation related genes |
| Identification of chemicals and drugs interact with genes involved in malignant transfromation |
| (DGIdb 4.0) |
| Entrez ID | Symbol | Category | Interaction Types | Drug Claim Name | Drug Name | PMIDs |
| Page: 1 |

Copyright 2023-Present -The University of Texas Health Science Center at Houston |