
|
|||||
|
 | |
| |
| |
| |
| |
| |
|
Gene: HIKESHI |
Gene summary for HIKESHI |
| Gene information | Species | Human | Gene symbol | HIKESHI | Gene ID | 51501 |
| Gene name | heat shock protein nuclear import factor hikeshi | |
| Gene Alias | C11orf73 | |
| Cytomap | 11q14.2 | |
| Gene Type | protein-coding | GO ID | GO:0006606 | UniProtAcc | Q53FT3 |
Top |
Malignant transformation analysis |
| Identification of the aberrant gene expression in precancerous and cancerous lesions by comparing the gene expression of stem-like cells in diseased tissues with normal stem cells |
| Entrez ID | Symbol | Replicates | Species | Organ | Tissue | Adj P-value | Log2FC | Malignancy |
| 51501 | HIKESHI | LZE2T | Human | Esophagus | ESCC | 2.87e-06 | 6.91e-01 | 0.082 |
| 51501 | HIKESHI | LZE4T | Human | Esophagus | ESCC | 4.93e-17 | 4.58e-01 | 0.0811 |
| 51501 | HIKESHI | LZE5T | Human | Esophagus | ESCC | 3.15e-06 | 3.25e-01 | 0.0514 |
| 51501 | HIKESHI | LZE7T | Human | Esophagus | ESCC | 1.02e-08 | 3.70e-01 | 0.0667 |
| 51501 | HIKESHI | LZE8T | Human | Esophagus | ESCC | 1.13e-09 | 4.53e-01 | 0.067 |
| 51501 | HIKESHI | LZE20T | Human | Esophagus | ESCC | 4.05e-11 | 2.99e-01 | 0.0662 |
| 51501 | HIKESHI | LZE22T | Human | Esophagus | ESCC | 7.96e-06 | 2.76e-01 | 0.068 |
| 51501 | HIKESHI | LZE24T | Human | Esophagus | ESCC | 6.93e-36 | 1.01e+00 | 0.0596 |
| 51501 | HIKESHI | LZE6T | Human | Esophagus | ESCC | 2.93e-07 | 4.50e-01 | 0.0845 |
| 51501 | HIKESHI | P5T-E | Human | Esophagus | ESCC | 7.90e-03 | -1.65e-01 | 0.1327 |
| 51501 | HIKESHI | P22T-E | Human | Esophagus | ESCC | 1.66e-02 | -1.65e-01 | 0.1236 |
| 51501 | HIKESHI | P28T-E | Human | Esophagus | ESCC | 3.50e-02 | -1.65e-01 | 0.1149 |
| 51501 | HIKESHI | HCC1 | Human | Liver | HCC | 1.08e-04 | 2.12e+00 | 0.5336 |
| 51501 | HIKESHI | HCC2 | Human | Liver | HCC | 1.53e-05 | 2.30e+00 | 0.5341 |
| 51501 | HIKESHI | S014 | Human | Liver | HCC | 5.76e-45 | 1.22e+00 | 0.2254 |
| 51501 | HIKESHI | S015 | Human | Liver | HCC | 1.08e-35 | 1.36e+00 | 0.2375 |
| 51501 | HIKESHI | S016 | Human | Liver | HCC | 7.59e-45 | 1.32e+00 | 0.2243 |
| 51501 | HIKESHI | S027 | Human | Liver | HCC | 2.65e-13 | 9.41e-01 | 0.2446 |
| 51501 | HIKESHI | S028 | Human | Liver | HCC | 8.58e-31 | 9.80e-01 | 0.2503 |
| 51501 | HIKESHI | S029 | Human | Liver | HCC | 1.28e-33 | 1.26e+00 | 0.2581 |
| Page: 1 2 |
| Tissue | Expression Dynamics | Abbreviation |
| Esophagus | 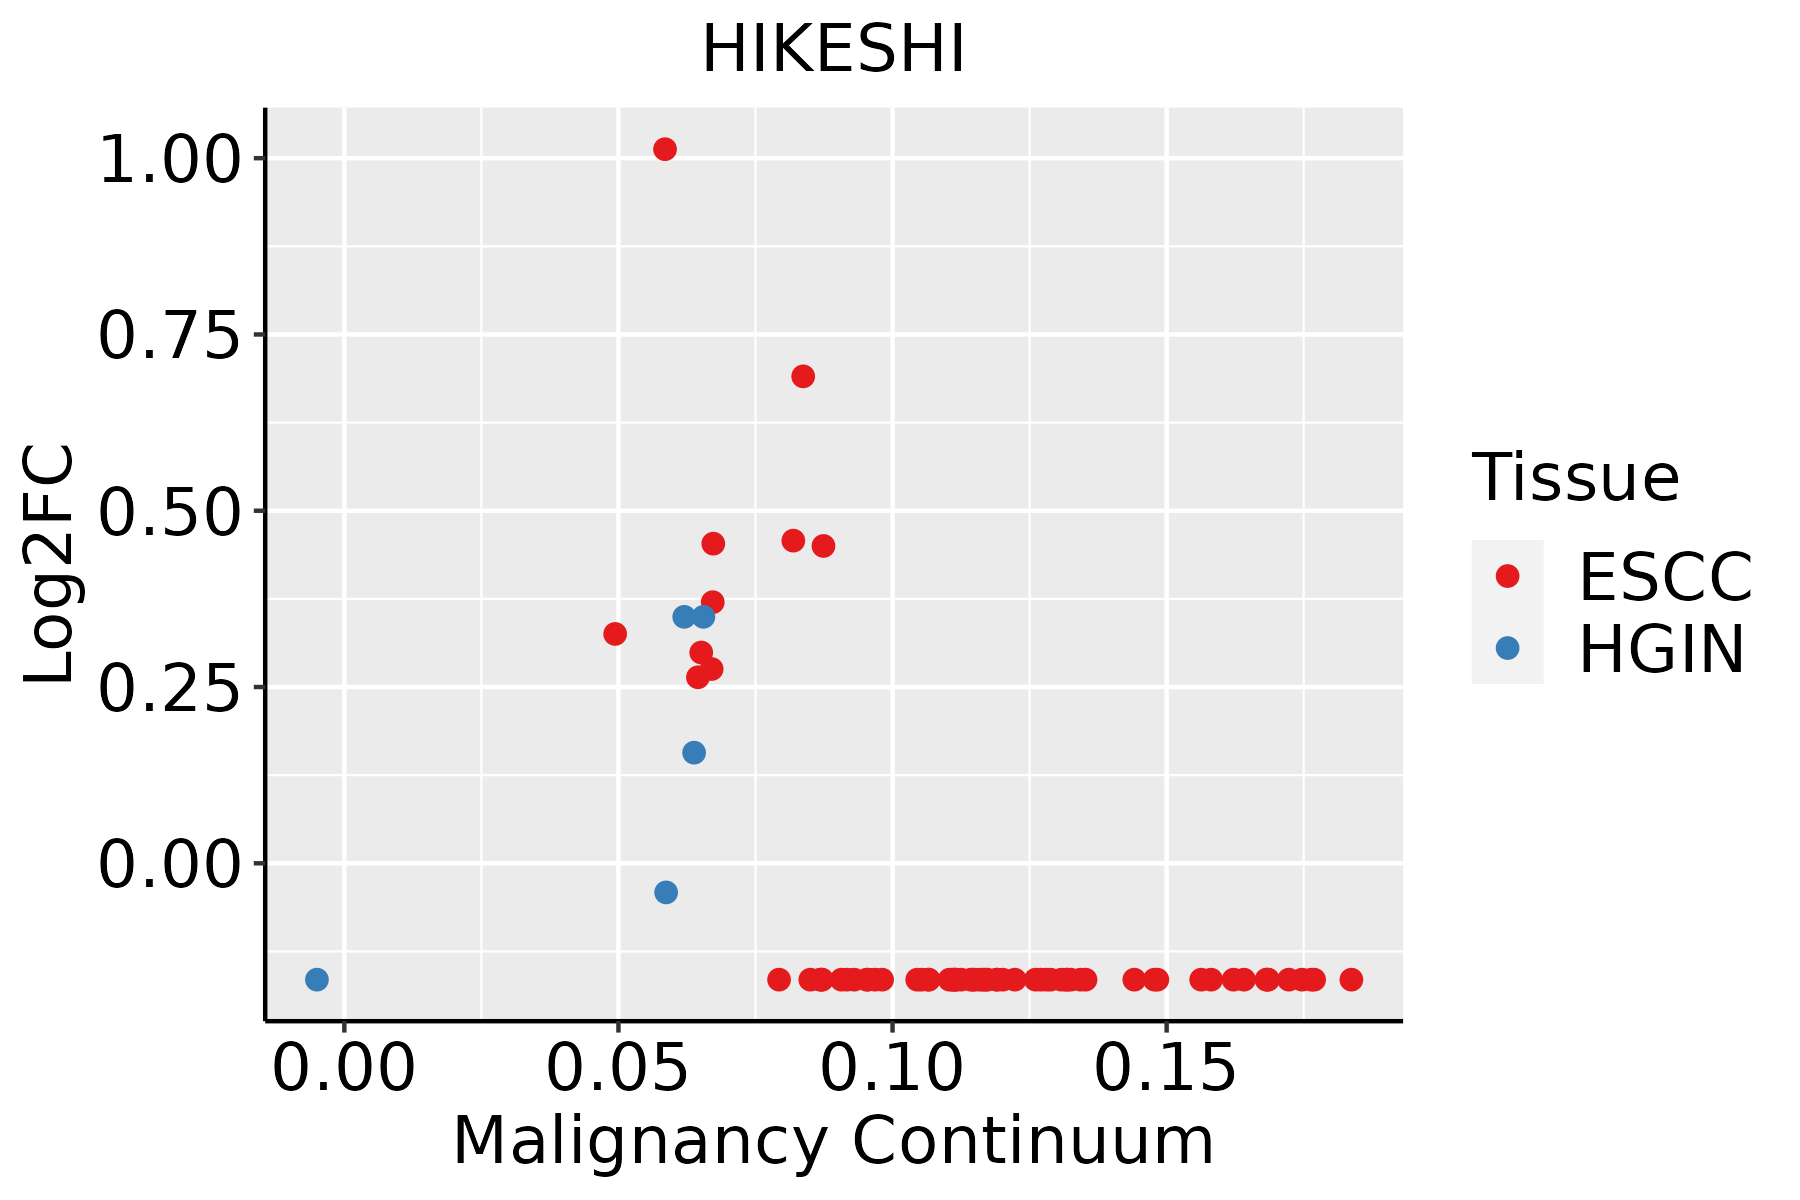 | ESCC: Esophageal squamous cell carcinoma |
| HGIN: High-grade intraepithelial neoplasias | ||
| LGIN: Low-grade intraepithelial neoplasias | ||
| Liver | 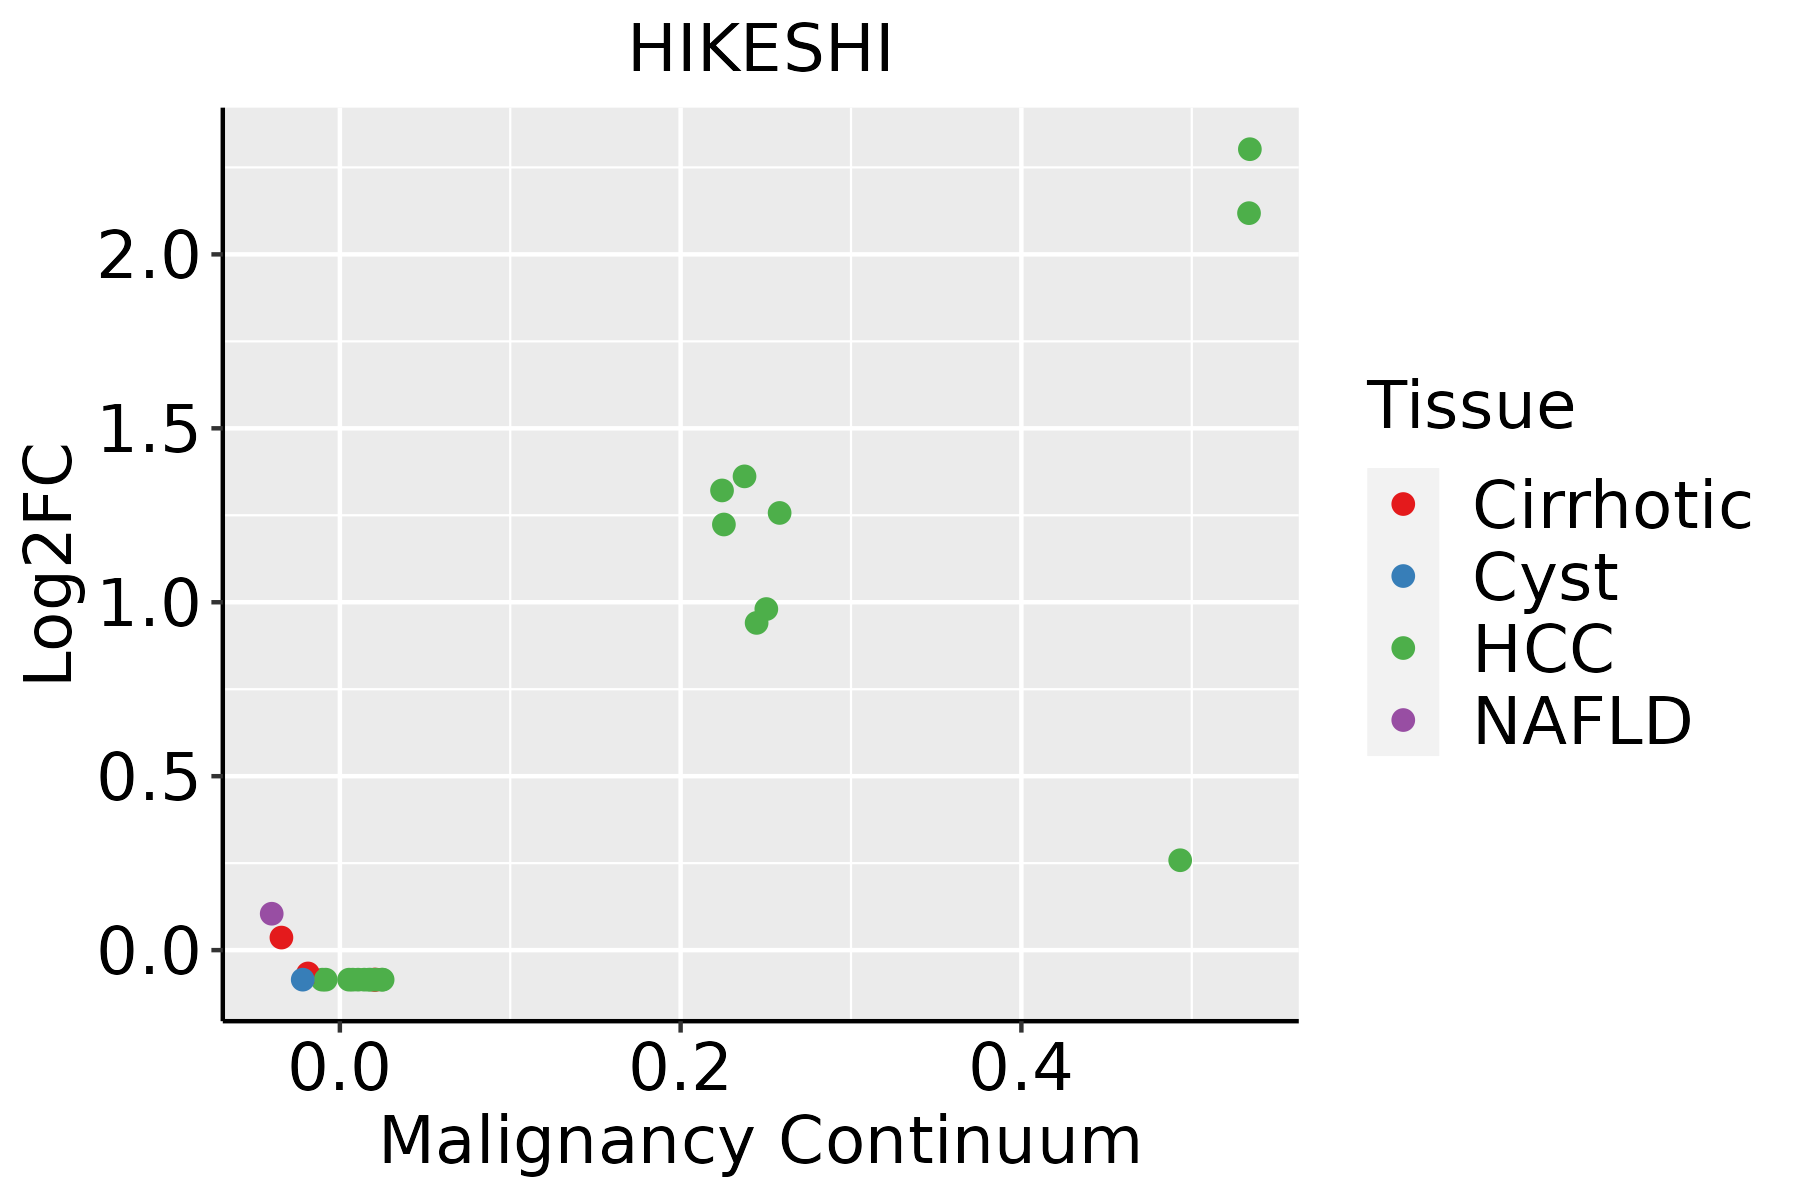 | HCC: Hepatocellular carcinoma |
| NAFLD: Non-alcoholic fatty liver disease | ||
| Thyroid | 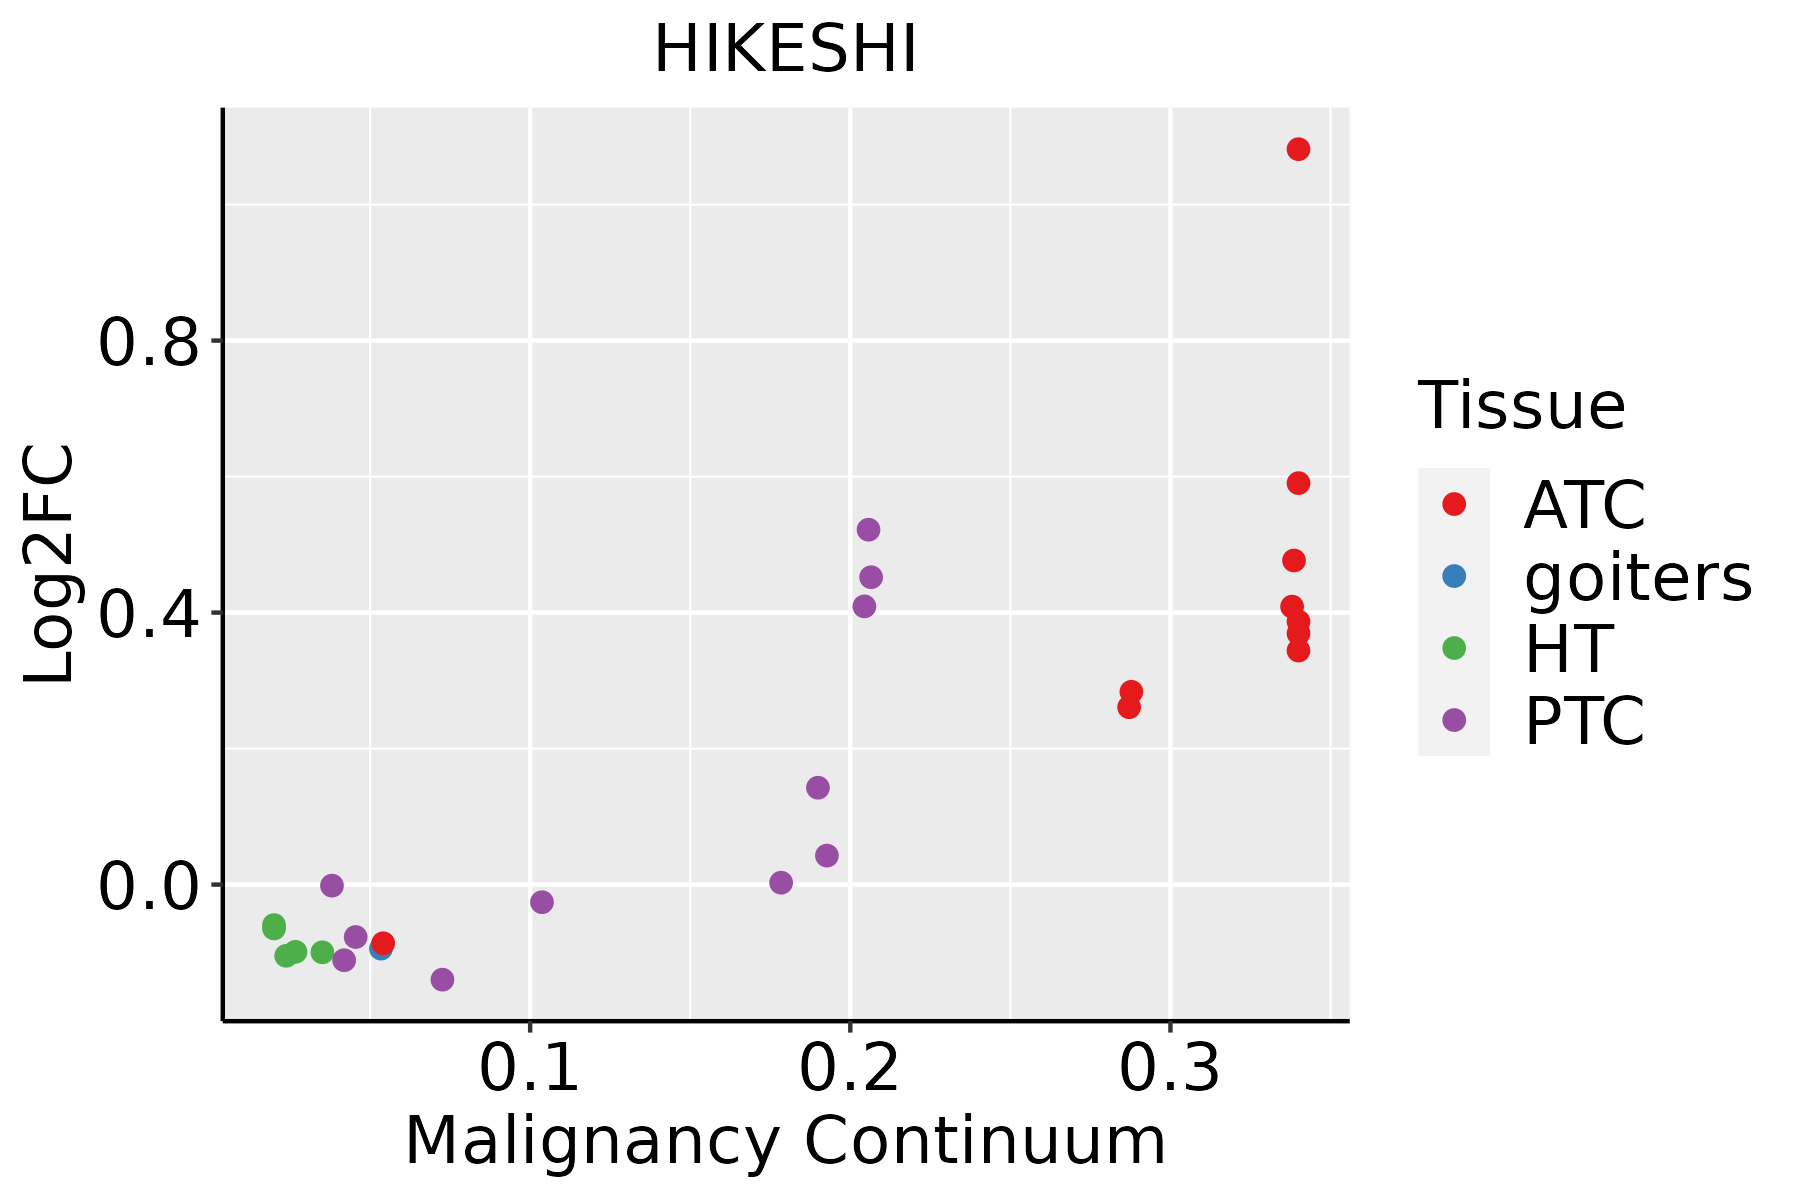 | ATC: Anaplastic thyroid cancer |
| HT: Hashimoto's thyroiditis | ||
| PTC: Papillary thyroid cancer |
| ∗log2FC in expression of this searched gene in stem-like cells from each diseased tissue sample relative to stem-like cells in normal samples in each tissue plotted against the malignancy continuum. Samples are colored based on if they are from different disease stage. |
Top |
Malignant transformation related pathway analysis |
| Find out the enriched GO biological processes and KEGG pathways involved in transition from healthy to precancer to cancer |
| Tissue | Disease Stage | Enriched GO biological Processes |
| Colorectum | AD |  |
| Colorectum | SER |  |
| Colorectum | MSS |  |
| Colorectum | MSI-H |  |
| Colorectum | FAP |  |
| ∗Top 15 enriched GO BP terms are showed in the bar plot of each disease state in each tissue. Each row represents a significant GO biological process which is colored according to the -log10(p.adjust). |
| Page: 1 2 3 4 5 6 7 8 9 |
| GO ID | Tissue | Disease Stage | Description | Gene Ratio | Bg Ratio | pvalue | p.adjust | Count |
| GO:0072594110 | Esophagus | ESCC | establishment of protein localization to organelle | 311/8552 | 422/18723 | 3.02e-32 | 2.13e-29 | 311 |
| GO:0006913110 | Esophagus | ESCC | nucleocytoplasmic transport | 230/8552 | 301/18723 | 6.04e-28 | 2.02e-25 | 230 |
| GO:0051169110 | Esophagus | ESCC | nuclear transport | 230/8552 | 301/18723 | 6.04e-28 | 2.02e-25 | 230 |
| GO:003450418 | Esophagus | ESCC | protein localization to nucleus | 211/8552 | 290/18723 | 4.06e-21 | 6.60e-19 | 211 |
| GO:001703818 | Esophagus | ESCC | protein import | 149/8552 | 206/18723 | 5.90e-15 | 3.31e-13 | 149 |
| GO:005117014 | Esophagus | ESCC | import into nucleus | 111/8552 | 159/18723 | 5.69e-10 | 1.44e-08 | 111 |
| GO:000660613 | Esophagus | ESCC | protein import into nucleus | 108/8552 | 155/18723 | 1.16e-09 | 2.77e-08 | 108 |
| GO:0009408110 | Esophagus | ESCC | response to heat | 77/8552 | 110/18723 | 2.01e-07 | 3.11e-06 | 77 |
| GO:0034605111 | Esophagus | ESCC | cellular response to heat | 52/8552 | 69/18723 | 4.87e-07 | 6.53e-06 | 52 |
| GO:00070308 | Esophagus | ESCC | Golgi organization | 101/8552 | 157/18723 | 1.78e-06 | 2.10e-05 | 101 |
| GO:00303239 | Esophagus | ESCC | respiratory tube development | 112/8552 | 181/18723 | 7.82e-06 | 7.69e-05 | 112 |
| GO:00605417 | Esophagus | ESCC | respiratory system development | 123/8552 | 203/18723 | 1.26e-05 | 1.15e-04 | 123 |
| GO:00303249 | Esophagus | ESCC | lung development | 109/8552 | 177/18723 | 1.40e-05 | 1.27e-04 | 109 |
| GO:000926619 | Esophagus | ESCC | response to temperature stimulus | 106/8552 | 178/18723 | 1.30e-04 | 8.84e-04 | 106 |
| GO:007259422 | Liver | HCC | establishment of protein localization to organelle | 299/7958 | 422/18723 | 1.06e-32 | 6.10e-30 | 299 |
| GO:000691322 | Liver | HCC | nucleocytoplasmic transport | 208/7958 | 301/18723 | 5.51e-21 | 8.12e-19 | 208 |
| GO:005116922 | Liver | HCC | nuclear transport | 208/7958 | 301/18723 | 5.51e-21 | 8.12e-19 | 208 |
| GO:003450421 | Liver | HCC | protein localization to nucleus | 194/7958 | 290/18723 | 2.84e-17 | 2.85e-15 | 194 |
| GO:001703811 | Liver | HCC | protein import | 140/7958 | 206/18723 | 1.12e-13 | 6.46e-12 | 140 |
| GO:003460512 | Liver | HCC | cellular response to heat | 53/7958 | 69/18723 | 6.62e-09 | 1.70e-07 | 53 |
| Page: 1 2 3 |
| Pathway ID | Tissue | Disease Stage | Description | Gene Ratio | Bg Ratio | pvalue | p.adjust | qvalue | Count |
| Page: 1 |
Top |
Cell-cell communication analysis |
| Identification of potential cell-cell interactions between two cell types and their ligand-receptor pairs for different disease states |
| Ligand | Receptor | LRpair | Pathway | Tissue | Disease Stage |
| Page: 1 |
Top |
Single-cell gene regulatory network inference analysis |
| Find out the significant the regulons (TFs) and the target genes of each regulon across cell types for different disease states |
| TF | Cell Type | Tissue | Disease Stage | Target Gene | RSS | Regulon Activity |
| ∗The dot plots of a searched regulon are shown for all cell subpopulations in each disease state of each tissue based on the regulon specific score inferred using pySCENIC and by calculating the average expression. |
| Page: 1 |
Top |
Somatic mutation of malignant transformation related genes |
| Annotation of somatic variants for genes involved in malignant transformation |
| Hugo Symbol | Variant Class | Variant Classification | dbSNP RS | HGVSc | HGVSp | HGVSp Short | SWISSPROT | BIOTYPE | SIFT | PolyPhen | Tumor Sample Barcode | Tissue | Histology | Sex | Age | Stage | Therapy Types | Drugs | Outcome |
| HIKESHI | SNV | Missense_Mutation | rs559792088 | c.221N>T | p.Thr74Met | p.T74M | Q53FT3 | protein_coding | deleterious(0) | probably_damaging(0.973) | TCGA-2W-A8YY-01 | Cervix | cervical & endocervical cancer | Female | <65 | I/II | Chemotherapy | cisplatin | CR |
| HIKESHI | SNV | Missense_Mutation | c.432N>T | p.Lys144Asn | p.K144N | Q53FT3 | protein_coding | deleterious(0) | probably_damaging(0.945) | TCGA-AA-A010-01 | Colorectum | colon adenocarcinoma | Female | <65 | I/II | Chemotherapy | folinic | CR | |
| HIKESHI | SNV | Missense_Mutation | rs766619246 | c.95G>A | p.Ser32Asn | p.S32N | Q53FT3 | protein_coding | tolerated(1) | benign(0.007) | TCGA-AP-A0LM-01 | Endometrium | uterine corpus endometrioid carcinoma | Female | <65 | III/IV | Chemotherapy | cisplatin | SD |
| HIKESHI | SNV | Missense_Mutation | novel | c.268N>A | p.Gly90Arg | p.G90R | Q53FT3 | protein_coding | tolerated(0.1) | possibly_damaging(0.731) | TCGA-AP-A1DK-01 | Endometrium | uterine corpus endometrioid carcinoma | Female | <65 | I/II | Unknown | Unknown | SD |
| HIKESHI | SNV | Missense_Mutation | novel | c.364N>A | p.Ala122Thr | p.A122T | Q53FT3 | protein_coding | tolerated(0.26) | benign(0.026) | TCGA-AP-A1DK-01 | Endometrium | uterine corpus endometrioid carcinoma | Female | <65 | I/II | Unknown | Unknown | SD |
| HIKESHI | SNV | Missense_Mutation | novel | c.188N>T | p.Gly63Val | p.G63V | Q53FT3 | protein_coding | deleterious(0.02) | benign(0.33) | TCGA-AP-A1DV-01 | Endometrium | uterine corpus endometrioid carcinoma | Female | <65 | I/II | Unknown | Unknown | SD |
| HIKESHI | SNV | Missense_Mutation | c.332T>G | p.Ile111Ser | p.I111S | Q53FT3 | protein_coding | deleterious(0) | probably_damaging(0.965) | TCGA-AX-A0J0-01 | Endometrium | uterine corpus endometrioid carcinoma | Female | <65 | I/II | Unknown | Unknown | SD | |
| HIKESHI | SNV | Missense_Mutation | c.120N>A | p.Met40Ile | p.M40I | Q53FT3 | protein_coding | deleterious(0.01) | benign(0.091) | TCGA-B5-A1MX-01 | Endometrium | uterine corpus endometrioid carcinoma | Female | <65 | I/II | Hormone Therapy | megace | SD | |
| HIKESHI | SNV | Missense_Mutation | novel | c.194N>A | p.Pro65Gln | p.P65Q | Q53FT3 | protein_coding | deleterious(0.05) | benign(0.035) | TCGA-BG-A222-01 | Endometrium | uterine corpus endometrioid carcinoma | Female | <65 | I/II | Unknown | Unknown | SD |
| HIKESHI | SNV | Missense_Mutation | rs201239774 | c.65N>C | p.Lys22Thr | p.K22T | Q53FT3 | protein_coding | deleterious(0.02) | probably_damaging(0.917) | TCGA-BK-A6W3-01 | Endometrium | uterine corpus endometrioid carcinoma | Female | <65 | I/II | Unknown | Unknown | SD |
| Page: 1 2 |
Top |
Related drugs of malignant transformation related genes |
| Identification of chemicals and drugs interact with genes involved in malignant transfromation |
| (DGIdb 4.0) |
| Entrez ID | Symbol | Category | Interaction Types | Drug Claim Name | Drug Name | PMIDs |
| Page: 1 |

Copyright 2023-Present -The University of Texas Health Science Center at Houston |